
Weather Events of the Decade
2010-2019
 With the end of 2019 comes an end to the second decade of the century and an end to a very interesting period of weather across northern Indiana, southwest lower Michigan, and northwest Ohio. We want to take time to reflect on these past 10 years and remember the important weather events that affected all of us at times and changed the lives of some forever. Our area saw wild weather ranging from devastating tornadoes to crippling winter storms, historic flooding, destructive winds and hail, and incredible lake effect snowfall. There were also periods of great weather as well. There were beautiful winter days with scenic hoar frost on trees, glittering ice creating natural winter wonderlands after damaging ice storms, and peaceful blankets of snow on the ground with crystal clear mornings. There were summers with picture perfect days of bright sunshine, low humidity and comfortable temperatures. For those who like summer heat there were many days with hot temperatures and sauna like conditions. There were mild winters with little snow and unseasonable warmth. But it really is the extreme weather events that had large impacts that we all really remember.
Student volunteer, Stephanie Voelkler, searched through our archives and compiled a list of nearly 30 weather events that occurred through the decade in our County Warning Area (CWA). By considering the type of event, the season, the year, its impacts, and significance, this list was cut in half and presented to the staff for voting by meteorologist Kyle Brown. For example, a list of ten severe weather events could have been complied, but is not a true representation of the breadth of weather events through the decade. Our office staff ranked ten of the fifteen events, where a rating of 1 generally meant "most impactful, most memorable and significant". The five events that each staff did not rank was given an artificial score of 15 points. Like golf, the lowest score "wins". The final list below was created from the median ranking. In the event of a tie, the average ranking was a factor.
Below is our listing of the most significant weather events of the 2010 to 2019 decade. The list goes from number 10 ranked event down to the number 1 ranked event. The title of each event contains a link to our Top Weather Events Page where you can find additional information.
We want to emphasize that all weather events are important and impact people on a daily basis. The list of events was created carefully to include a variety of events (e.g. tornadoes, winter weather, flooding) through a variety of months. This is simply our way of trying to determine those events which impacted many lives, had great significance in some way, changed lives, or even changed the way we do our important jobs, which is saving lives! Enjoy the following summary of events. If you have any questions or comments, feel free to send them to Kyle Brown at w-iwx.webmaster@noaa.gov.
10 Most Significant Weather Events of the Decade 2010-2019
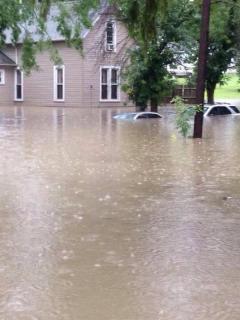
10. August 15, 2016 Flash Flooding in Northwest Indiana
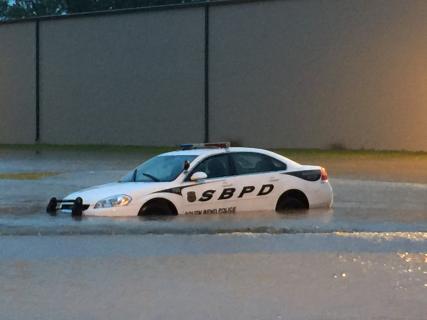 Rainfall rates of 1 to 2 inches per hour over several hours caused rapid runoff into low areas, rivers and streams. Stormwater systems in South Bend and surrounding areas were quickly overwhelmed with widespread flooding and even occurrences of flash flooding as water levels quickly rose and sending several feet of water into some city streets, forcing at least a dozen water rescues. Localized rain amounts exceeded 8 inches. In addition to the flooding, a low topped supercell raised havoc mainly across portions of central Indiana. The supercell moved into portions of Grant, Wabash and Huntington counties were numerous funnel clouds sighting were reported and recorded.
Photo Courtesy of South Bend Tribune
A powerful line of thunderstorms brought widespread wind damage to much of the Southern Great Lakes Friday June 18. Several reports of tree, structure, and crop damage were reported across the region as 60-90 mph winds roared across the area. Some areas that were hit the hardest included portions of La Porte, Berrien, and St. Joseph (IN) counties including the city of South Bend.
Photo Courtesy of Storm Prediction Center
8. January 28-31, 2019 Arctic Cold
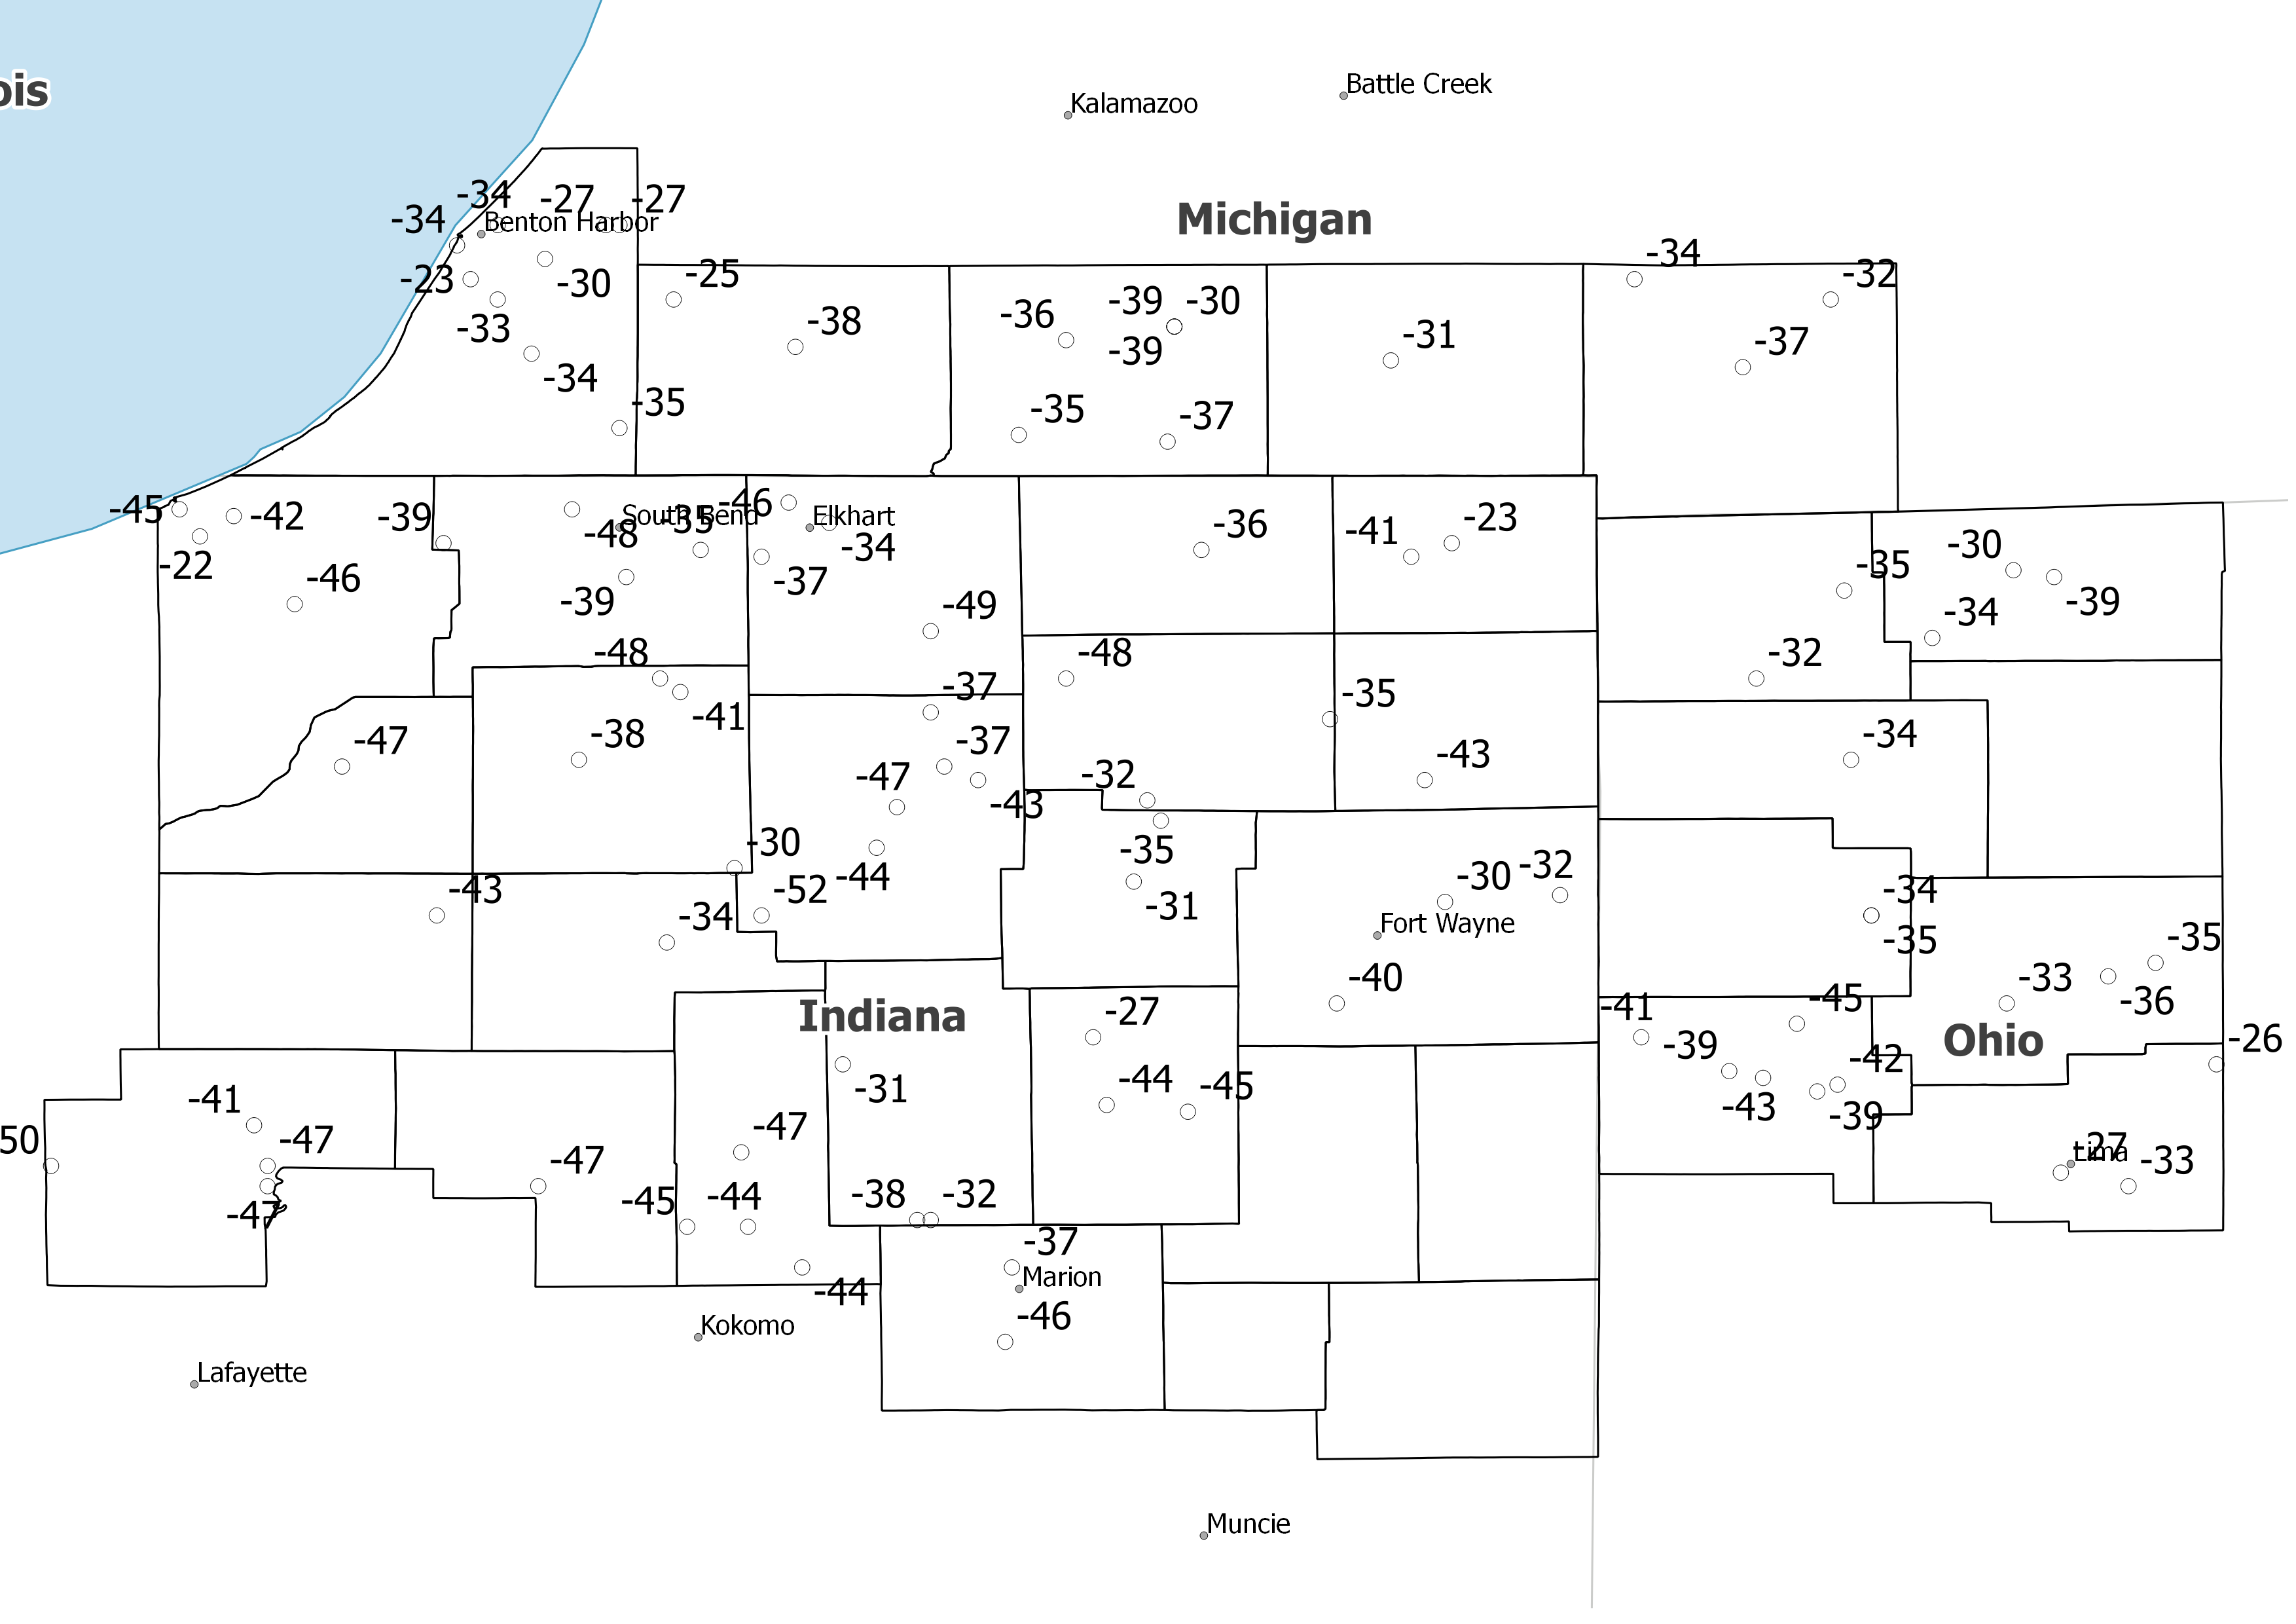
A dangerous arctic air mass overspread the region the night of January 28, 2019 into January 29, and affected the area through January 31. Wind chills as cold as -40°F to -50°F were reported during this event. Daily temperature records were set at both Fort Wayne and South Bend. The low temperature of -20°F at South Bend on January 30, 2019 is the 3rd coldest low temperature ever recorded at South Bend. The high temperature for that same date of -6°F, is the 3rd coldest high temperature ever recorded at South Bend. On the morning of January 28, as much as 10 inches of snow was reported in Berrien and Cass counties in Michigan. Away from the lake, amounts of 2-6 inches were common. However, northwest Ohio and locations toward central Indiana saw less than 1 inch.
Photo: Minimum observed wind chills
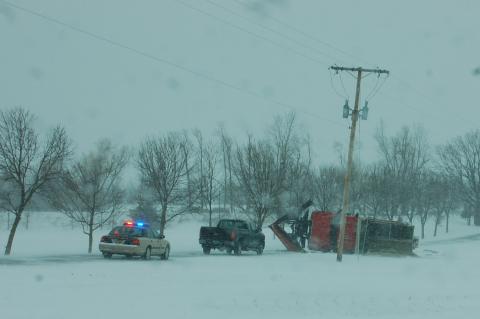
7. December 12-14, 2010 Lake Effect Snow and Lakeshore Flooding
A powerful winter storm dumped anywhere from 5 to 31 inches over the course of three 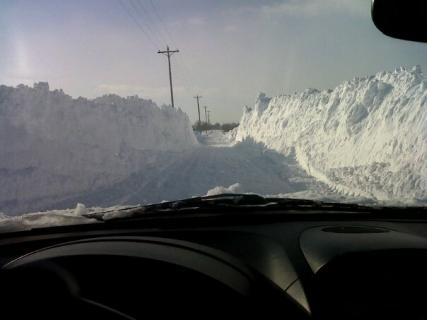 days. As the main storm system departed, a potent lake effect snow band developed. This brought the snow total in Wanatah, IN to 31.5 inches. Many sites in La Porte county saw at least 12". Strong winds with this storm made clearing roadways nearly impossible. As a result, many motorists became stranded in the snow. At the Lake Michigan shoreline, the Michigan City lighthouse reported winds in excess of 50 mph on the 12th. The U.S. Coast Guard reported waves of 15-18 feet on the morning of the 13th. This resulted in beach erosion and coastal flooding.
Photo Courtesy of Lori in Union Mills
6. Record Heat and Drought of 2012
Most locations across the area ended the winter season of 2011-2012 with near normal precipitation and below normal snowfall. This led to below normal snowmelt which usually adds a fair amount of moisture to the soil prior to the growing season. March featured record-breaking warmth, which led an early start to the growing season. This combined with lack of snowmelt in the winter led to abnormally dry conditions which developed across the region by the middle of April. Given much below normal rainfall in April and May, topsoil preconditioned for drought, and already low streamflow across area streams, rivers, and lakes, drought conditions developed across the local area and Midwest region by May. With high pressure remaining in control outside of some fast-moving low pressure systems, dry weather ruled the summer months. Record-breaking heat combined with the lack of substantial precipitation brought on devastating drought conditions. By the middle of July, all of the local area was entrenched in at least D2 or severe drought conditions with a large portion of the area in D3 or extreme drought conditions (on a scale from D0 to D4 drought severity). This resulted in catastrophic economic losses in agriculture. These conditions lasted until the middle of August as the atmospheric pattern became more active and some improvement in drought conditions occurred. Many counties issued burn bans and some sought voluntary reductions in water use.
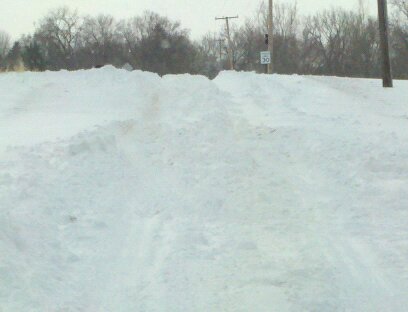
A quick-hitting blizzard affected much of northwest Ohio, northern Indiana, and southwest Lower Michigan during the afternoon and evening of February 1st. Precipitation began as mainly snow north of Highway 24, with a mixture of snow and sleet along and south of Highway 24 due to a warm layer aloft. This warm layer filtered northward during the evening which allowed the heavy snow to change over to sleet north of Highway 24. Sustained winds generally ranged between 30 and 40 mph in the evening, with gusts between 40 and 55 mph. This combined with the heavy snow and sleet created blizzard conditions, especially north of Highway 24, where visibility was reduced to < 1/8 mile for several hours early in the evening. Blizzard conditions abruptly came to an end during the overnight hours as low pressure tracked into northern Indiana and a dry slot moved into the area. 15.7 inches of snow was observed in Portage. 14.5 inches was observed in northeast South Bend, and 12.6 inches in the west-southwest side of Fort Wayne.
Photo Courtesy of Todd Holsten
4. November 17, 2013 Tornado Outbreak

Within a rare "high risk" convective outlook from the Storm Prediction Center, a Quasi-Linear Convective System (QLCS) raced across our area. Storms were moving at 60-75 mph.Embedded in this line were a number of tornadoes. There were 16 tornadoes within our County Warning Area, including an EF-3 tornado in Carroll and Cass (IN) counties. In the state of Indiana, there were 30 tornadoes. This ranks as the second most number of tornadoes in a single day behind June 2, 1990 when 37 tornadoes tore through the state. In addition to tornadoes, numerous reports of wind damage were received. Measured straight-line wind gusts reached as great as 85 mph, resulting in significant property damage such as large trees down, stoplights toppled, gas station awnings destroyed, and even rolled over mobile homes.
Photo Courtesy of NWS Northern Indiana
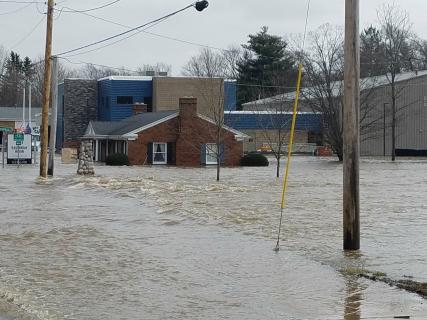 A melting snowpack, which contained anywhere from an inch to well over two inches of water, combined with an extended period of rainfall that dropped 4 to over 6 inches of rain, resulted in extensive flooding across across Michigan, Indiana, and Ohio. The greatest impacts from the flooding occurred across northwestern Indiana into southwestern Lower Michigan where record and even historic river crests were observed. Impacts continued for several days after the rain ended and some residents were unable to return to their homes due to the degree of damage by the flooding. Pending final review, four river gauge locations set a new record crest.
Photo Courtesy of NWS Northern Indiana
2. August 24, 2016 Tornado Outbreak

On August 24, 2016 there were a total of 22 confirmed tornadoes across Indiana and Ohio. 11 occurred in Indiana, and 11 occurred across Ohio. For NWS Northern Indiana's forecast area (IWX), there were a total of 14 tornadoes (four in northern Indiana, ten in northwest Ohio). The highest rated tornado in the IWX area was the EF-3 Woodburn, Indiana Tornado. Max wind speed was 160 mph, path length was 5.66 miles, max width was 500 yards. Time: 11 minutes-from 5:27 pm EDT-5:39 pm EDT. A unique combination of extreme low level moisture and a passing upper level disturbance provided the trigger for severe storms. Even though the clouds remained in place for most of the day and it did not get very warm, there was just enough instability to allow storms to develop. There was also a high degree of shear in the lowest levels of the atmosphere, which allowed multiple tornadoes to form.
Photo courtesy of Jaycee Riley
...and the number 1 event of the decade as remembered and voted on by NWS Northern Indiana Staff...
On Friday afternoon, an intense, long-lived windstorm called a Derecho formed in northwest Indiana and began carving a path of destruction over 600 miles long. Winds approaching 100 miles per hour were reported during the most intense part of the event (between Fort Wayne, IN and Columbus, OH.) At the peak of the event, the Fort Wayne International Airport observing equipment observed a peak wind gust of 91 mph, and the observer reported seeing a downburst descend from the cloud directly ahead of him. Winds were as strong as an EF-1 tornado over a widespread area which resulted in immense damage along the storm's entire path. Given the magnitude of the damage involved with this event and the subsequent extreme heat across much of the eastern United States, a Service Assessment was complied. This assessment can be viewed by clicking this link
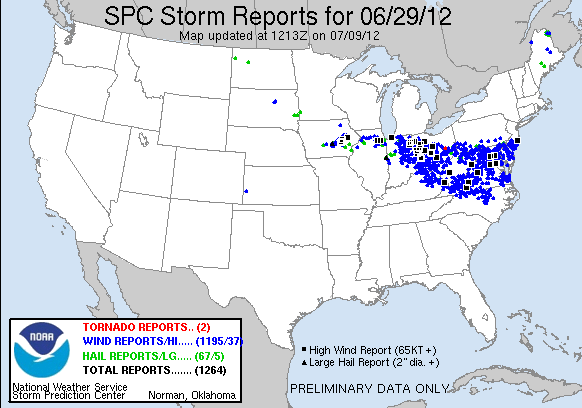

Photo Courtesy of Storm Prediction Center
Photo Courtesy Eric Davis
Visit our Top Weather Events page on our website anytime.
The list of the top weather events of the decade started with nearly 30 events! If you're looking for an event that didn't make the list, click the link above to visit our Top Weather Events page. You can find this anytime at the bottom right of our weather.gov/iwx homepage.
Story written by Kyle Brown, Climate Focal Point, NWS Northern Indiana
Template adapted from Sam Lashley, Warning Coordination Meteorologist, NWS Indianapolis
Special thank you to Student Volunteer, Stephanie Voelker, who created an initial list of top weather events
Input received from current NWS Northern Indiana Staff


