Below is a map of the 16 tornadoes that occurred across the NWS Northern Indiana forecast area during the November 17, 2013 severe weather outbreak. This includes one tornado that continued from NWS Chicago's area (Tornado #2) and one tornado that continued from NWS Indianapolis' area (Tornado #6).
30 tornadoes have confirmed in the state of Indiana for this outbreak. These findings indicate Sunday, November 17, 2013 is in second place for the number of tornadoes in one day in state history.
Date Number of tornadoes (statewide)
June 2, 1990 37
November 17, 2013 30
April 19, 2011 29
May 30, 2004 24
May 25, 2011 22
April 3, 1974 21
Damage Survey Reports
Widespread wind damage was reported across much of the area. NWS damage survey teams traveled across the region to survey areas of extensive damage. The final results of the surveys are below.
Click on the hyperlink for each tornado to get detailed information on each tornado such as path maps, radar images, and photos.
Details
RATING: EF-1
MAXIMUM ESTIMATED WIND SPEED: 110 mph
MAXIMUM ESTIMATED PATH WIDTH: 100 yards
PATH LENGTH: 13.29 miles
START TIME: Estimated around 3:03 PM EST
END TIME: Estimated around 3:13 PM EST
LOCATION: Touchdown occurred just southwest of US 421 and Delaware Street in Medaryville and lifted roughly 2.5 miles NE of Denham
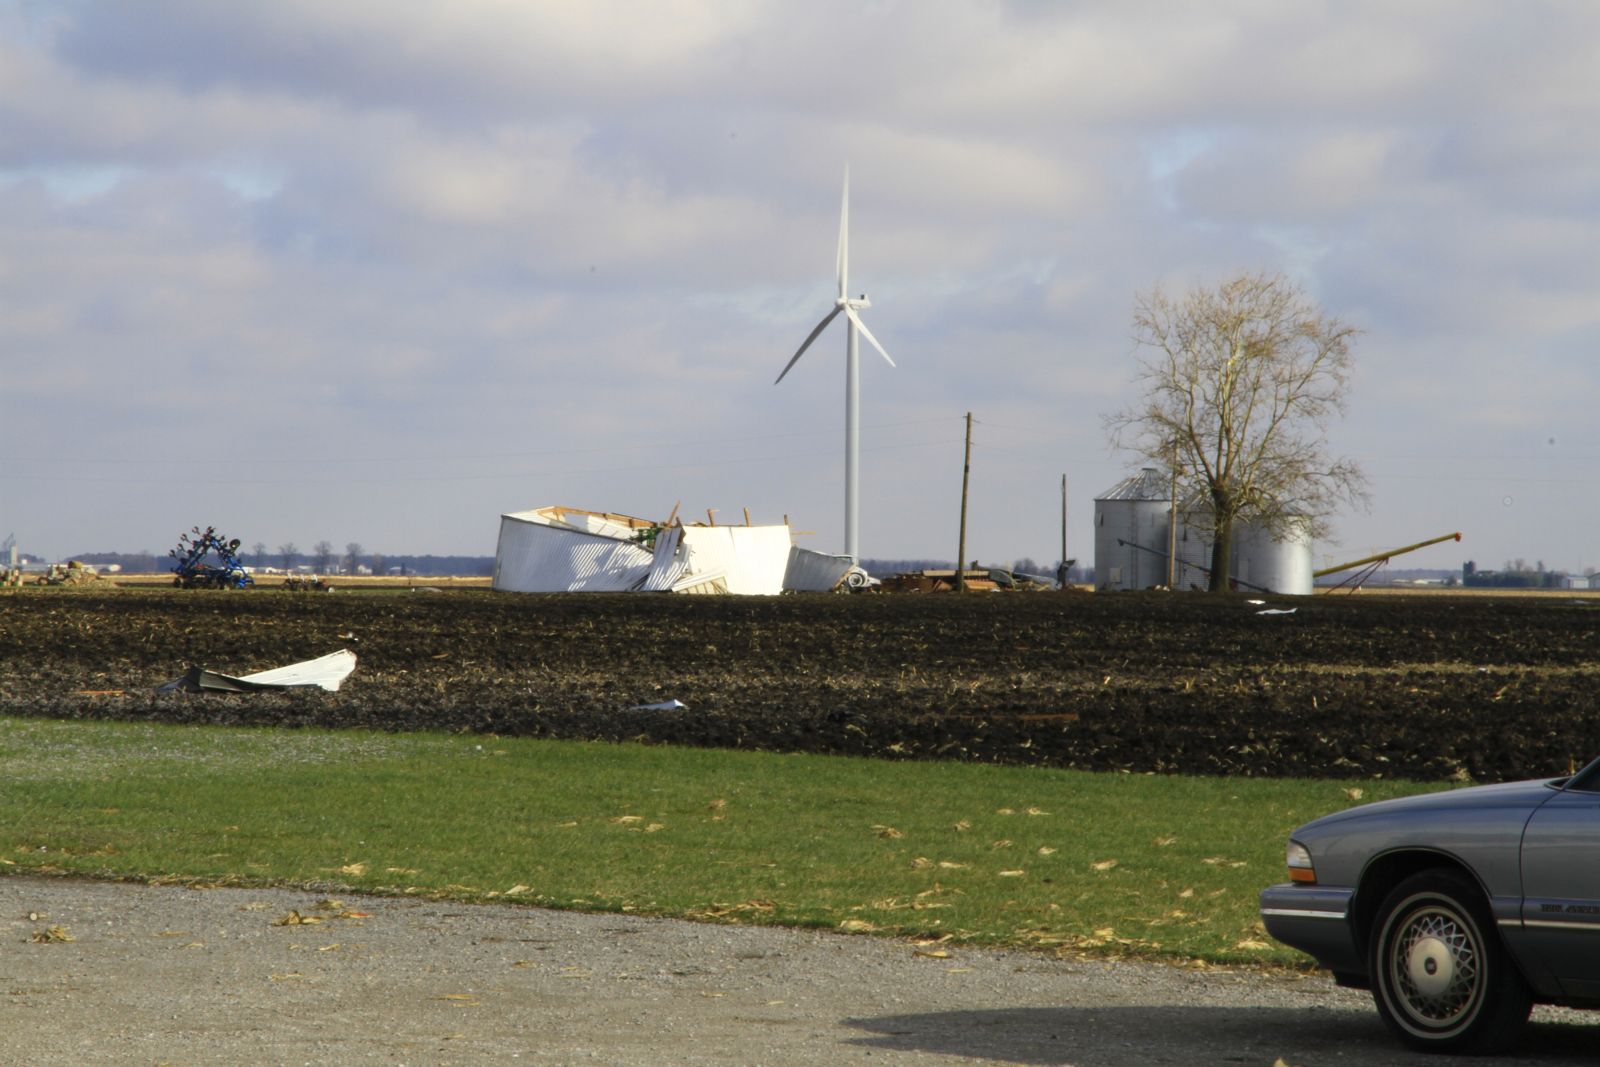
DESCRIPTION: A survey of damage in northern Pulaski county by emergency management and NWS officials revealed damage consistent with a EF1 tornado. The tornado touched down just southwest of U.S. 421 and Delaware Street in Medaryville. Several large, healthy trees suffered damage ranging from broken limbs to trees being snapped at the base (DI: TS DOD: 4). The tornado exited the town and remained over mainly rural areas moving across harvested fields and occasionally impacting groves of trees or center pivot irrigation systems. A barn was completely destroyed (DI: SBO DOD: 8) on North County Road 1050 West. The tornado entered the town of Denham impacting a grain bin, which was moved off its foundation and then flattened. The tornado cause minor tree damage and then lifted just before crossing into Starke county. The maximum wind speed is estimated at 110 mph..
Radar Images
 |
 |
 |
 |
| 2:59 PM EST Reflectivity (Z) & Storm Relative Velocity (SRV) |
3:03 PM EST Reflectivity & SRV |
3:08 PM EST Reflectivity & SRV |
3:12 PM EST Reflectivity & SRV |
 |
 |
 |
 |
Damage Pictures
Details
RATING: EF-2
MAXIMUM ESTIMATED WIND SPEED: 120 MPH
MAXIMUM ESTIMATED PATH WIDTH: 1200 yards
PATH LENGTH: 9.1 miles in White County. Total track 12 miles across Benton and White counties.
START TIME: Estimated around 2:46 PM EST
END TIME: Estimated around 2:55 PM EST
LOCATION: Entered White County near Benton/White/Tippecanoe County border as a continuation of Benton County tornado surveyed by NWS Chicago. Lifted approximately 2 miles WNW of Brookston.
DESCRIPTION: A survey of damage by NWS officials indicated that a tornado touched down in eastern Benton county and continued northeast into White county, likely reaching a peak intensity of EF2. Exact determination of maximum intensity was difficult due to vastly open country and lack of trees and other objects. The tornado moved into southwestern White county south of County Road 1200 South, where the garage door of a west facing pole barn was pushed in and some minor tree limb damage was noted. The tornado continued rapidly northeast and impacted a residence on 900 West where the chimney (above the roof) was knocked down with shingle damage noted to the home. In addition, a large propane tank and camper were rolled or pushed roughly 150 feet away with the camper being destroyed. The tornado moved into open fields where it remained for roughly four miles, crossing Interstate 65 between mile markers 188 and 190. The tornado briefly strengthened after crossing the interstate, snapping 10 18-24 inch diameter power poles (DI: ETL DOD: 4) at the ground along County Road 500 West, either side of State Route 18. A home on the intersection of these roads suffered minor window and roof damage. Just east of the intersection, a pole barn was destroyed (DI: SBO DOD: 8) with debris thrown upwards of three-quarters of a mile. The tornado finally lifted west of County Road 300 West and north of State Route 18. The tornado was on the ground for a combined distance of 12 miles from eastern Benton county into White county. A maximum width of roughly 1200 yards was determined with maximum wind speeds around 120 mph.
Radar Images
 |
 |
 |
 |
| 2:43 PM EST Reflectivity (Z) & Storm Relative Velocity (SRV) |
2:47 PM EST Reflectivity & SRV |
2:52 PM EST Reflectivity & SRV |
2:56 PM EST Reflectivity & SRV |
 |
 |
 |
 |
Damage Pictures

Details
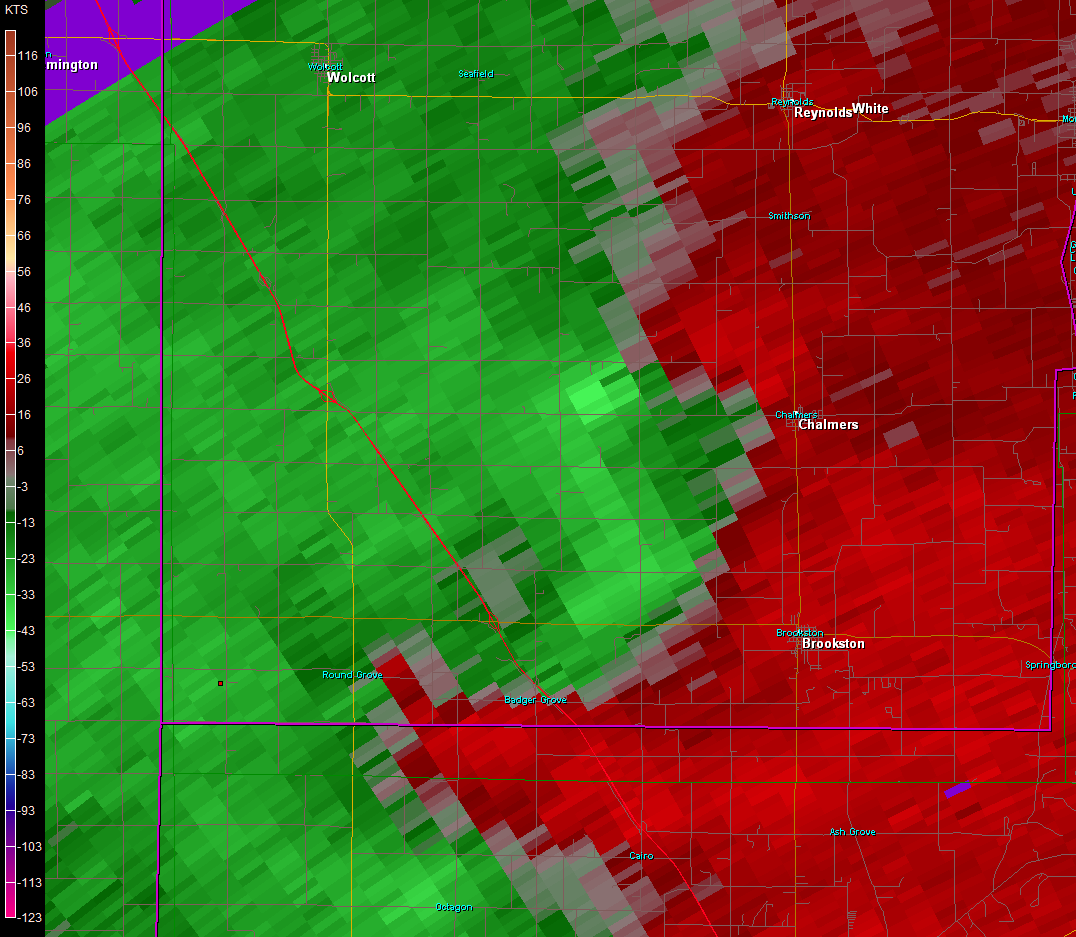
RATING: EF-2
MAXIMUM ESTIMATED WIND SPEED: 120 MPH
MAXIMUM ESTIMATED PATH WIDTH: 300 Yards
PATH LENGTH: 4.15 miles
START TIME: Estimated around 2:51 PM EST
END TIME: Estimated around 2:57 PM EST
LOCATION: 4 miles west of Chalmers to 2 miles north of Chalmers
DESCRIPTION: A NWS survey of damage revealed damage consistent with an EF2 tornado. The tornado touched down in an open field 4 miles west of Chalmers, northwest of the intersection of County Road 600 South and 450 West. The tornado crossed County Road 300 West, south of County Road 500 South where four 18 inch diameter power poles were snapped at the base (DI: ETL DOD: 4). Minor damage to siding and roofing was also observed at a home northeast of this location. A large pole barn in the same yard lost half of its roof while a barn next door to this residence was destroyed (DI: SBO DOD: 8) with debris from both locations being carried up to a mile to the northeast. One final barn suffered minor roof damage before the tornado lifted two miles north of Chalmers east of County Road 75 West and south of County Road 350 S. Maximum wind speeds were estimated around 120 mph.
Radar Images
| |
|
|
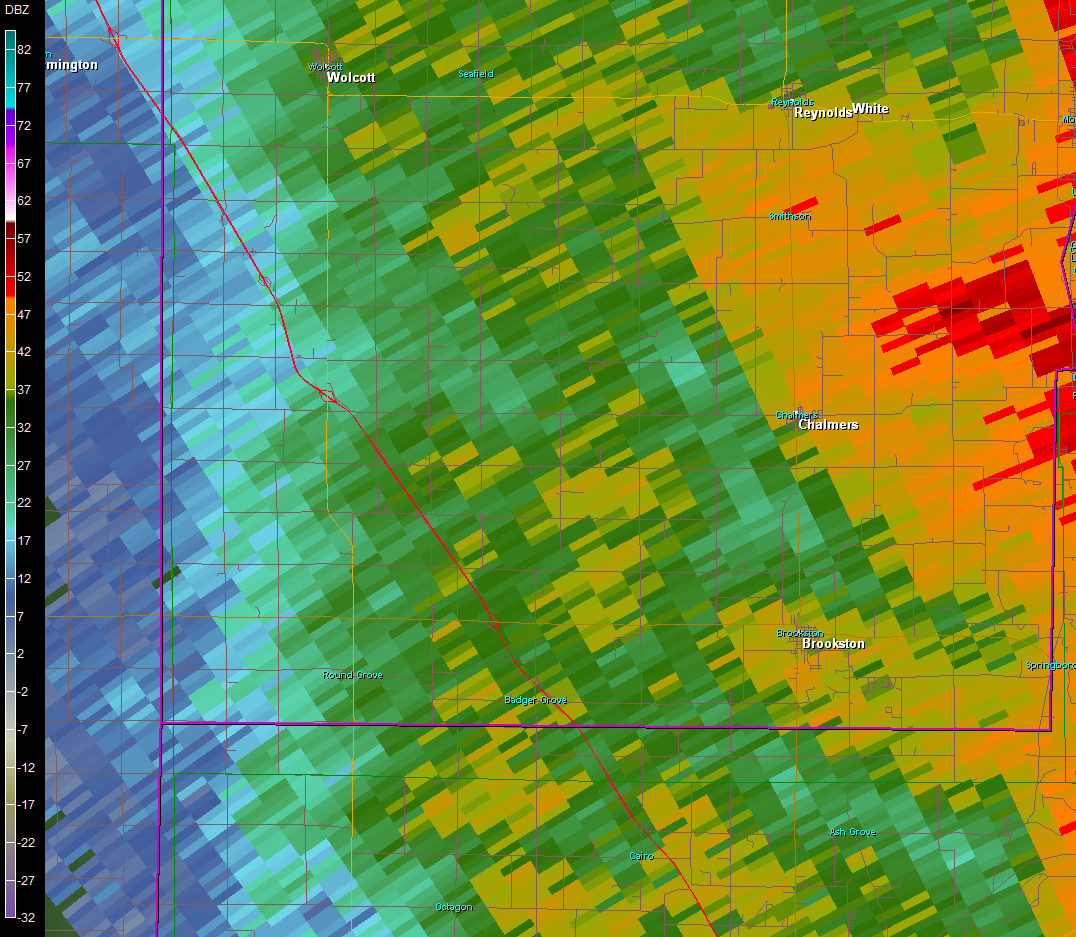 |
| 2:47 PM EST Reflectivity (Z) & Storm Relative Velocity (SRV) |
2:52 PM EST Reflectivity & SRV |
2:56 PM EST Reflectivity & SRV |
3:01 PM EST Reflectivity & SRV |
| |
|
|
 |
Damage Pictures
Details
RATING: EF-2
MAXIMUM ESTIMATED WIND SPEED: 120 MPH
MAXIMUM ESTIMATED PATH WIDTH: 900 yards
PATH LENGTH: 9.23 miles
START TIME: Estimated around 2:52 PM EST
END TIME: Estimated around 3:01 PM EST
LOCATION: Developed in far SW White County. Lifted approximately 4.5 miles W of Brookston.
DESCRIPTION:
A review of radar data and damage details near the southwestern White county tornado revealed a separate tornado, which also reached EF2 intensity, occurred roughly 10 minutes behind the first tornado. The tornado touched down west of County Road 1100 West and north of the White/Tippecanoe county line where it impacted a farm, destroying two barns (one large and one small) with debris being thrown more than a half mile away from the location. In addition, several healthy pine trees lost branches with a few being snapped at the trunk and then launched or dragged several hundred feet to the east. The tornado moved northeast and impacted a residence on US 231, south of County Road 1200 South. The entire roof of a one story home (DI: FR12 DOD: 6) was removed and thrown northeast into a field. Two by four boards were driven into the field up to 250 yards away. The tornado eventually crossed Interstate 65 hitting yet another farm with extensive barn and shed damage on County Road 500 West, south of State Route 18. Power pole damage was noted in this area as well, but was not clear if this was from the prior tornado just to the north. Northeast of this location, it appears that the tornado quickly dissipated or became harder to detect based on the earlier damage. Maximum winds are estimated at 120 mph.
Radar Images
| |
|
|
|
| 2:43 PM EST Reflectivity (Z) & Storm Relative Velocity (SRV) |
2:47 PM EST Reflectivity & SRV |
2:52 PM EST Reflectivity & SRV |
2:56 PM EST Reflectivity & SRV |
| |
|
|
|
Damage Pictures
Details
RATING: EF-1
MAXIMUM ESTIMATED WIND SPEED: 100 MPH
MAXIMUM ESTIMATED PATH WIDTH: 150 yards
PATH LENGTH: 0.81 miles
START TIME: Estimated around 3:07 PM EST
END TIME: Estimated around 3:08 PM EST
LOCATION: Northeast portion of White County. 1400 East between 400 North and 500 North
DESCRIPTION: A survey of damage in northeastern White county revealed damage consistent with a brief EF1 touchdown. The tornado touched down in an open field northeast of the intersection of County Road 400 North and 1350 East before flipping 4 sections of a center pivot irrigation system. As the tornado moved northeast a trailer was impacted removing the roof and taking down half of the walls (DI: MHSW DOD: 4). A woman was in the trailer home at the time it hit but made it to the bathroom as it was falling apart and survived with no injury. Debris from the trailer was thrown north and northwest into an adjacent field. The tornado continued northeast into a grove of trees where it continued less than 50 feet before lifting one quarter mile southwest of the intersection of County Roads 500 North and 1450 East. The maximum wind speed is estimated at 100 mph.
Radar Images
 |
 |
 |
| 3:01 PM EST Reflectivity & Storm Relative Velocity (SRV) |
3:06 PM EST Reflectivity & SRV |
3:11 PM EST Reflectivity & SRV |
 |
 |
 |
Damage Pictures
Details
RATING: Maximum Intensity of Tornado was EF-3 in Tippecanoe County. EF-2 was found in Cass County.
MAXIMUM ESTIMATED WIND SPEED: 120 MPH
MAXIMUM ESTIMATED PATH WIDTH: 250 yards
PATH LENGTH: Nearly 39 total miles across Tippecanoe, Carroll and Cass counties. Of that amount, 9.8 miles was in Cass county.
START TIME: 2:54 PM EST in Tippecanoe County with an estimated arrival in Cass County around 3:17 PM EST
END TIME: estimated around 3:27 PM EST (in Cass Co)
LOCATION: 1.5 Miles Northwest Of Young America To 3 Miles Southeast Of Walton
DESCRIPTION: An extensive NWS damage survey indicated a tornado briefly reached low end EF-3 intensity southeast of Lafayette continued through Tippecanoe and Carroll counties (see Storm Data for Central Indiana), crossing into Cass county just north of the intersection of County Road 1400 South and the Carroll/Cass county line. The tornado remained over mainly open fields until moving near a residence on County Road 150 East, south of 1250 South where a home had its chimney blown off and a barn on the property suffered a blown out wall. The tornado continued northeast and cause minor shingle damage to three homes on County Road 1250, west of County Road 300 East. A small barn was destroyed with debris thrown into an adjacent field. The tornado briefly intensified as it entered a grove of trees north of County Road 1200 South and west of 400 East where every tree for the first 100 feet was snapped five to ten feet above the base (DI: TH DOD: 4). The tornado remained over mainly open fields, occasionally causing minor tree damage until crossing US 35 north of County Road 1000 S where power poles were broken (DI: ETL DOD: 4). The tornado quickly lifted a few miles southwest of the Grissom Air Reserve Base. A maximum intensity of EF2 was reached while in Cass county, with estimated winds of 120 mph.
Radar Images
 |
 |
 |
| 3:16 PM EST Reflectivity (Z) & Storm Relative Velocity (SRV) |
3:21 PM EST Reflectivity & SRV |
3:26 PM EST Reflectivity & SRV |
 |
 |
 |
Damage Pictures
Details
RATING: EF-0
MAXIMUM ESTIMATED WIND SPEED: 85 MPH
MAXIMUM ESTIMATED PATH WIDTH: 150 yards
PATH LENGTH: 1.13 miles
START TIME: Estimated around 3:20 PM EST
END TIME: Estimated around 3:22 PM EST
LOCATION: 2 Miles Southwest of Logansport to 1 Mile South of Logansport
DESCRIPTION: A survey of damage in the Logansport area indicated that a EF0 tornado touched down west of Logansport Bypass Road and north of County Road 250 South. The tornado moved northeast and did minor damage to the roof of a local warehouse before crossing the bypass. A home on West Clinton Street suffered complete loss of its roof from the tornado (DI: FR12 DOD: 4). However, impact occurred on a sun room that had structural issues and aided in the wind being able to lift the roof of the house. Minor tree damage was found along the remainder of the tornado track until it lifted northeast of the intersection of Lincoln and South Cicott Streets. The maximum wind speed was estimated at 85 mph.
Radar Images
| |
|
|
| 3:16 PM EST Reflectivity (Z) & Storm Relative Velocity (SRV) |
3:21 PM EST Reflectivity & SRV |
3:26 PM EST Reflectivity & SRV |
| |
|
|
Damage Pictures
Details
RATING: EF-1
PATH LENGTH: Just under 0.5 miles
MAXIMUM ESTIMATED WIND SPEED: 110 MPH
MAXIMUM ESTIMATED PATH WIDTH: 50 yards
START TIME: Estimated around 3:27 PM EST
END TIME: Estimated 3:29 PM EST
LOCATION: Touchdown occurred just west of a high school in Cassopolis and lifted over a golf course just north of the high school
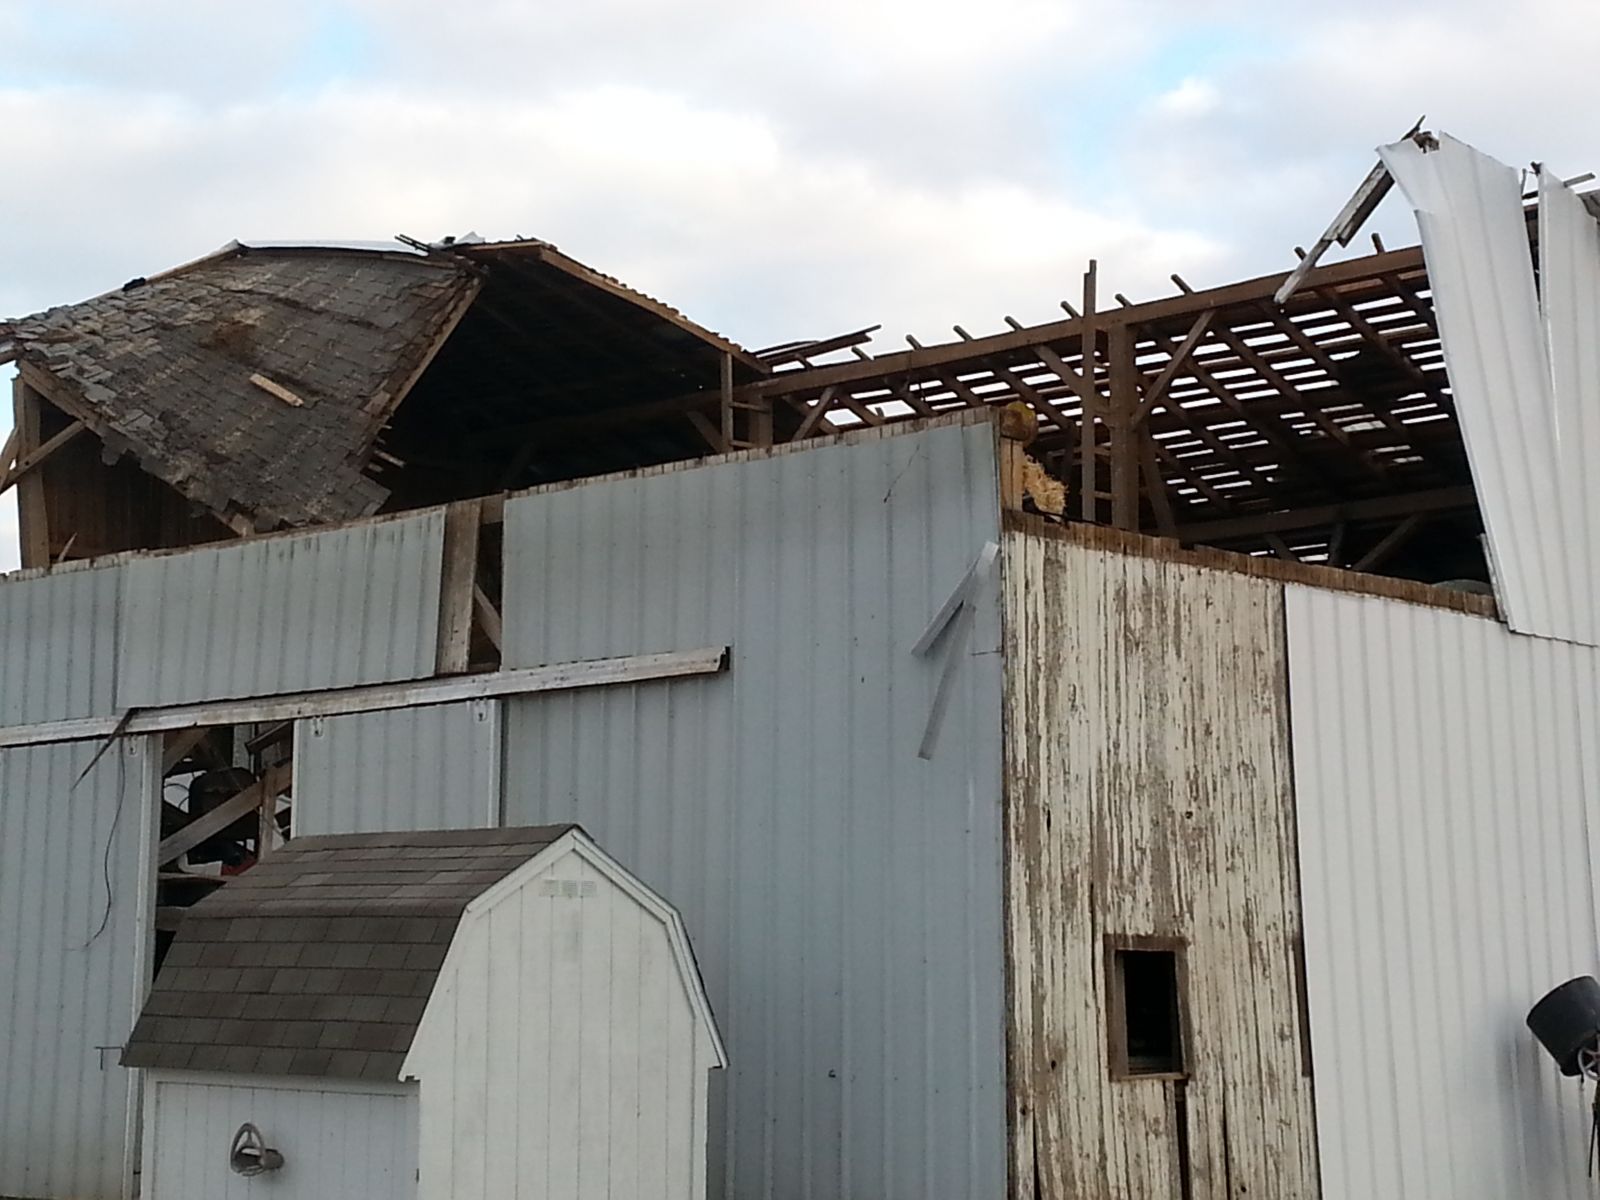
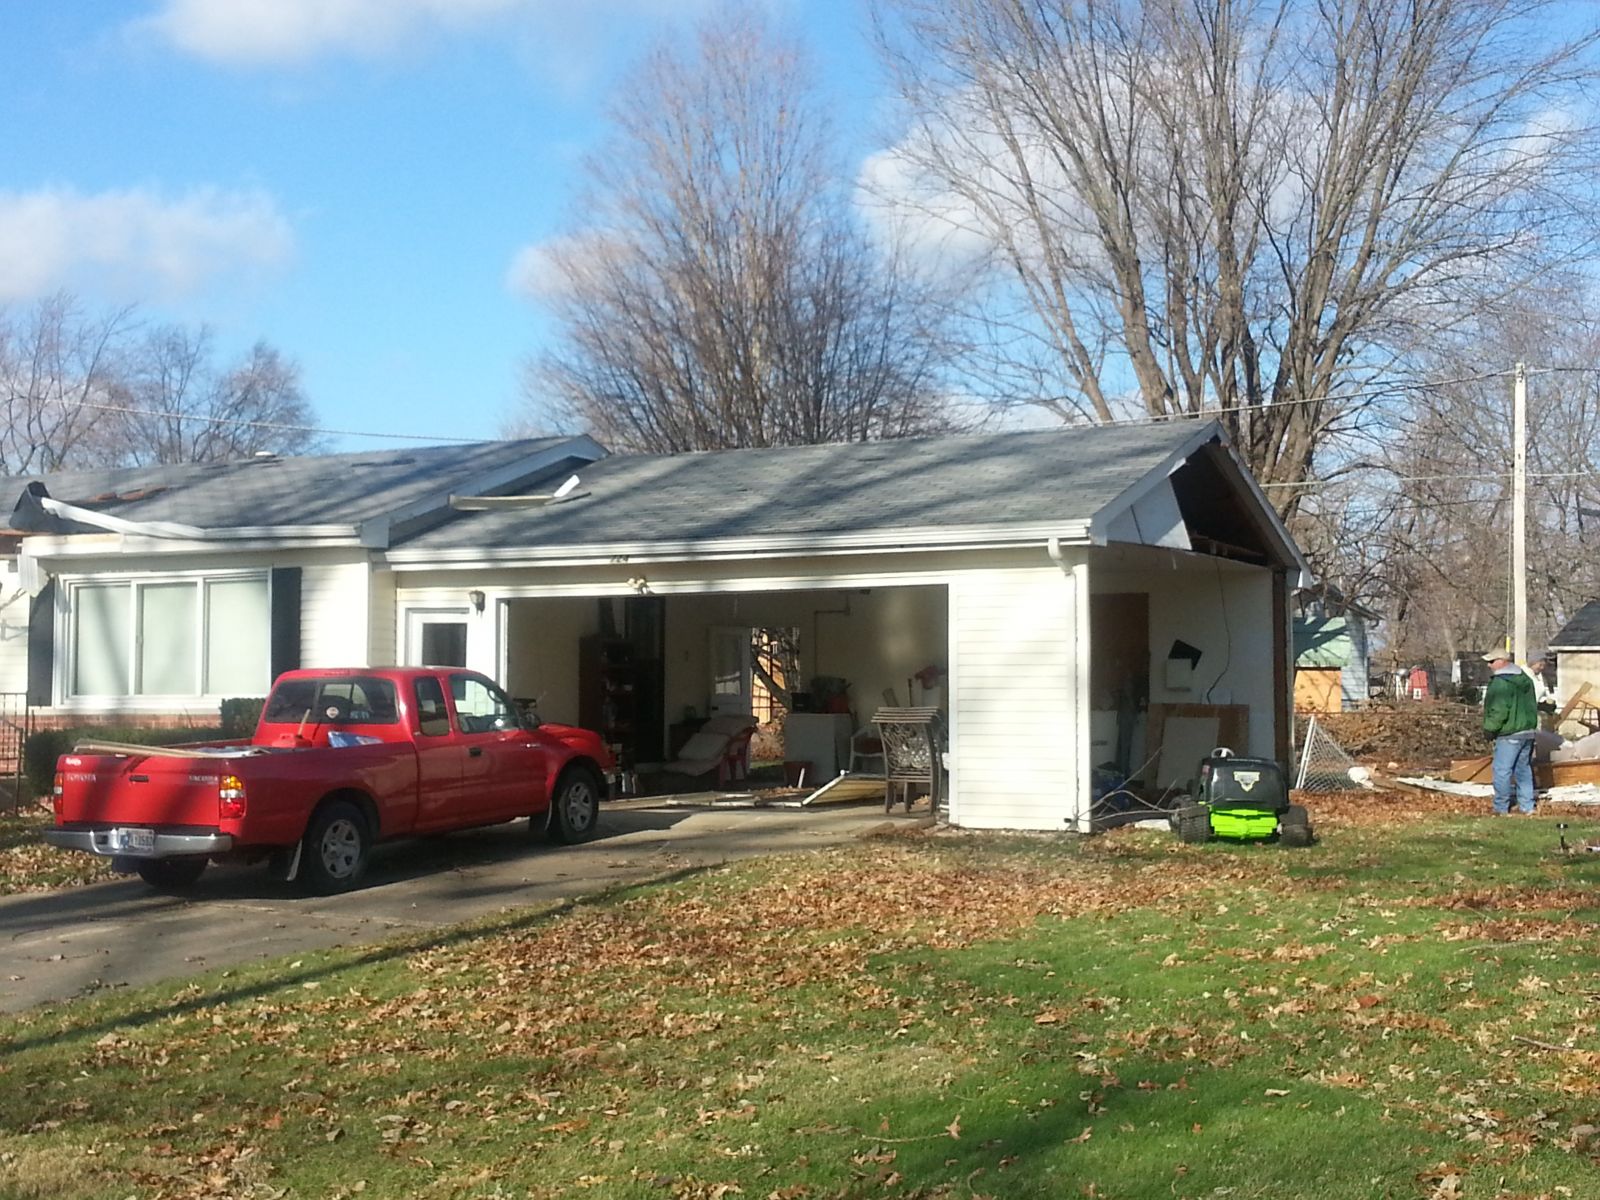
DESCRIPTION: A survey of damage in the Cassopolis area by a NWS Survey team revealed that a EF1 tornado produced damage along a roughly four tenths of a mile path. Touchdown occurred on the southern outskirts of Cassopolis at a farm where a older two story barn was severely damaged with the entire second story of the barn being destroyed with damage thrown upward of 200 yards downstream (DI: SBO DOD 8). The tornado continued quickly northeast, passing across the northwestern part of the Ross Beatty Jr./Sr. High School property and impacting a detached two car garage, causing its total destruction (DI: SBO DOD: 6). Debris was thrown up to 500 yards northeast from the point of impact onto the Park Shore Golf Course, where several trees were snapped or uprooted. Maximum wind speeds with the tornado are estimated at 110 mph.
Radar Images
 |
 |
 |
| 3:21 PM EST Reflectivity (Z) & Storm Relative Velocity (SRV) |
3:25 PM EST Reflectivity & SRV |
3:29 PM EST Reflectivity & SRV |
 |
 |
 |
Damage Pictures
Click on thumbnails for larger images.
Details
RATING: EF-1
MAXIMUM ESTIMATED WIND SPEED: 110 MPH
MAXIMUM ESTIMATED PATH WIDTH: 125 yards
PATH LENGTH: 2.87 miles
START TIME: Estimated around 3:30 PM EST
END TIME: Estimated around 3:33 PM EST
LOCATION: 1.5 miles north-northeast of Grissom AFB to 5 miles northeast Of Grissom AFB
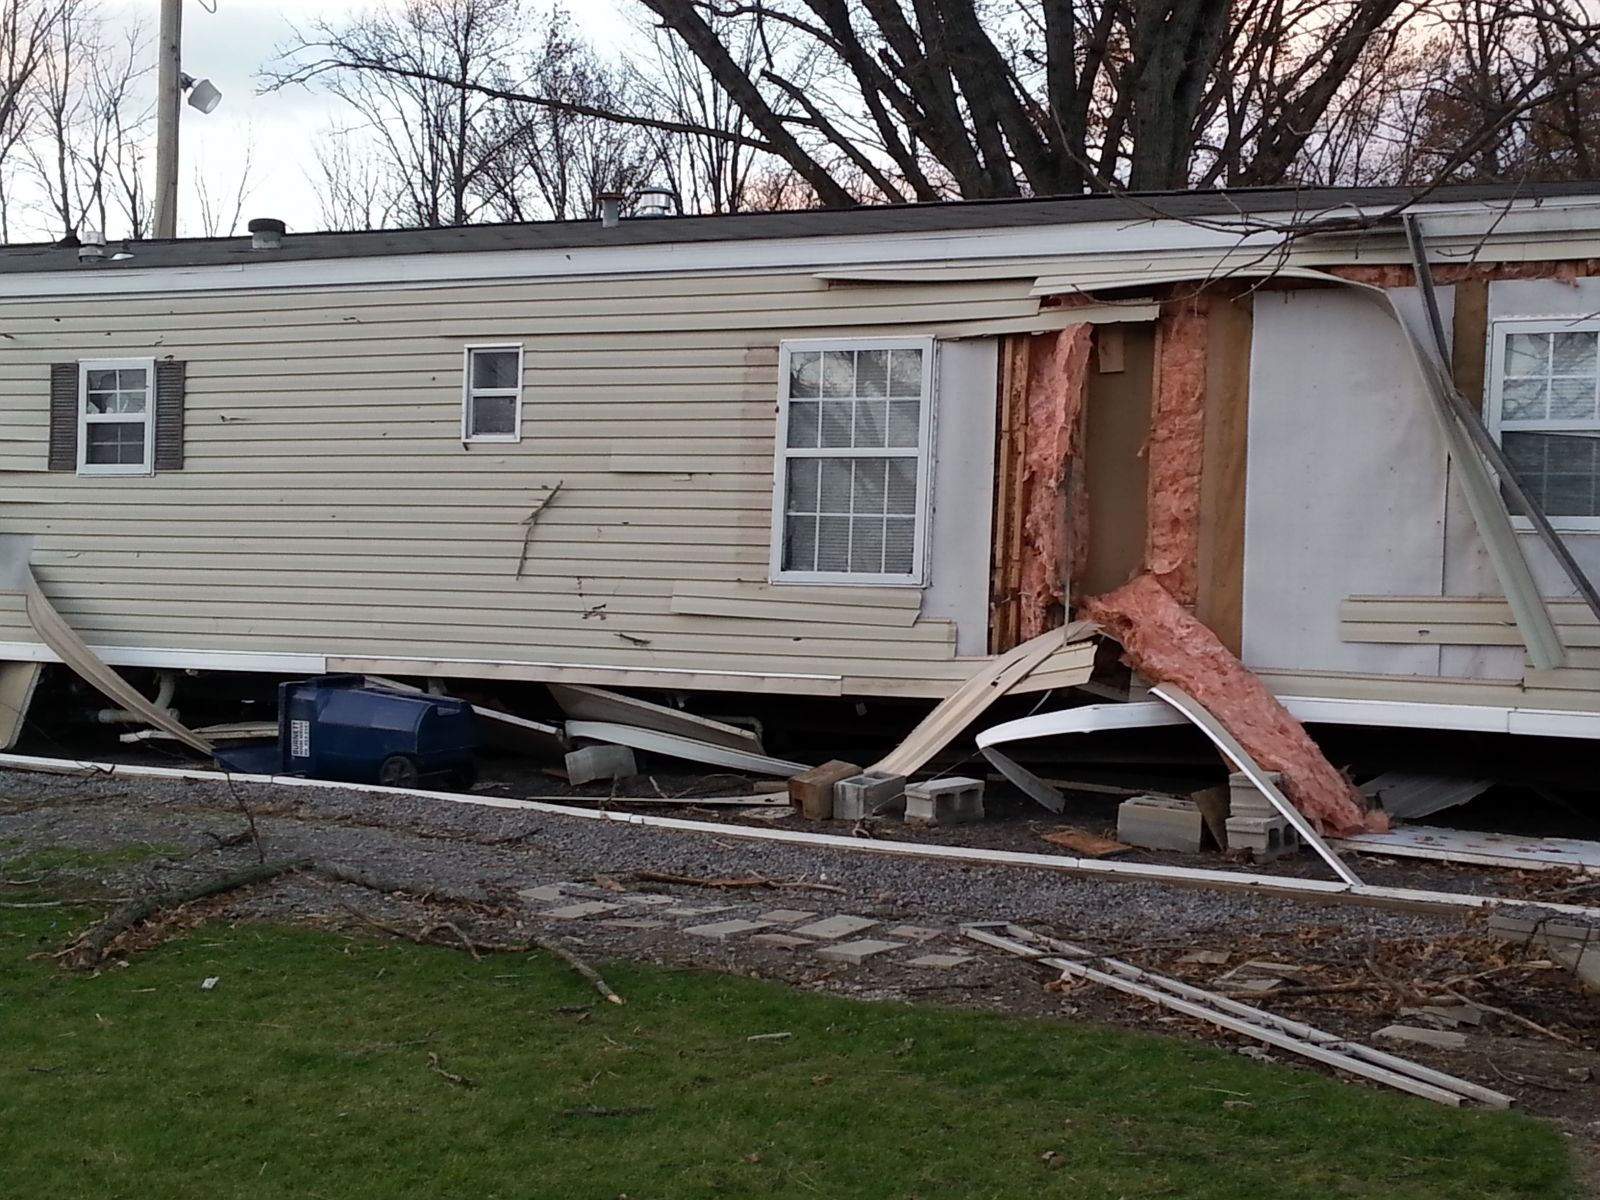
DESCRIPTION: A survey of damage by NWS and emergency management officials indicated a EF1 tornado occurred northeast of the Grissom Air Reserve base. The tornado touched down in a field southeast of the intersection of US 31 and County Road 500 South and then took the roof off of a hog barn. The tornado continued to travel east where it hit another hog barn and took off the roof and collapsed the walls (DI: SBO DOD: 6). One piece of wall (estimated near 1/2 ton) was thrown back into the eastern side of the building and smashed the exhaust system. The tornado then turned NE and did extensive tree damage to a grove of trees on county Road 50 West before hitting a trailer home where half of the walls were collapsed (DI: MHSW DOD:4) and insulation and pieces of debris were strewn out for a half mile to the NE. The tornado then lifted about a third of a mile northeast of the trailer. Maximum winds are estimated around 110 mph. Although the distance between the 2 points was around 2.6 miles, a somewhat wavy track caused the actual distance to be closer to 2.9 miles long.
Radar Images
 |
 |
 |
| 3:26 PM EST Reflectivity (Z) & Storm Relative Velocity (SRV) |
3:31 PM EST Reflectivity & SRV |
3:36 PM EST Reflectivity & SRV |
 |
 |
 |
Damage Pictures
Click on thumbnails for larger images.
Details
RATING: EF-1
PATH LENGTH: 1.1 MILES
MAXIMUM ESTIMATED WIND SPEED: 100 MPH
MAXIMUM ESTIMATE PATH WIDTH: 250 yards
START TIME: Estimated around 3:38 PM EST
END TIME: Estimated around 3:40 PM EST
LOCATION: Touchdown near intersection of SR 25 and S 800 W 2.5 miles east of Mentone and lifted 0.5 mile south of Shilling Road.
DESCRIPTION: A survey of damage east of Mentone by a NWS Survey team revealed that a EF1 tornado produced damage along a roughly 1 mile path. Touchdown occurred southwest of the intersection of State Route 25 and County Road 800 West with the tornado quickly moving northeast and impacting a residence and barn on the southeast corner of the same intersection. A few small hardwood trees were snapped with the adjacent residence suffering minor shingle damage. An adjacent barn was shifted off its foundation with the north facing doors and wall buckled. As the tornado crossed State Route 25 it clipped a residence, causing roughly 75 percent of the roof and trusses to be ripped off and thrown to the north northwest about 250 yards. Power poles on the north side of the road were also blown down. As the tornado continued northeast it cause widespread tree damage in a wooded area, as well as minor structural damage to a home along South Tinkey Road. The tornado lifted shortly after this point, southeast of the intersection of Tinkey and Shilling Roads. Maximum wind speeds with the tornado are estimated at 100 mph.
Radar Images
 |
 |
 |
3:33 PM EST Reflectivity (Z)
& Storm Relative Velocity (SRV) |
3:38 PM EST Reflectivity & SRV |
3:42 PM EST Reflectivity & SRV |
 |
 |
 |
Damage Pictures
Details
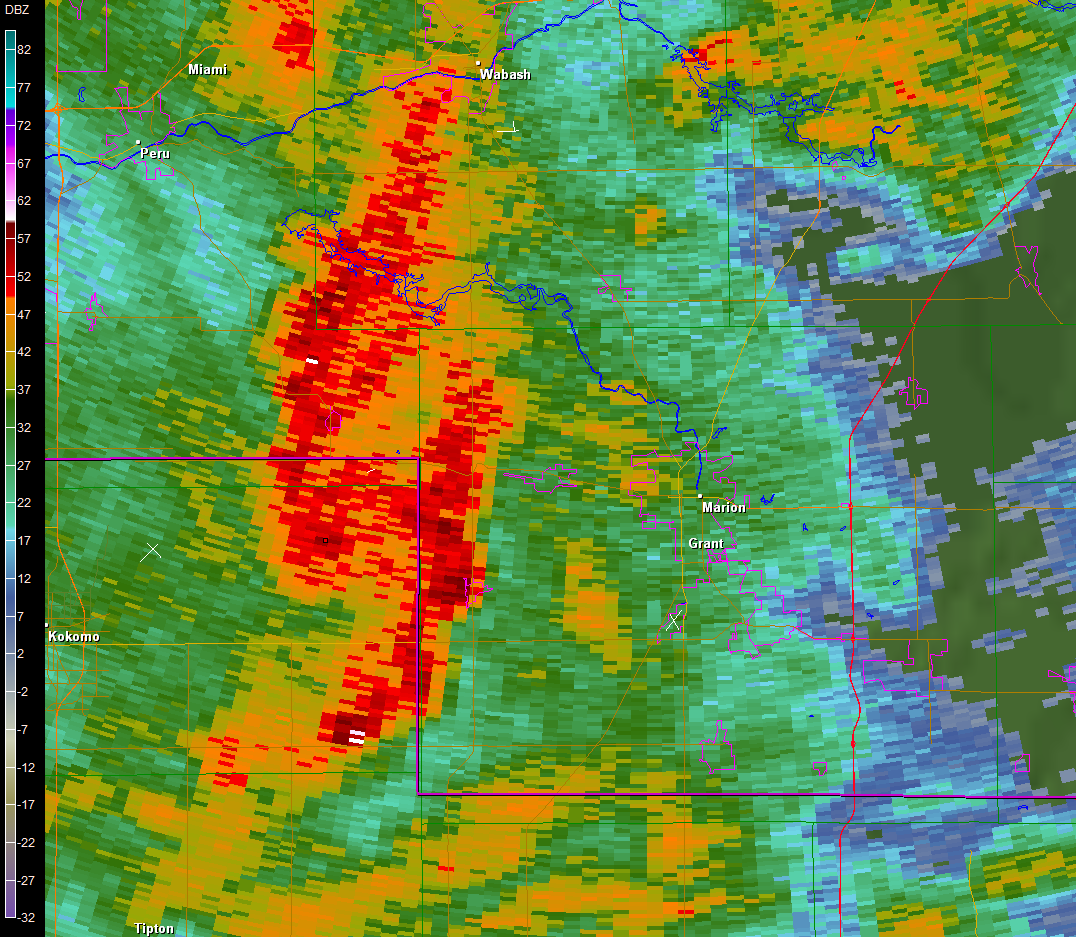
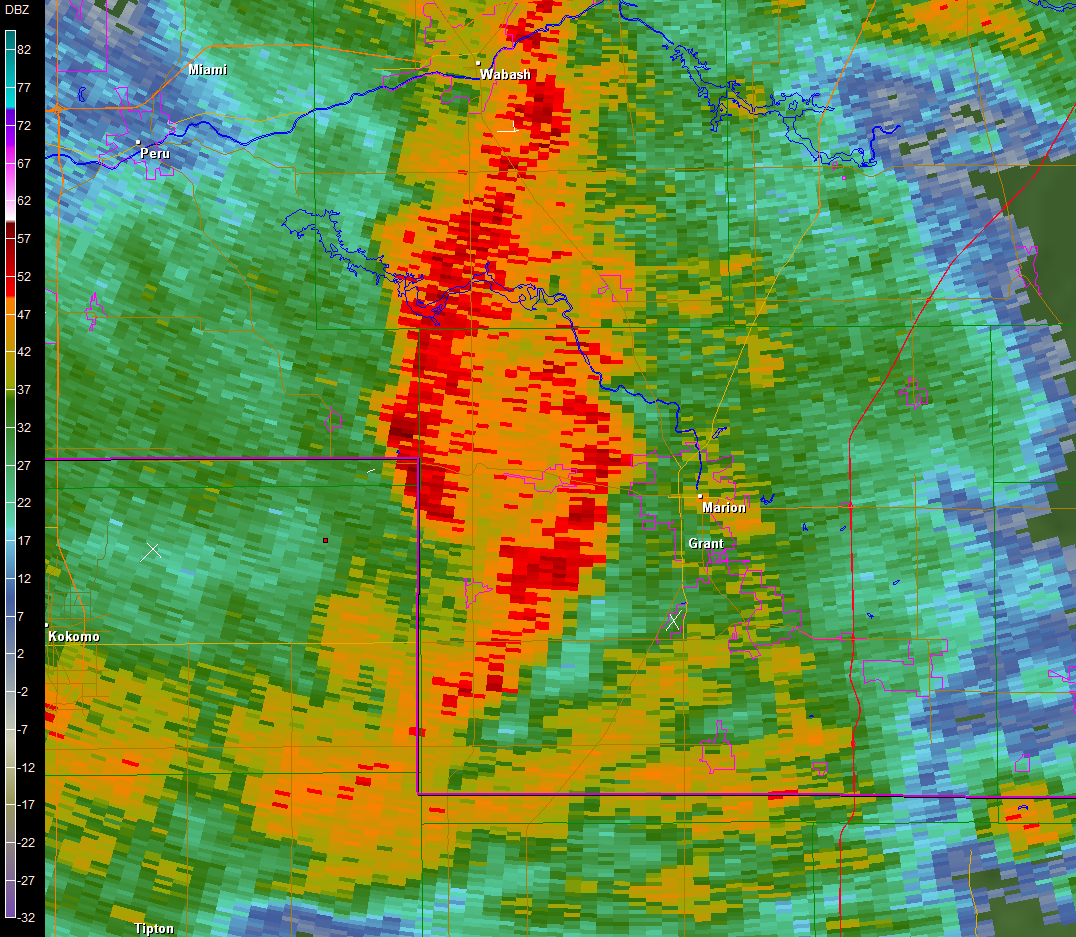
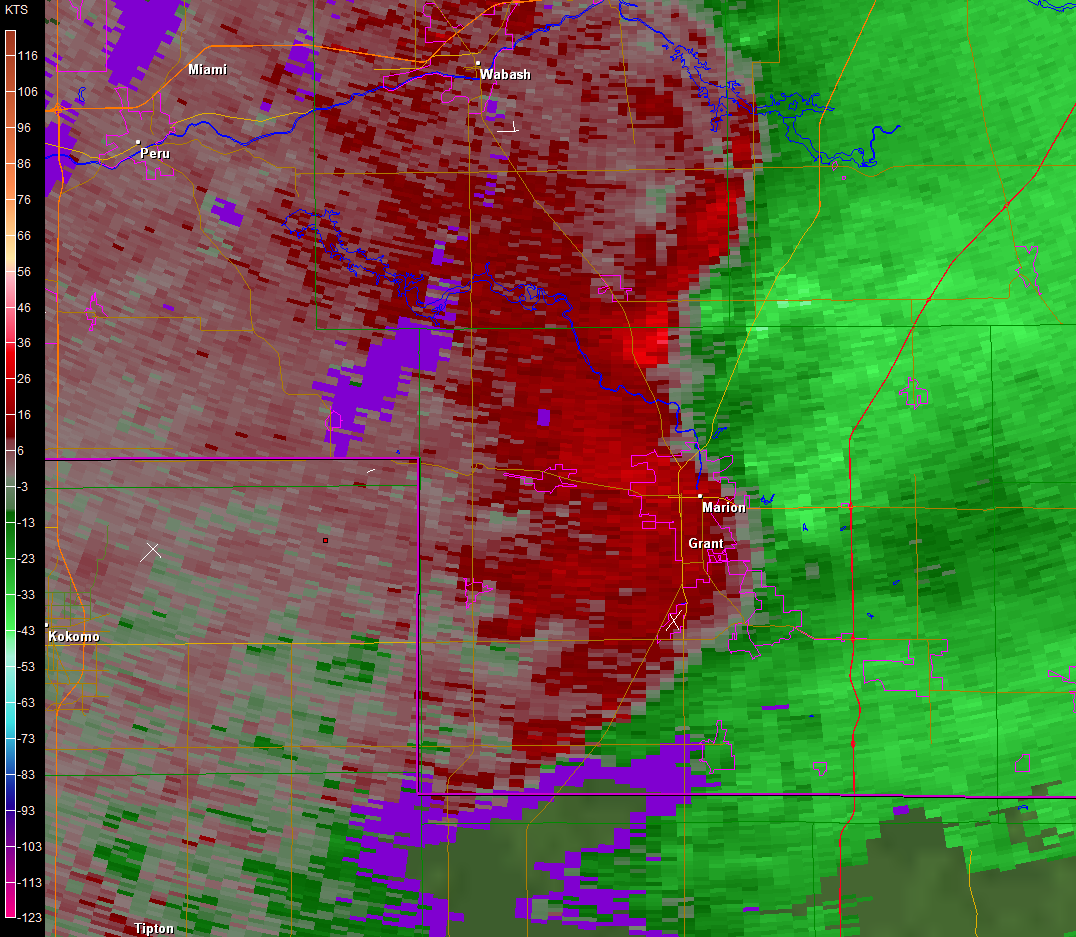
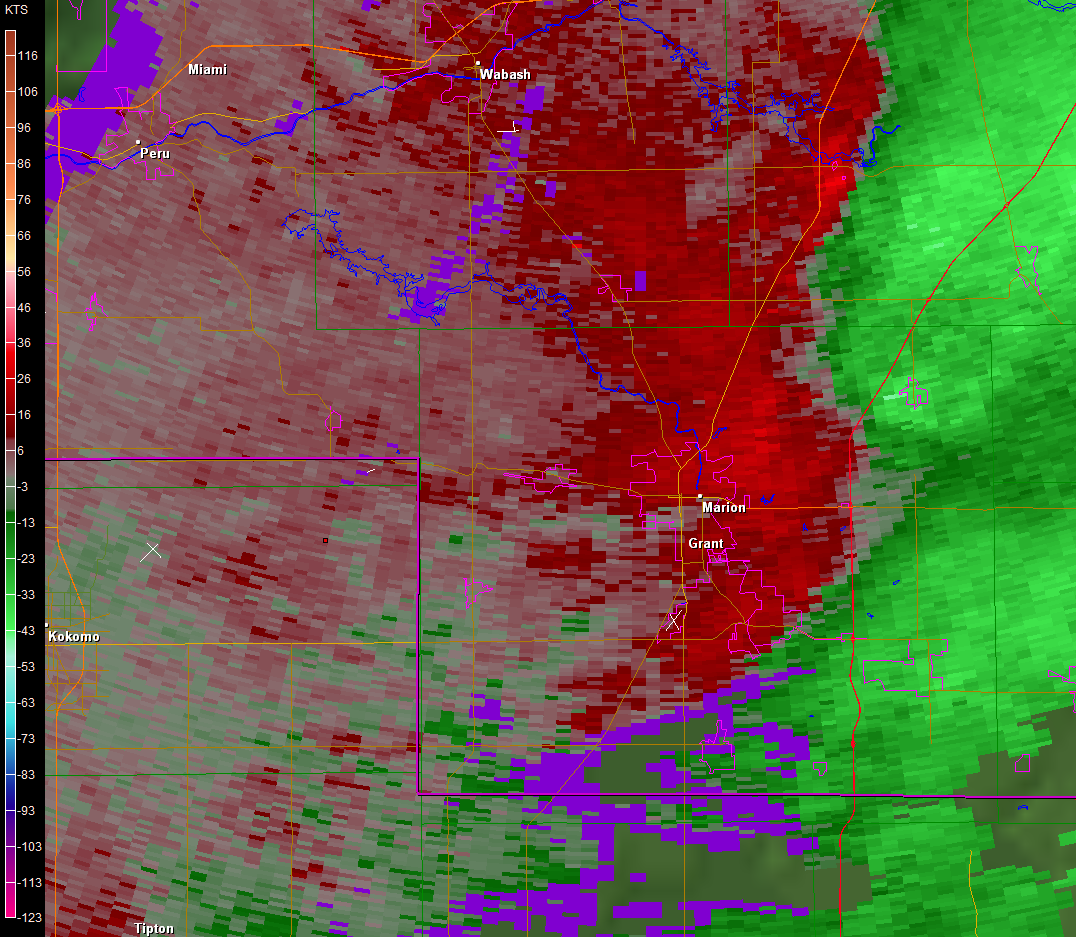
RATING: EF-2
MAXIMUM ESTIMATED WIND SPEED: 125 MPH
PATH LENGTH: 12 miles
PATH WIDTH: 0.4 miles
START TIME: Estimated around 3:42 PM EST
END TIME: Estimated around 3:52 PM EST
LOCATION: Path began 2 miles north-northwest of Sweetser and ended north of the Grant/Wabash county line on CR 700 N, east of CR 600 E
DESCRIPTION: A NWS survey of damage in Grant county indicated a tornado, reaching a maximum intensity of EF2, impacted a several mile long path. The tornado touched down on County Road 00 South, west of County Road 900 West where a hog barn suffered some roof damage. The tornado moved quickly northeast and intensified where it caused damage to two residences near the intersection of County Roads 300 North and 600 West. A large portion of the front wall of a one story home to collapse with subsequent removal of adjacent roof. A nearby home lost its entire roof (DI: MHSW DOD: 6). The tornado continued to intensify further approaching EF2 intensity as it cause extensive damage to a garage with the roof being removed and walls pushed down. Projectiles from the garage were found in the roof of the residence. EF2 intensity was reached around the intersection of County Road 325 West and Frances/Slocum Road where the top of a two story home was nearly removed (DI: FR12 DOD: 6). The tornado slowly weakened the remainder of its track impacting other residences with decreasing amounts and intensity of roof damage. Trees also suffered varying degrees of damage. The tornado cross briefly into Wabash county west of Grant County Road 00 West/Wabash County Road 600 East. The tornado was on the ground for over 11.5 miles with winds reaching a maximum intensity of around 125 mph.
Radar Images
 |
 |
 |
 |
3:38 PM EST Reflectivity (Z)
& Storm Relative Velocity (SRV) |
3:42 PM EST Reflectivity & SRV |
3:46 PM EST Reflectivity & SRV |
3:51 PM EST Reflectivity & SRV |
 |
 |
 |
 |
Damage Pictures
Details
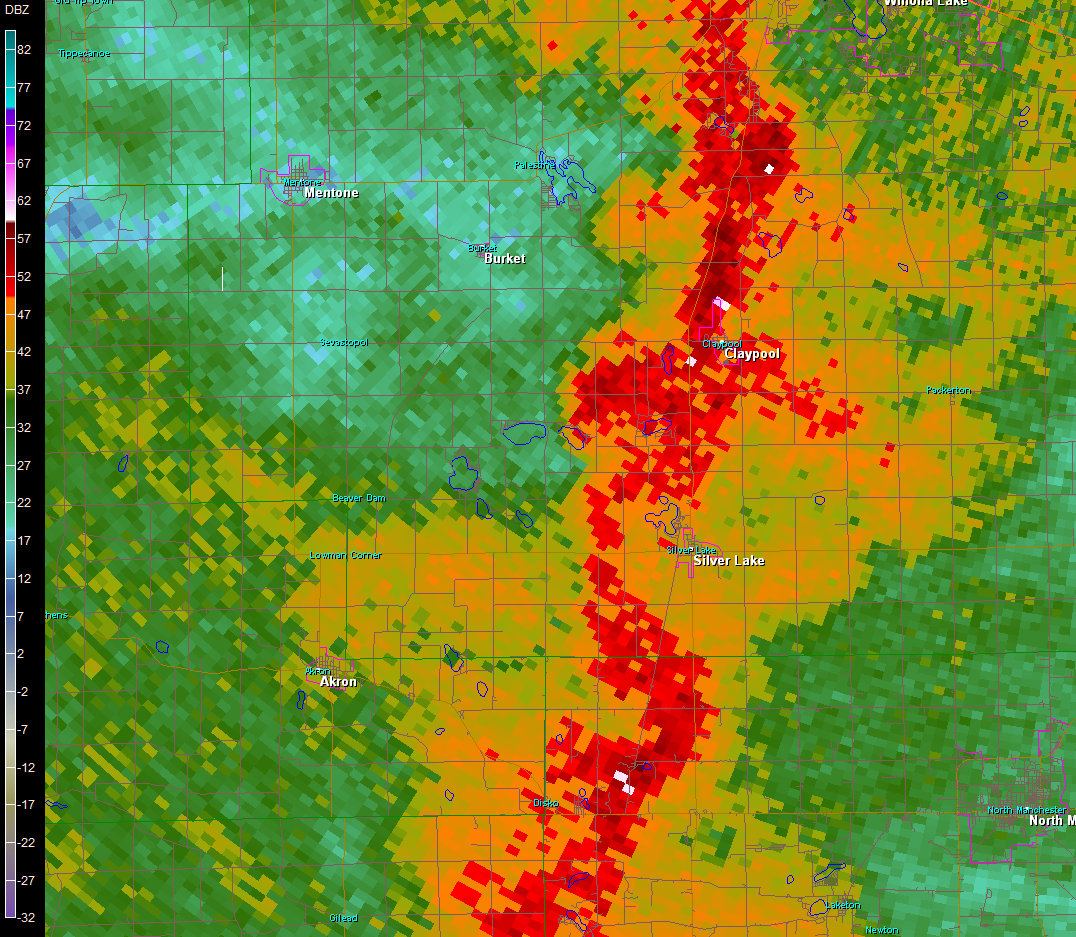
RATING: EF-2
MAXIMUM ESTIMATED WIND SPEED: 125 MPH
MAXIMUM ESTIMATED PATH WIDTH: 150 yards
PATH LENGTH: 4.17 miles
INJURIES: 2
START TIME: Estimated around 3:43 PM EST
END TIME: Estimated around 3:48 PM EST
LOCATION: 2.5 South of Silver Lake to 3 Miles East of Silver Lake
DESCRIPTION: A survey of damage in Wabash and Kosciusko counties by a NWS Survey team revealed that a tornado, which reached a maximum intensity of EF2, touched down just south of the Wabash/Kosciusko county line, west of State Route 15. The tornado crossed into Kosciusko county approximately 4 tenths of a mile east of State Route 15 and continued to the northeast over mainly open fields, occasionally causing tree damage until it hit a farm on CR 300 W approximately half a mile south of SR 14. At this location, there were 4 cattle barns completely destroyed with their contents thrown east-northeast into the field (DI:SBO DOD: 8). There were 600 cattle at the farm at the time the tornado hit and 10 of them were killed with another 10 injured. There was a two story home on this property that had part of the second story roof removed and the second story bedroom shifted as the east wall buckled outward. The debris field from this tornado continued to the NE and power poles were snapped at the base along SR 14. The tornado dissipated shortly after this as it crossed S County Farm Rd. The total path length across both counties was around 4.2 miles with a maximum estimated wind speed of 115 mph.
Radar Images
| |
 |
 |
3:42 PM EST Reflectivity (Z)
& Storm Relative Velocity (SRV) |
3:46 PM EST Reflectivity & SRV |
3:51 PM EST Reflectivity & SRV |
| |
 |
 |
Damage Pictures
Details
RATING: EF-1
PATH LENGTH: 1.7 miles
MAXIMUM ESTIMATED WIND SPEED: 95 MPH
MAXIMUM ESTIMATED PATH WIDTH: 275 yards
START TIME: Estimated around 3:48 PM EST
END TIME: Estimated around 3:50 PM EST
LOCATION: Touchdown occurred in an open field 1.6 miles south-southeast of Oswego and lifted just east of Oswego.
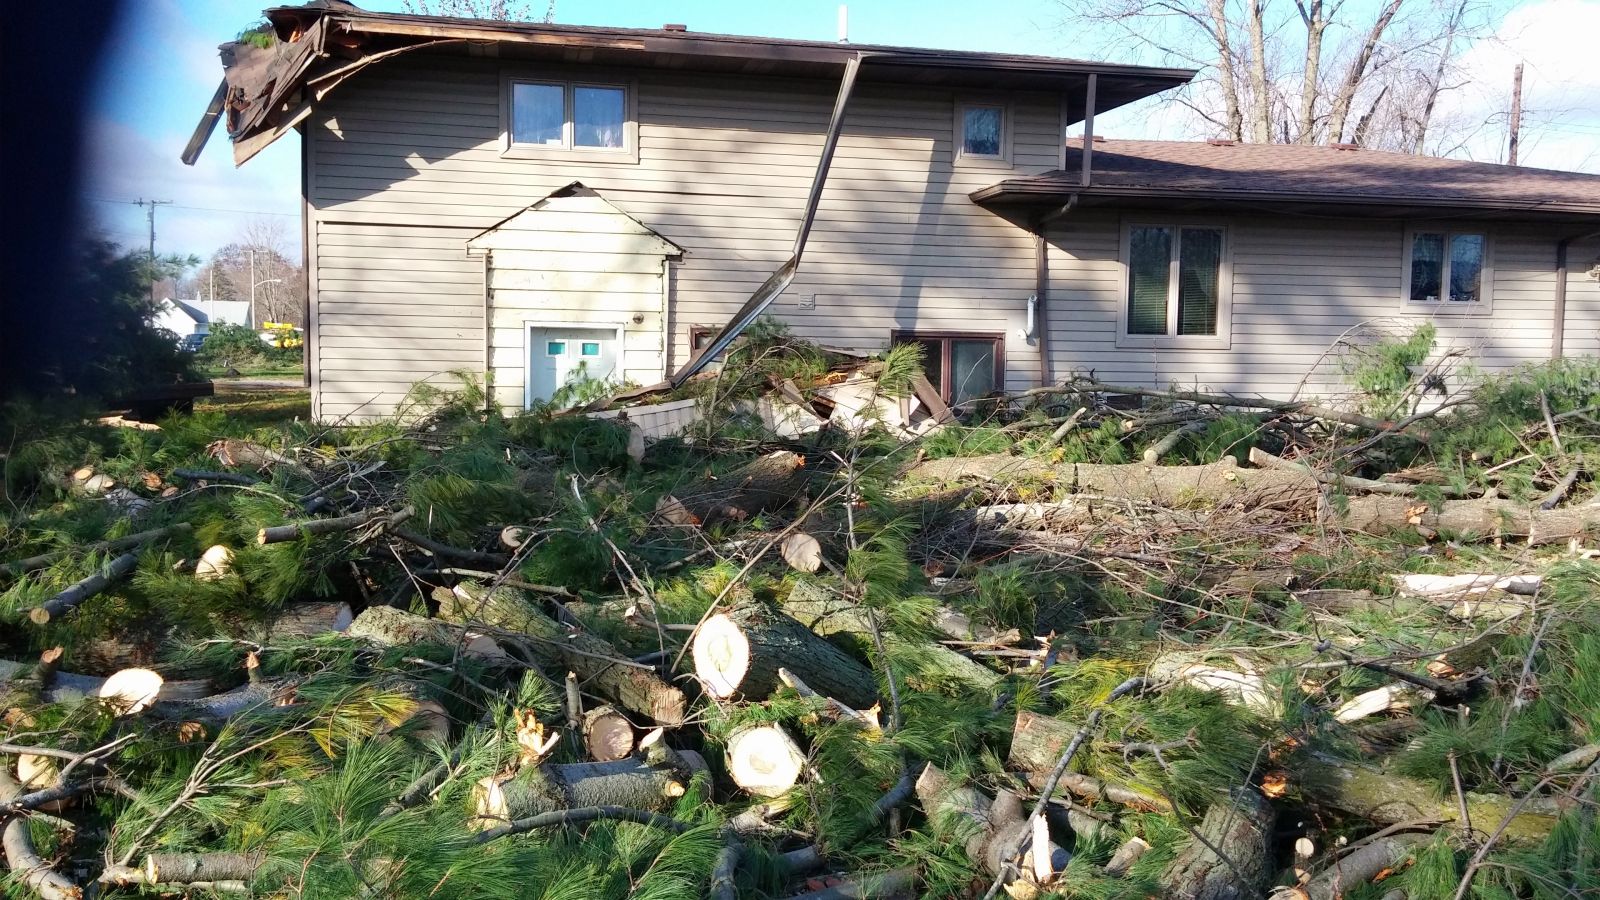
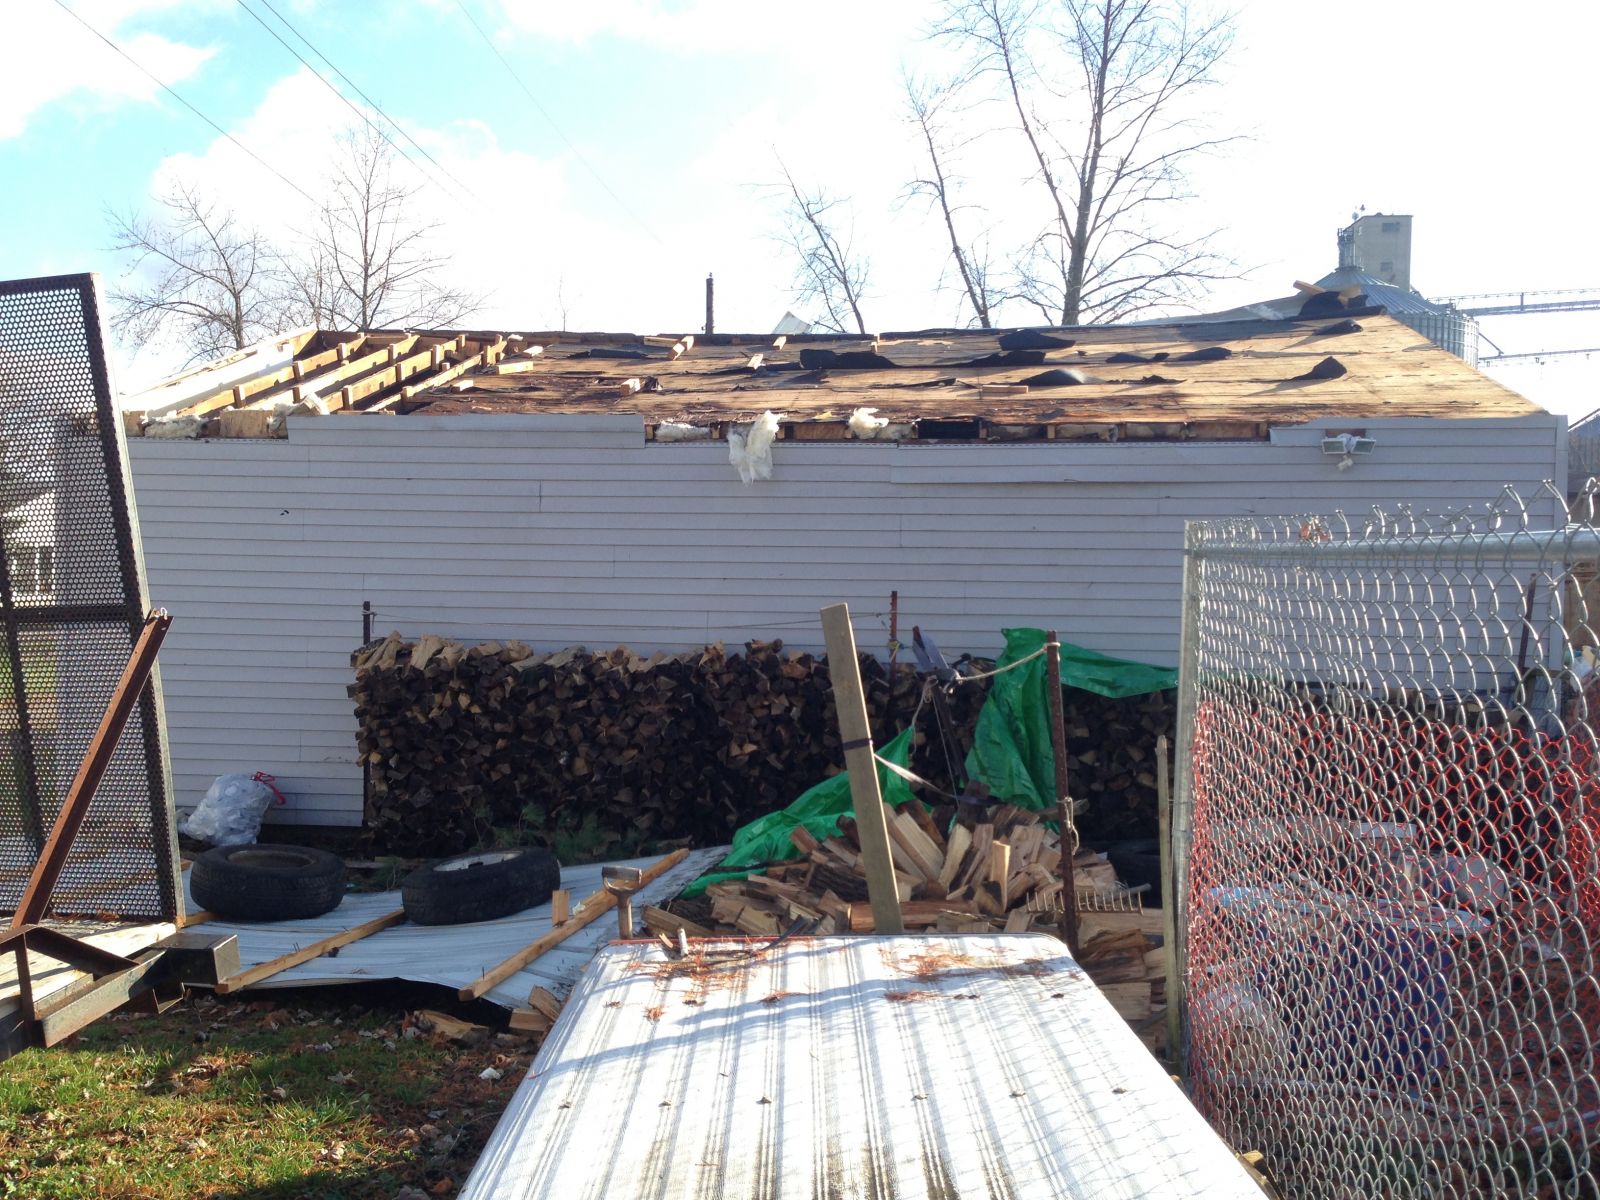
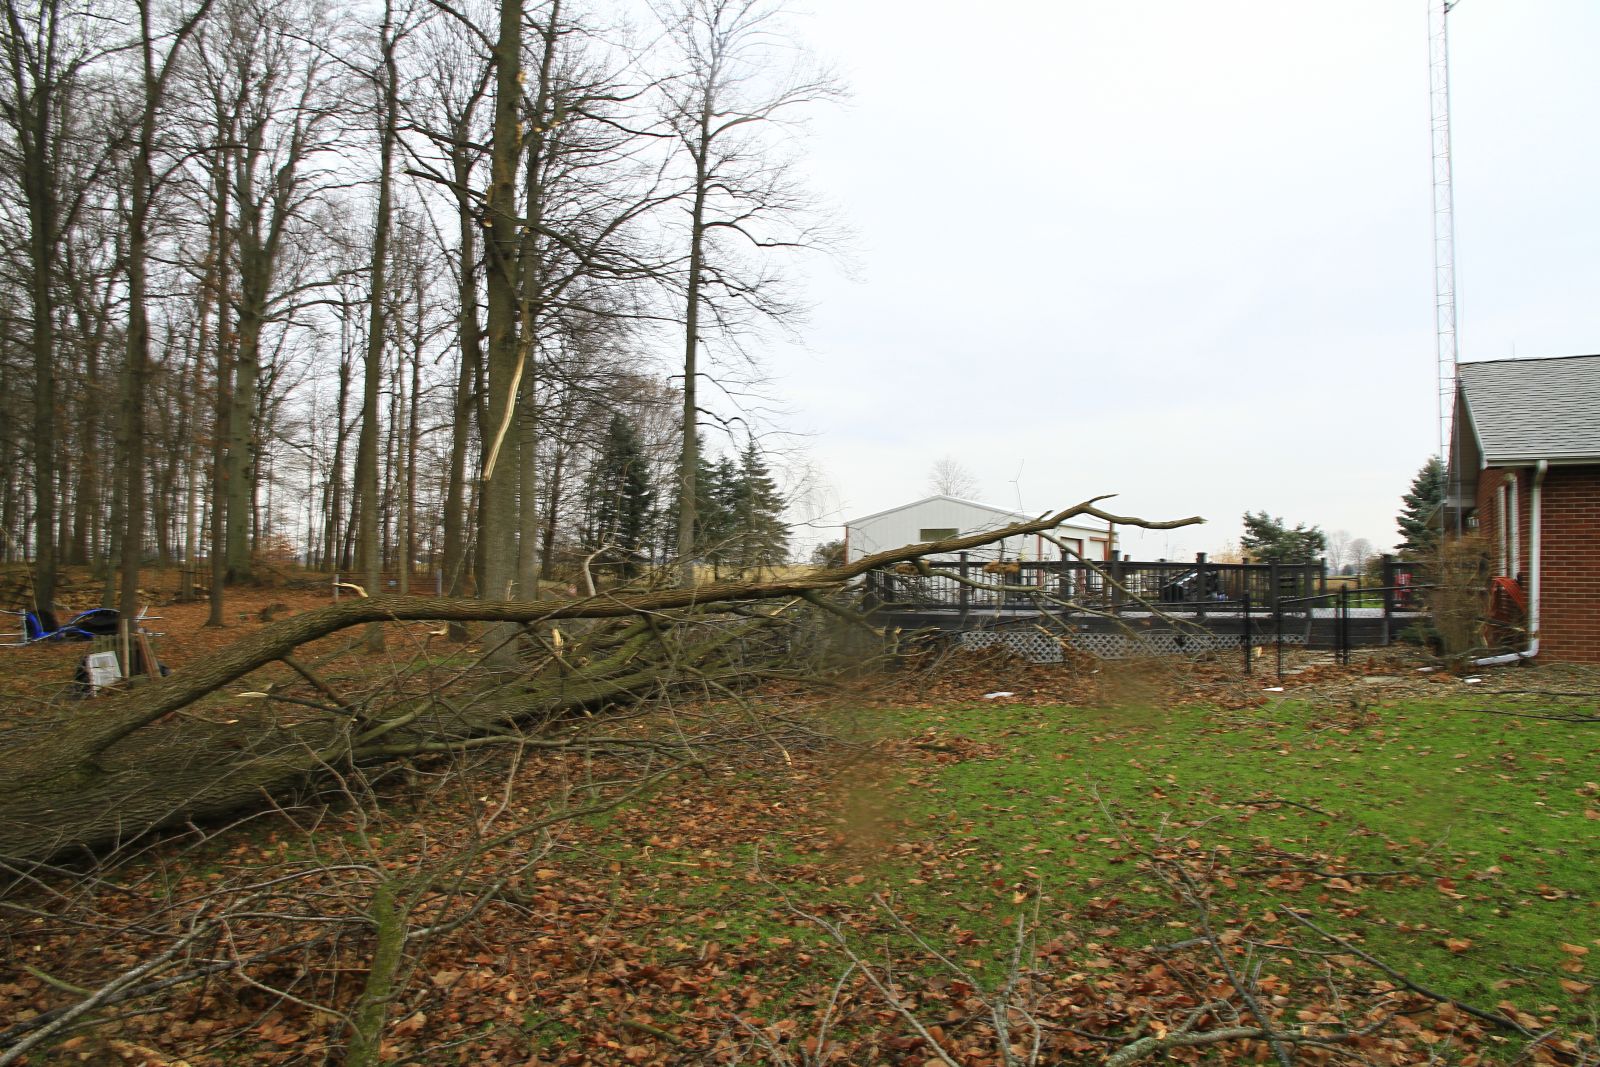
DESCRIPTION: A survey of damage southwest of Oswego by a NWS Survey team revealed that a EF1 tornado produced damage along a roughly 1.7 mile path. Touchdown occurred in a harvested field southwest of the intersection of County Roads 450 North and 250 East. Several segments of a center pivot were flipped in this area. The tornado continued northeast crossing County Road 450 North, severely damaging 7 power poles, which were either snapped or bent at more than a 45 degree angle. One pole had 3 large transformers for the center pivot on it, with these being pushed on to the roadway. The tornado then impacted the Pines subdivision, northeast of 450 North and 250 East. Two to three dozen healthy pine trees between 30 and 50 feet tall were snapped or uprooted (DI: TS DOD: 4). One house was impacted on both sides with the roof being penetrated. Two vehicles had trees fall onto them, crushing them. The tornado moved through the remainder of the subdivision and adjacent properties with varying degrees of mainly roof and tree damage. The last noted damage involved a home on County Road 300 East, just south of Rader Road where moderate roof damage occurred and a narrow path of trees snapped in an adjacent wooded area. The tornado lifted shortly after this point prior to crossing Armstrong Road. Maximum wind speeds with the tornado are estimated at 95 mph.
Radar Images
 |
 |
 |
3:42 PM EST Reflectivity (Z)
& Storm Relative Velocity (SRV) |
3:46 PM EST Reflectivity & SRV |
3:51 PM EST Reflectivity & SRV |
 |
 |
 |
Damage Pictures
Details
RATING: EF-0
PATH LENGTH: brief touchdown
MAXIMUM ESTIMATED WIND SPEED: 80 MPH
TIME: Estimated around 3:55 PM EST
LOCATION: 0.25 miles west of 300 W/300 N just south of Roseburg.
DESCRIPTION: A survey of damage in west central Grant county revealed damage consistent with a brief EF0 touchdown. The tornado touched down a quarter mile east of the intersection of County Roads 300 South and 300 West. A storage shed on the property sustained some roof damage (DI: SBO DOD: 2) with extensive tree damage also noted. The tornado quickly lifted after crossing County Road 300 South. The maximum wind speed is estimated at 80 mph.
Radar Images
 |
3:55 PM EST Reflectivity (Z)
& Storm Relative Velocity (SRV) |
 |
Damage Pictures
Details
RATING: EF-1
MAXIMUM ESTIMATED WIND SPEED: 100 MPH
MAXIMUM ESTIMATED PATH WIDTH: 150 yards
PATH LENGTH: Approx. 2 miles
START TIME: Estimated around 4:47 PM EST
END TIME: Estimated around 4:49 PM EST
LOCATION: Touchdown occurred about 0.3 miles south of Elm Sugar Road and Doner Road intersection and lifted just south of the Paulding County/Van Wert county line to the northwest of the intersection of Converse, Roselm, and Kidner roads.
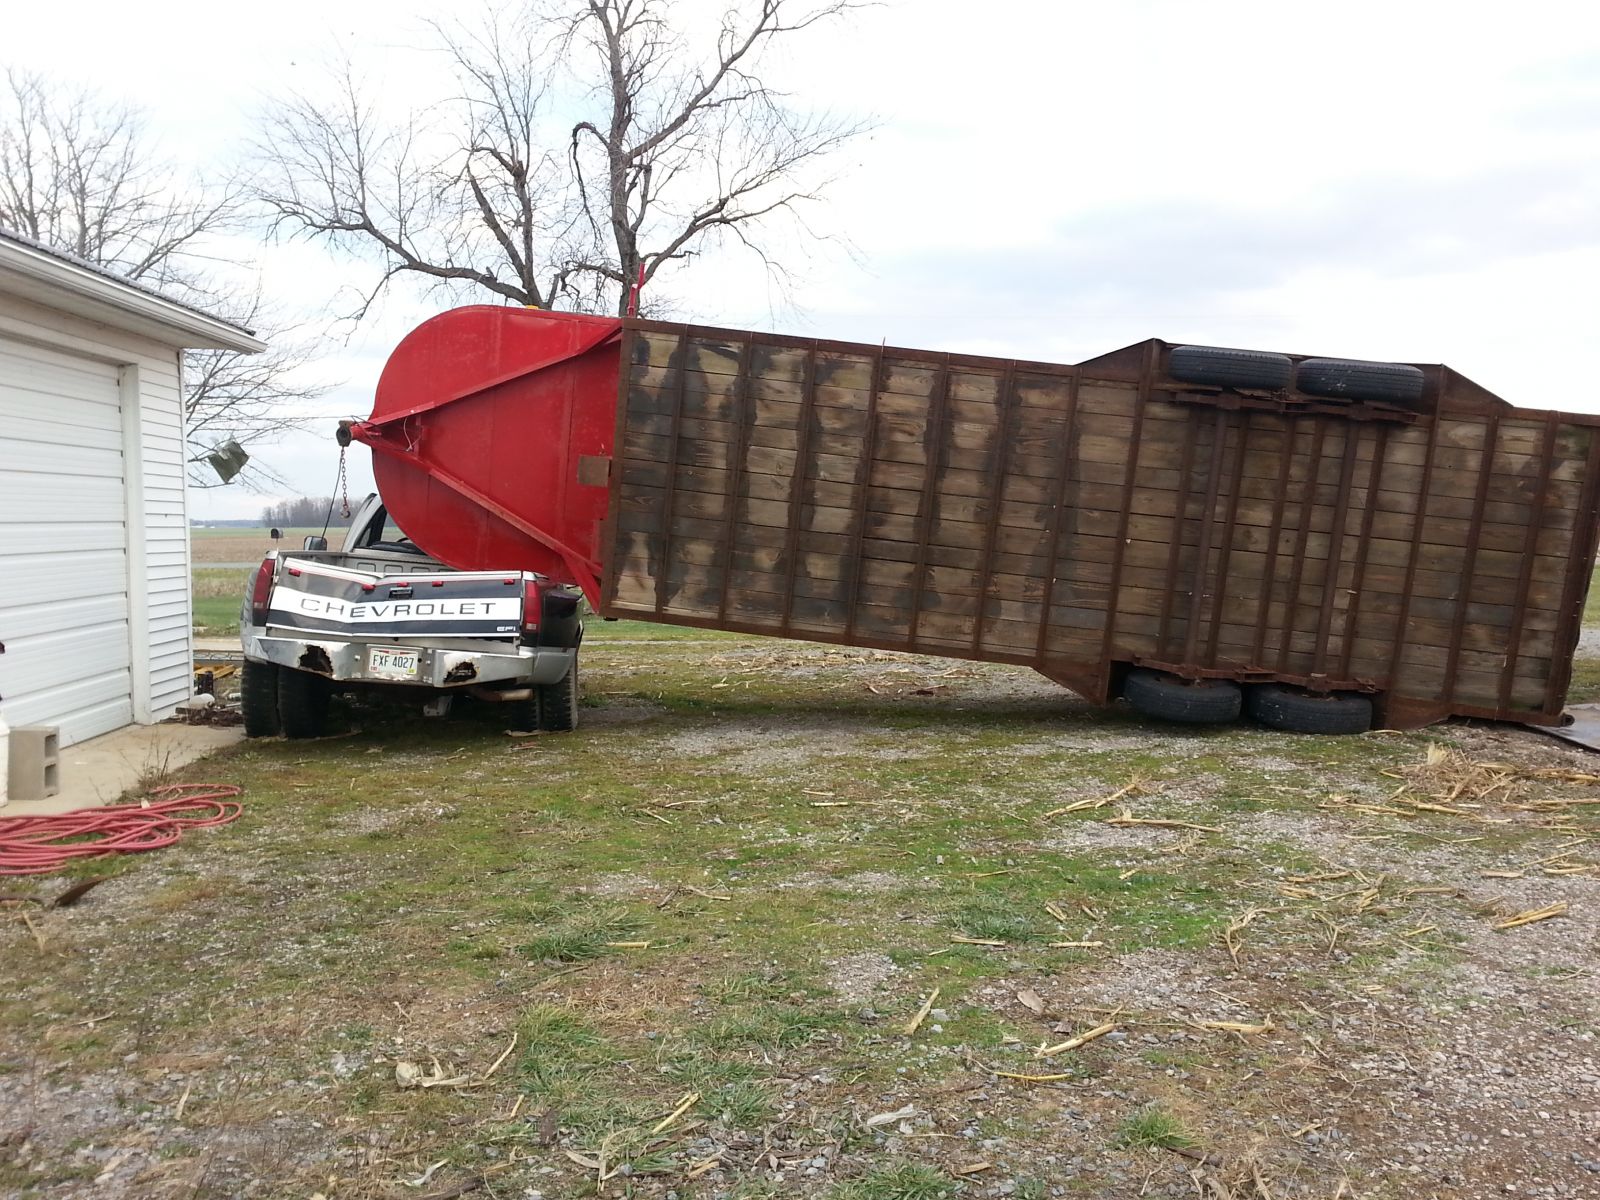
DESCRIPTION: A survey of damage in the northeastern part of Van Wert county by county emergency management officials and a NWS Survey team revealed that a EF1 tornado produced damage along a roughly two and one tenth mile long path. Touchdown occurred south of the intersection of Elm Sugar and Donner Road where several barns on two adjacent properties suffered damage. The northern most barn suffered extensive roof damage and loss of trusses (DI: SBO DOD: 4) with other barns suffering partial roof damage. The tornado continued northeast across open fields and occasional wooded areas, causing sporadic tree damage. A horse trailer was flipped over onto a truck at a residence on Middle Point Wetzel Road with a barn suffering minor roof damage. The tornado reached its end point at a business where some travel campers were flipped and some metal roofing was damaged. Maximum wind speeds with the tornado are estimated at 100 mph.
Radar Images
 |
 |
 |
4:42 PM EST Reflectivity (Z)
& Storm Relative Velocity (SRV) |
4:47 PM EST Reflectivity & SRV |
4:51 PM EST Reflectivity & SRV |
 |
 |
 |
Damage Pictures
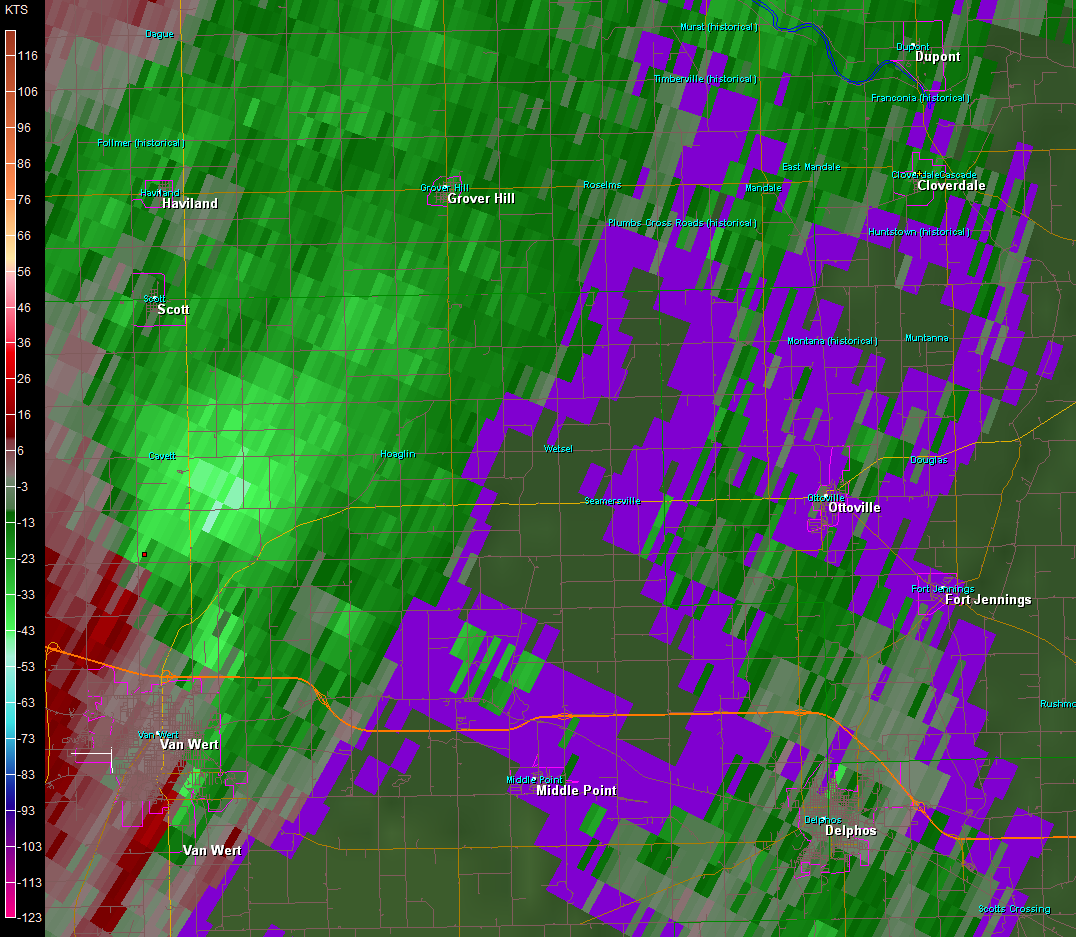
Details
RATING: EF-2
PATH LENGTH: 11.1 miles
MAXIMUM ESTIMATED WIND SPEED: 130 MPH
MAXIMUM ESTIMATED PATH WIDTH: 440 yards
START TIME: Estimated around 4:52 PM EST
END TIME: Estimated around 5:03 PM EST
LOCATION: Touchdown occurred on CR 0 west of CR 27 in Putnam County. The tornado continued northeast clipping the Paulding/Putnam County line before re-entering Putnam County and lifted about 5 miles NE of Cloverdale.
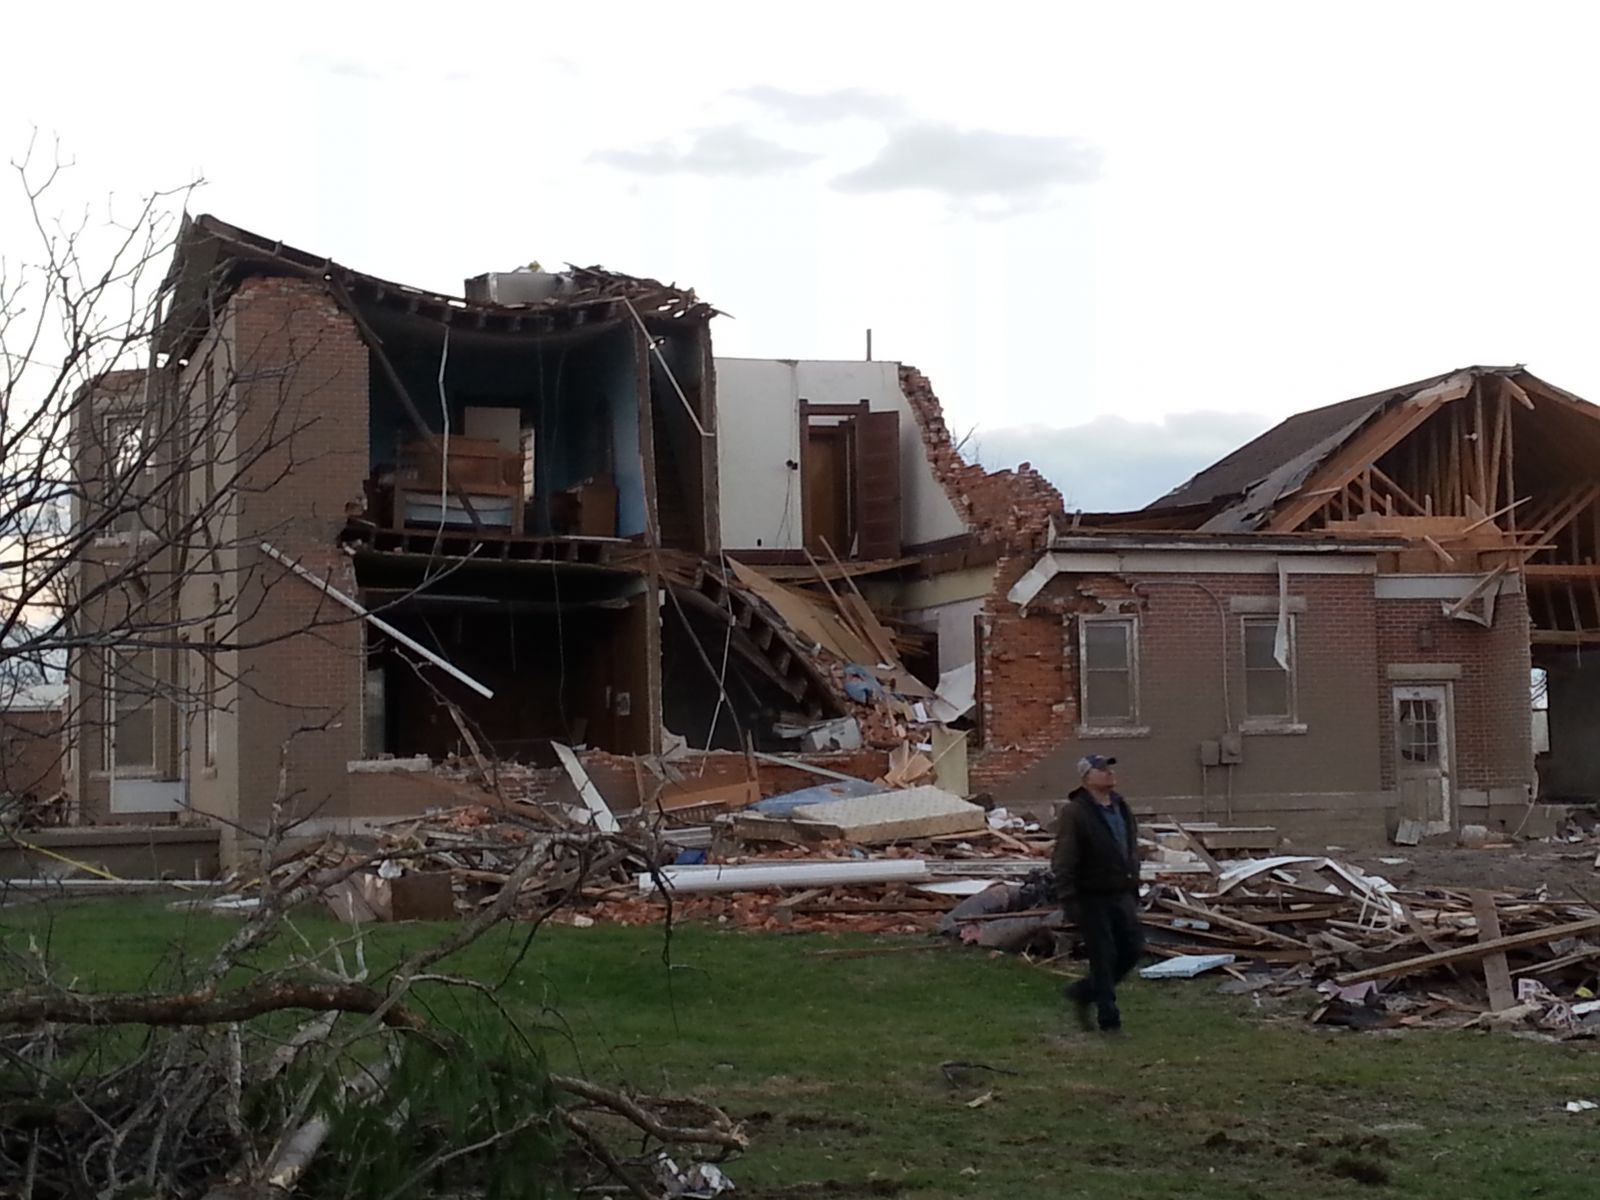
DESCRIPTION: Damage consistent with a tornado, eventually reaching EF2 intensity, was found by a NWS survey team. The tornado touched down at a residence on Township Road 0, west of County Road 27 where a barn suffered some structural damage, with several hay wagons thrown or moved. The tornado continued rapidly northeast, impacting another barn on Route 66, north of Road N. The barn suffered more extensive damage with both wood rafters and lots of roof sheeting being torn off (DI: SBO DOD: 5) and carried through a field for nearly a mile. Maximum wind speeds were likely around 95 mph as the tornado crossed the Putnam/Paulding county line near the intersection of Road 12 and Road 25m. A mobile home near the county line was impacted by the tornado, causing it to shift off its foundation with minor siding damage (DI: MHSW, DOD: 3). A barn also suffered some minor siding damage. The tornado crossed back into Putnam county and continued to move rapidly northeast over mainly open fields until entering the town of Cloverdale where EF2 damage was observed. Extensive tree damage as well as minor to moderate structural damage was noted across the town, with several power poles down. The greatest damage occurred to a church and a brick home. Both suffered extensive damages to some of the walls and the roof (DI: FR12 DOD: 7). A nearby home lost one of its walls (DI:FR12, DOD2) with adjacent hardwood trees suffering greater damage (DI: TH DOD: 4). The tornado exited town and continued northeast for several more miles over open fields and occasional wooded areas with sporadic tree damage noted until finally lifting five miles northeast of Cloverdale. Maximum winds are estimated at 130 mph with a total two county path length of around 11 miles.
Radar Images
| |
|
 |
4:47 PM EST Reflectivity (Z)
& Storm Relative Velocity (SRV) |
4:51 PM EST Reflectivity & SRV |
4:59 PM EST Reflectivity & SRV |
| |
|
 |
Damage Pictures
Storm Reports
Below is a map of the storm reports we received during the event. The red 'T' shows preliminary tornado reports, but not necessarily a confirmed tornado. Multiple reports were received for a single tornado path.

To see a detailed list of every storm report, please click here to view a PDF.
Precipitation Totals

Radar Loops
Click on the images below to enlarge (could take a few minutes to load)
The map below shows a plot of rotation tracks based off of NWS Doppler Radar.

Outlooks and Warnings
| Storm Prediction Center Day 1 Outlook Issued Sunday Morning |
 |
|
Storm Prediction Days 2-4 Outlooks
|
|
Issued Thursday (Nov 14th) for Sunday
|
Issued Friday (Nov 15th) for Sunday
|
Issued Saturday (Nov 16th) for Sunday
|
 |
 |
 |
| NWS Warnings Issued on November 17, 2013 |
| National |
Local (NWS IWX) |
 |
 |
The animated loop below shows regional warnings overlayed on the radar reflectivity.

What Caused This Outbreak?
A strong low pressure system moved through the region on November 17, 2013. Storms began to fire in central Illinois ahead of a strong cold front during the early afternoon hours and quickly reached severe limits. Initially, the storms fired as distinct supercells moving at forward speeds of 50-60 mph! Eventually, the supercells merged into a squall line that raced across Indiana and into Ohio during the late afternoon to early evening hours.
The setup was ideal for severe weather, not to mention a widespread outbreak with multiple tornadoes. To sustain themselves and become severe, thunderstorms need heat and moisture (which creates instability), wind shear (strong winds that change direction with height), and forcing (such as a cold front). Environments necessary for thundstorms are typically found in the Midwest from late spring through summer, but a secondary peak in severe weather does occur in the fall. For this particular event, there was enough instability and strong wind shear present ahead of a strong cold front to produce thunderstorms that quickly became severe. These parameters were extremely high for any time of the year, especially the fall, so long-lived and significant tornadoes occurred across the region.
The images and descriptions below gave a depiction of the mesoscale atmospheric conditions present at 3 pm EST (20Z) on Sunday, November 17, 2013.
 |
 |
 |
| Surface analysis (21Z) shows a cold front entering the area from the west with a low pressure center across northern Michigan. Surface dew points ahead of the front were in the 60s providing moisture to fuel the thunderstorms. |
850 mb analysis shows a low-level jet (~50-65 kts) pumping warm, moist air into the area ahead of a low pressure center. This helped to fuel and sustain thunderstorms as they developed in central IL and moved into the local area. |
500 mb analysis shows a mid-level trough of low pressure just to the west of the local area. This, coupled with a mid-level jet stream rounding the base of the trough, provided forcing for the thunderstorms to fire to the west before moving into the local area. |
 |
 |
 |
| Effective Bulk Shear: A measure of the difference between winds at the surface and aloft in the atmosphere. Supercells become more probably as the effect bulk shear vector increases in magnitude through the range of 25-40 kt and greater. Values across the local area were in the 60-70 kt range, which is quite impressive! |
0 - 1 KM Storm Relative Helicity (SRH): SRH is a measure of the potential for rotating supercells. Values of 0-1km SRH greater than 100 m2/s2 suggest increased threat of tornadoes with supercells. Values across the local area were in the 400-600 m2/s2 range with storm motion of 50-55 kts! |
Significant Tornado Parameter (STP) : The STP is a multi-ingredient index that is calculated to determine the potentital for significant (EF2+) tornadoes. A majority of sig. tornadoes have been associated with values greater than 1. STP values across the local area were 1-2. |
Updated 03/18/2014 11am
LWF/KG/NG/CEO


.jpeg)


.jpg)
.jpg)
.jpg)