Assessment of Flood Wave Predictability Along the Arkansas River in South-Central Kansas
Andrew Shook and Kenneth R. Cook
National Weather Service, Wichita Kansas
August 06, 2007
1.0 Introduction
During the summer of 2007, several significant rainfall events occurred across the are that the National Weather Service (NWS) Office in Wichita Kansas serves. This resulted in numerous flooding events along the Arkansas River including record flooding at the Arkansas River at Haven.
Since the scope and predictability of record flooding is difficult at best, these flooding events prompted a study to determine whether or not the forecast crest and/or timing of the crest could be accurately predicted using a liner regression technique.
2.0 Methodology
The project's aim was to identify a correlation between crests at the various forecast points along the Arkansas River between Hutchinson and Arkansas City. The Arkansas River was chosen as it is the largest watershed in the National Weather Service Wichita's Hydrologic Service Area (HSA). The project utilized the six forecast points: Hutchinson (HCHK1); Haven (HAVK1); Derby (DRBK1); Mulvane (MULK1); Oxford (OXFK1); and Arkansas City (ARCK1).
Data from the hydrodatabase's "Crest History" table were used to compile a stations history of flood crests. These data were narrowed to accommodate a site by site comparison in order to determine if a correlation between sites was attainable. In other words, the sites were paired to gain the best fit of the data between sites with the best chance of having a significant number of pairs. Other pairs were also considered where appropriate and will be discussed below.
3.0 Analysis and Results
Upon narrowing the data to fit the station neighboring pairs, it was found that many of the forecast points, especially as you traveled upstream, did not contain enough like cases. For example, the Mulvane site only contained a total of 3 crests recorded, making analysis useless for this specific site. Other incomplete data issues were encountered as well. Often, when a data pair was found, at least one of the two crests was lacking a maximum crest and/or a crest time. If the pair was lacking a maximum crest, it could not be analyzed with linear regression, and was therefore dropped. If the crest time was missing, it was assigned a maximum allowable time given by the dates of the crests. The result here was the time frame had an upper limit for the arrival of the crest, though this would undoubtedly result in an overestimation of said time.
Once the complete assessment and stratification procedures were complete, only a few site pairs contained enough data to warrant analysis. Due to the fact that there were so few useful neighbor pairs, non-neighbor pairs were considered. After considering all possible pairings, the Haven-Derby, Derby-Arkansas City, and Haven-Arkansas City pairs were selected for analysis.
| The Haven-Derby analysis contained 9 crest pairs with complete maximum crests data. Linear regression gave the equation: y = 0.8107x + 22606 with a coefficient of determination at 0.2007. This shows that the regression equation has a substantial amount of intrinsic error and should not be relied on heavily for any forecasting without refining the equation. It is also possible that the error is a result of the two sites being on opposite sides of the Wichita metro area and its flood control operations. This could make it difficult to improve the coefficient of determination and the equation's usefulness. When considering the time each crest took to propagate, almost none of the data was complete. Based on the dates, however, the (approximate) maximum amount of time a crest will take to travel from Haven to Derby is 38 hours. |  |
| The Derby-Arkansas City analysis contained 19 crest pairs giving the regression equation: y = 1.0404x + 7815.2 with a coefficient of determination of 0.6864. This is a much more significant correlation and much of the best-fit line's error comes from just a couple of points. While the addition of crest data is encouraged in the future, this equation is the most usable of the three considered. This pairing had the most successful collection of time data as well. When using all the time data points, estimated and accurate, the maximum amount of time a crest would take to travel from Derby to Arkansas City would be 30.38 hours. If only data pairs containing observed crest times were used, or 17 of 23 data points, the approximate time for a crest to propagate between the two would be 26.37 hours. | 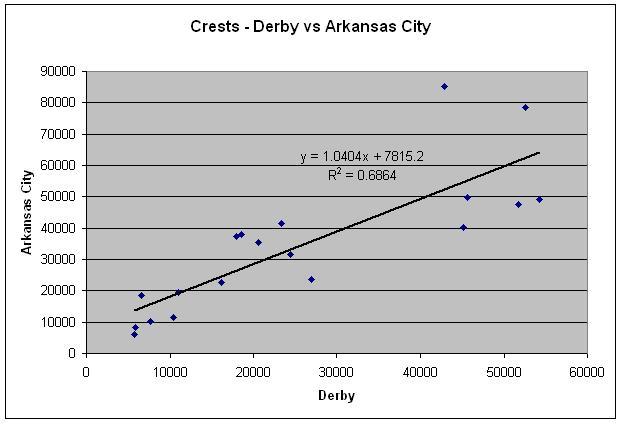 |
The Haven-Arkansas City analysis had 11 crest pairs. However, the coefficient of determination was 0.0121, meaning there is almost no relationship between the two sites. The distance is likely a factor as well as the Wichita metro area. Because this pair is not useful, the average time of travel was not calculated.
Because the time data was hard to come by, the other pairings all represent an approximate maximum time required. From Hutchinson to Haven, the maximum average time was 21.85 hours. For Derby to Oxford, it was 17.17 hours. And for Oxford to Arkansas City, it was 13.77 hours.
|
Time Crest Propagation Approximation
|
|
| Hutchinson (HCHK1) to Haven (HAVK1) | 21.85 hours |
| Haven (HAVK1) to Derby (DRBK1) | 38.0 |
| Derby (DRBK1) to Oxford (OXFK1) | 17.17 |
| Derby (DRBK1) to Arkansas City (ARCK1) | 26.37 |
| Oxford (OXFK1) to Arkansas City (ARCK1) | 13.77 |
| * Maximum time. All others are average time. | |
4.0 Conclusions
Predictability of a flood wave moving downstream along the Arkansas River was considered for the NWS Wichita's HSA. This included both the height and lag time of the crest from forecast point to forecast point. It was determined that only one site pair contained a level of predictability that would warrant attention, the Derby to Arkansas City pair.
It is likely that a river this size is still too small to make an assessment such as this until you reach a river size or perhaps baseflow (which should theoretically characterize the size and behavior of a river) such as the Arkansas River at Arkansas City. Further deduction of this hypothesis is verified by the level of influence a tributary along points north of Arkansas City may have on the overall state and character of the Arkansas River given its relative size to those tributaries as compared to larger river systems such as the Mississippi River and its associated tributaries and their influence.
Time predictability should be considered separately given that surface roughness and river physical characteristics remain relatively the same for each event. Therefore, some level of confidence should be given to the statistical averages given for the crest lag times. Although the authors fully acknowledge that influences of tributary contributions will affect these times.

