Annual 2020 Climate Summary and Highlights
|
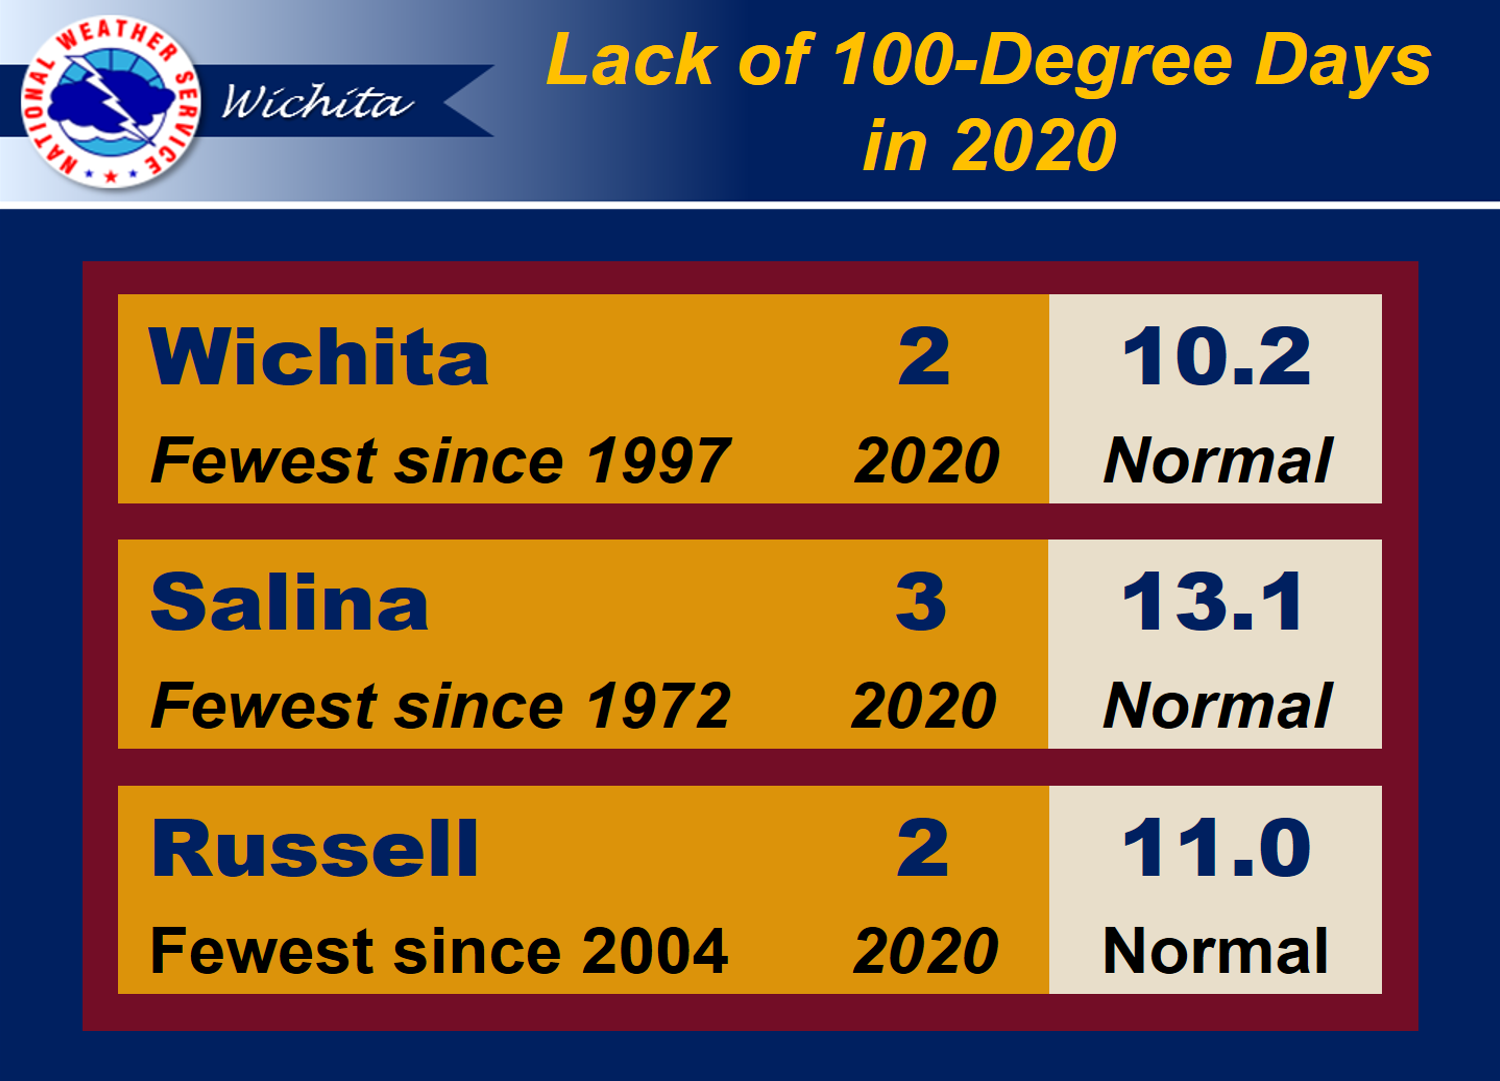
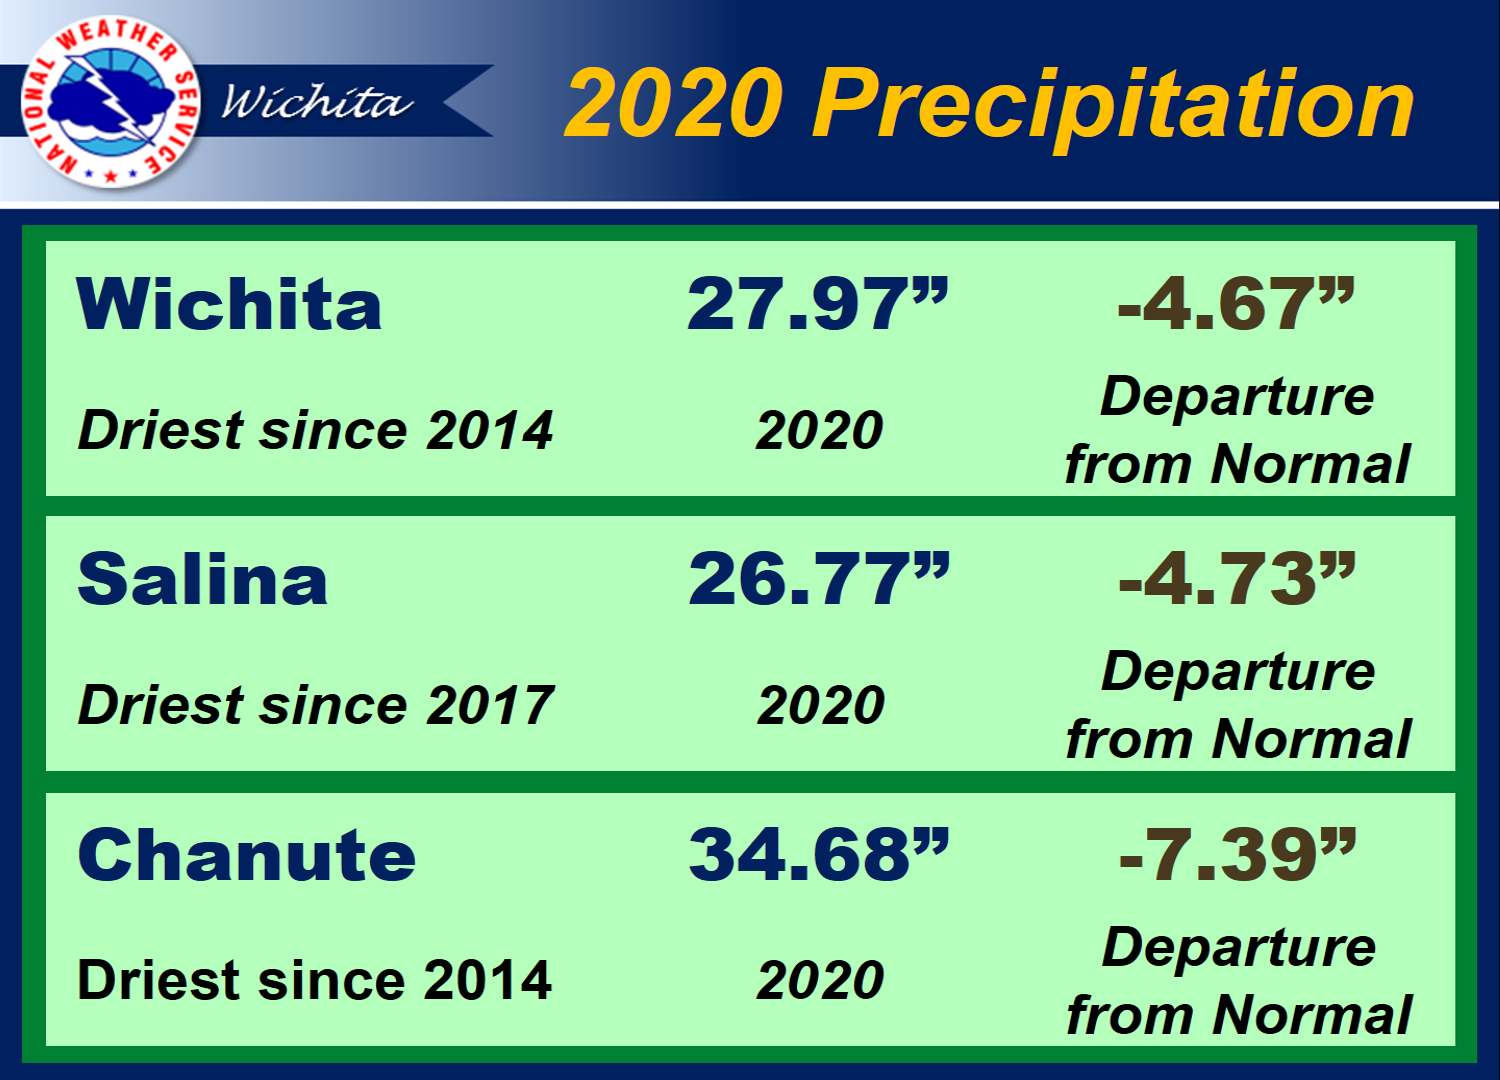
Wichita The average annual temperature of 58.1 degrees was 1.1 degrees warmer than normal. It tied for the 24th warmest year since records began in 1888, and was the warmest since 2017. The warmest temperature recorded at Eisenhower airport was 100 degrees on both June 30th and august 9th. The coldest temperature was 9 degrees on February 13th. Only 2 days reached or exceeded 100 degrees, which was 8 days below normal, and the fewest since 1997. Precipitation-wise, 27.97 inches fell, which was 4.67 inches drier than normal. It was the 46th driest year on record, and the driest since 2014. The highest daily precipitation was 1.73 inches on May 11th. Furthermore, 10.7 inches of snow fell in 2020, which was 4.2 inches below normal. The highest daily snowfall was 2.1 inches on February 12th. Despite the below normal snowfall, it was the snowiest year since 2015. Salina The average annual temperature of 56.5 degrees was 0.4 degrees warmer than normal. It tied for the 42nd warmest year since records began in 1900, and was the warmest since 2017. The warmest temperature recorded at the airport was 100 degrees on June 30th, august 28th, and September 6th. The coldest temperature was 2 degrees on February 14th. Only 3 days reached or exceeded 100 degrees, which was 10 days below normal, and the fewest since 1972. Precipitation-wise, 26.77 inches fell, which was 4.73 inches drier than normal. It was the 54th driest year on record, and the driest since 2017. The highest daily precipitation was 2.38 inches on July 30th. Chanute The average annual temperature of 58.9 degrees was 2.0 degrees warmer than normal. It tied for the 18th warmest year since records began in 1898, and was the warmest since 2017. The warmest temperature recorded at the airport was 100 degrees on August 28th, and the coldest was 9 degrees on February 13th. One day reached or exceeded 100 degrees, which was 2 to 3 days below normal, but the most since 2017. Precipitation-wise, 34.68 inches fell, which was 7.39 inches drier than normal. It was the 42nd driest year on record, and the driest since 2014. The highest daily precipitation was 1.46 inches on January 10th.
Annual 2020 Climate Reports |
Annual 2020 Temperatures
| 2020 Average Temperatures | 2020 Temperature Departure from Normal |
 |
 |
| Kansas annual 2020 average temperatures (the average of each monthly temperature). | Kansas annual 2020 average temperature departure from normal, compared to the 1951-2020 period. |
| 2020 Warmest Temperatures | 2020 Coldest Temperatures |
 |
 |
| The warmest temperatures recorded during 2020 across Kansas were in the 90s and 100s. | The coldest temperatures recorded during 2020 across Kansas were mostly in the single digits, with pockets of sub-zero readings noted. |
| 100-Degree Days in 2020 | 2020 Temperature Rankings |
 |
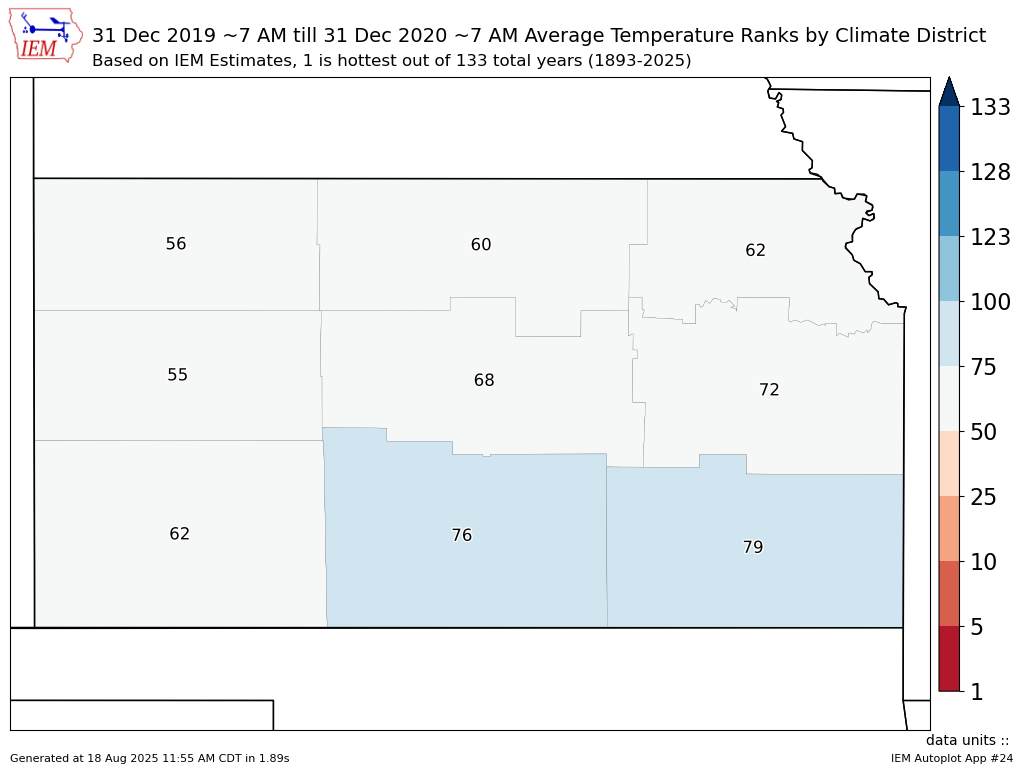 |
| Extreme heat by Kansas standards was hard to come by in 2020, with well below normal 100-degree days. In fact, Salina saw the fewest number of 100-degree days in nearly 50 years. | Kansas 2020 temperature rankings by division. One denotes the warmest year on record (since 1893), 129 denotes the coolest. Portions of western Kansas were slightly warmer than the long-term normal, while portions of south-central and southeast Kansas were slightly cooler than normal. |
Annual 2020 Precipitation
| 2020 Kansas Precipitation | 2020 Precipitation Departure from Normal |
 |
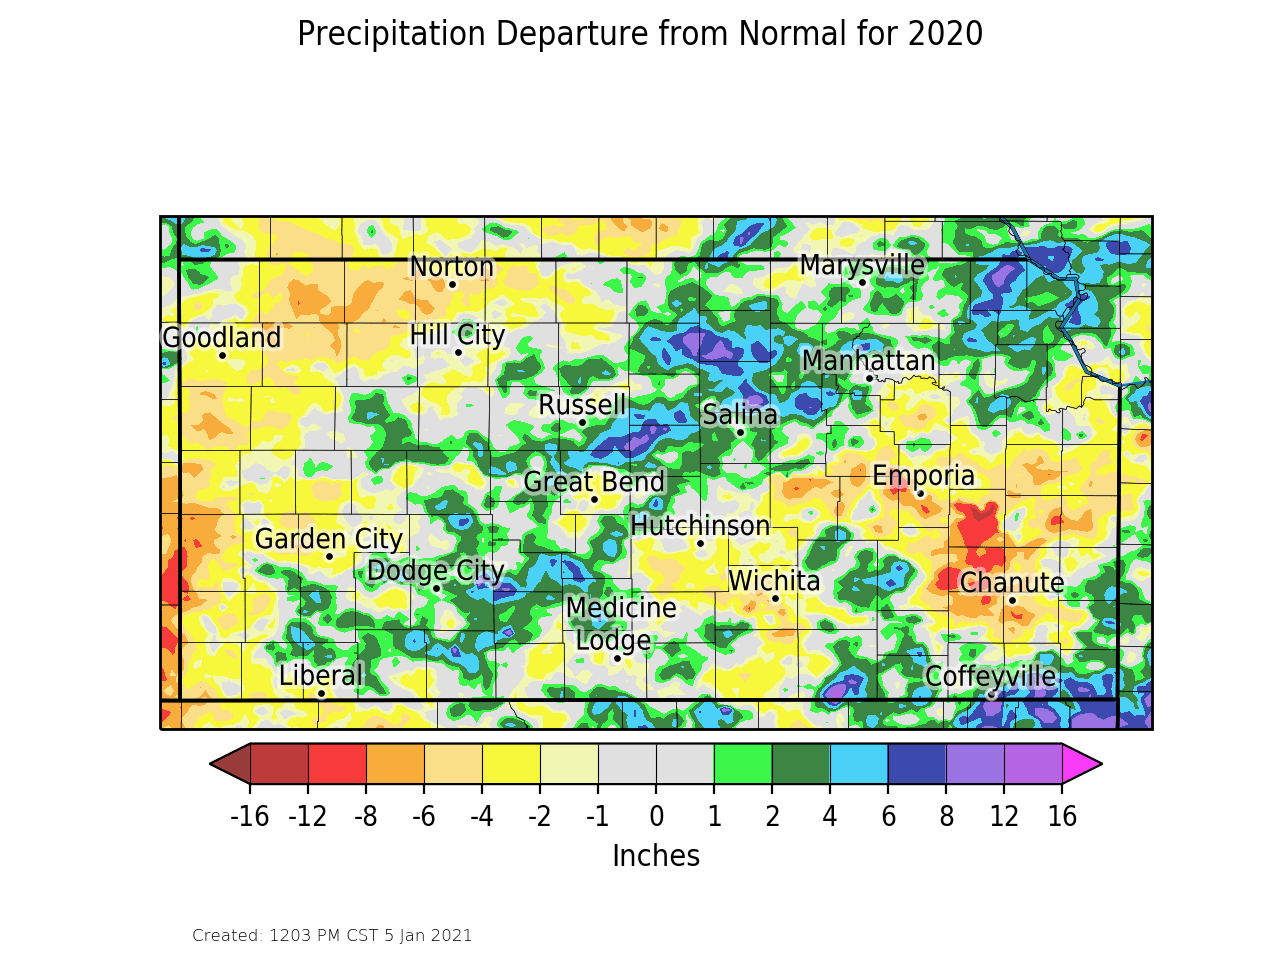 |
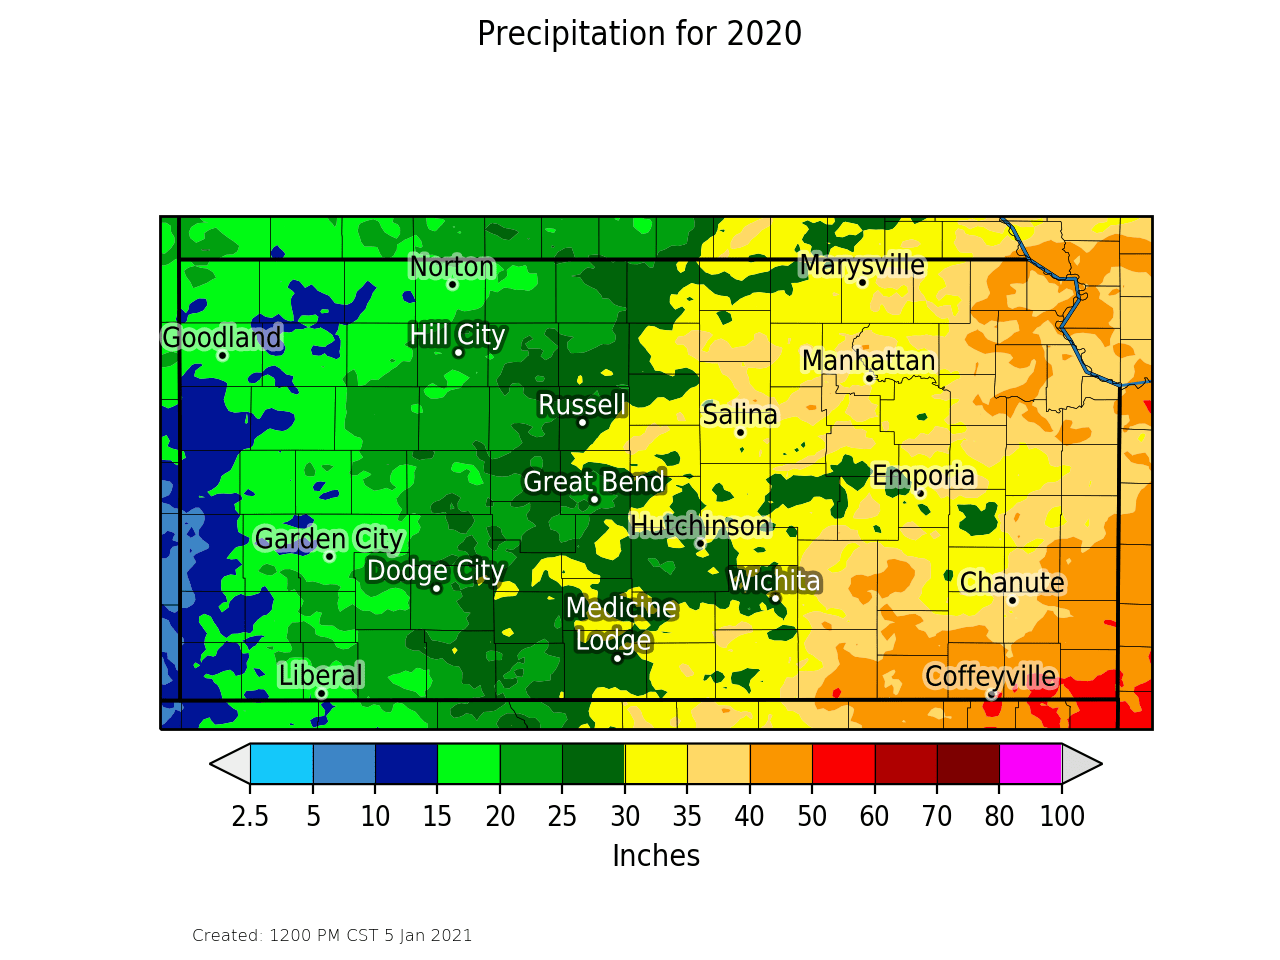
| Kansas annual 2020 observed precipitation. | Kansas annual 2020 precipitation departure from normal. |
| 2020 Kansas Snowfall | 2020 Snowfall Departure from Normal |
 |
 |
| Kansas 2020 observed snowfall. Generally the western half of the state saw the most snow accumulation. | Kansas 2020 snowfall departure from normal. Most of the state saw below normal snowfall, with pockets of near to above normal snowfall across south-central and southwest Kansas. |
| 2020 Precipitation Departures | 2020 Precipitation Rankings |
 |
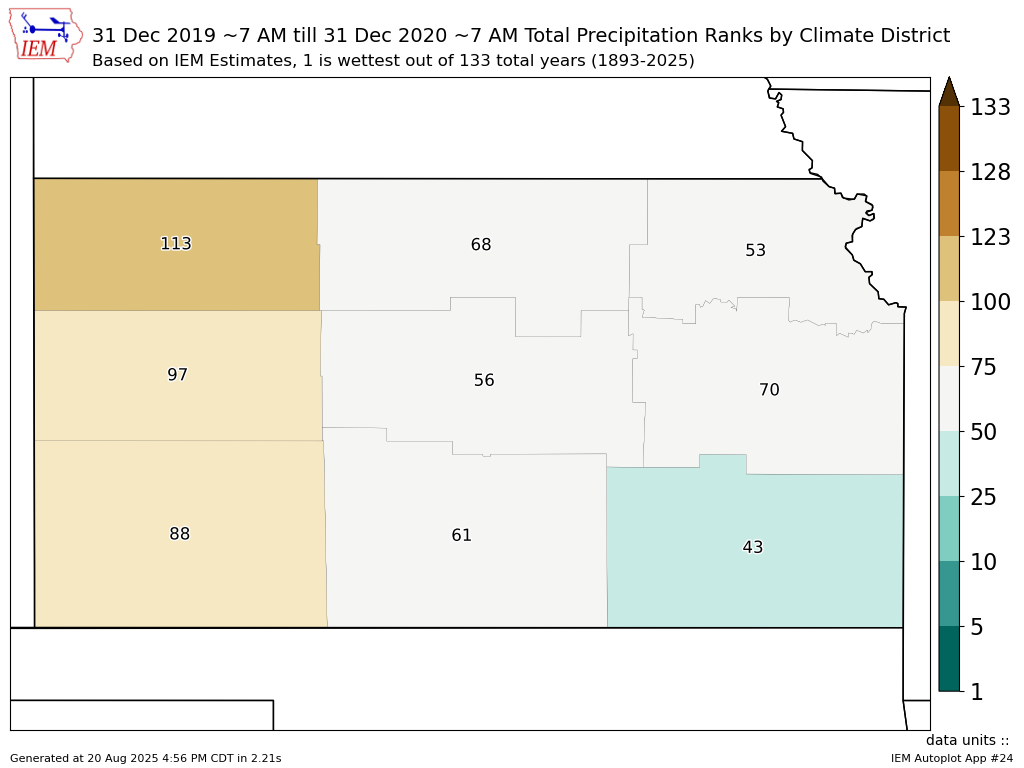 |
| 2020 was the driest year for some in 6 years. | Kansas annual 2020 precipitation rankings by division. One denotes the wettest year on record (since 1893), 129 denotes the driest. |
Miscellaneous Climate Information
| 2020 Tornado Warnings | 2020 Severe Thunderstorm Warnings |
 |
 |
| The map above shows the number of Tornado Warnings issued in the state during 2020. Note the significant lack of warnings in what was a very quiet tornado year. | The above map shows the number of Severe Thunderstorm warnings issued in 2020. The severe weather during 2020 was primarily focused across western and northern Kansas. |
| 2020 Flash Flood Warnings | 2020 Blizzard Warnings |
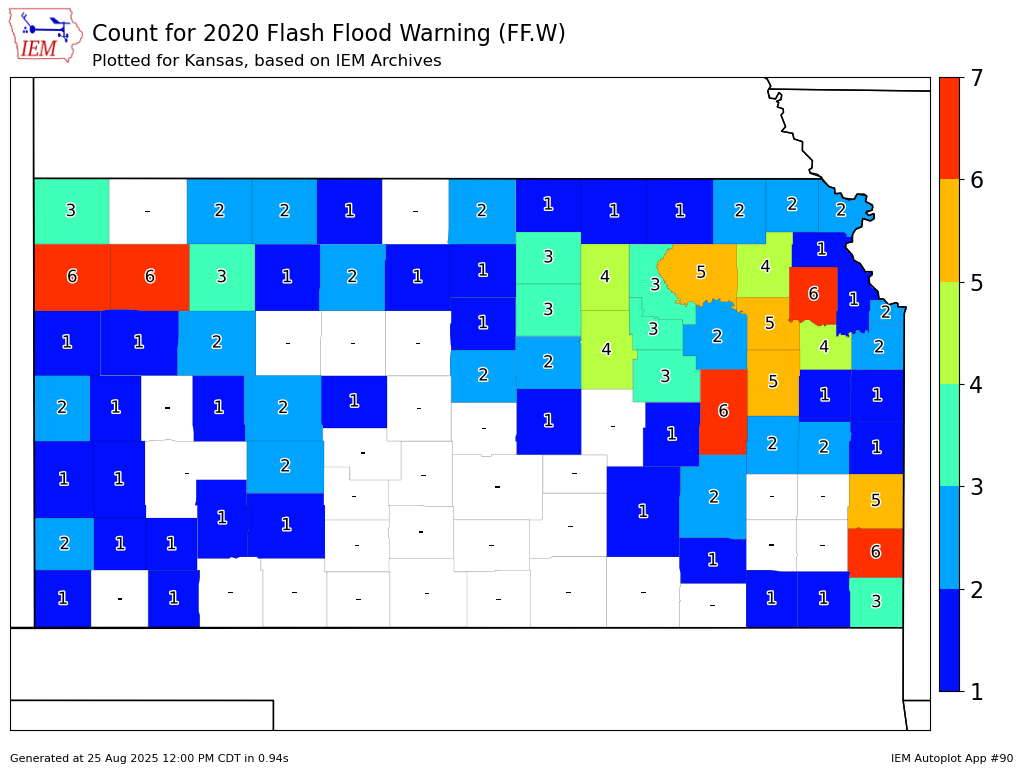 |
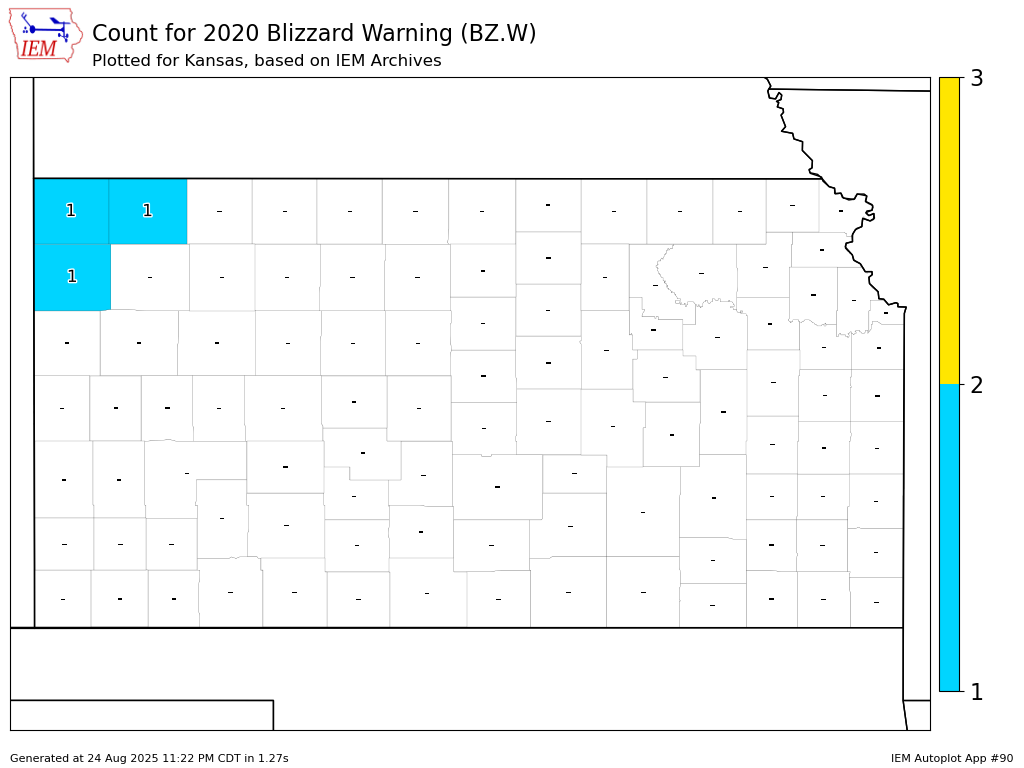 |
| The map above shows the number of Flash Flood Warnings issued in the state during 2020. Flash flooding was focused over western and eastern Kansas, with central Kansas seeing less. | The above map shows the number of Blizzard Warnings issued in the state during 2020. While several winter storms hit the state, blizzard conditions were less common this year. |
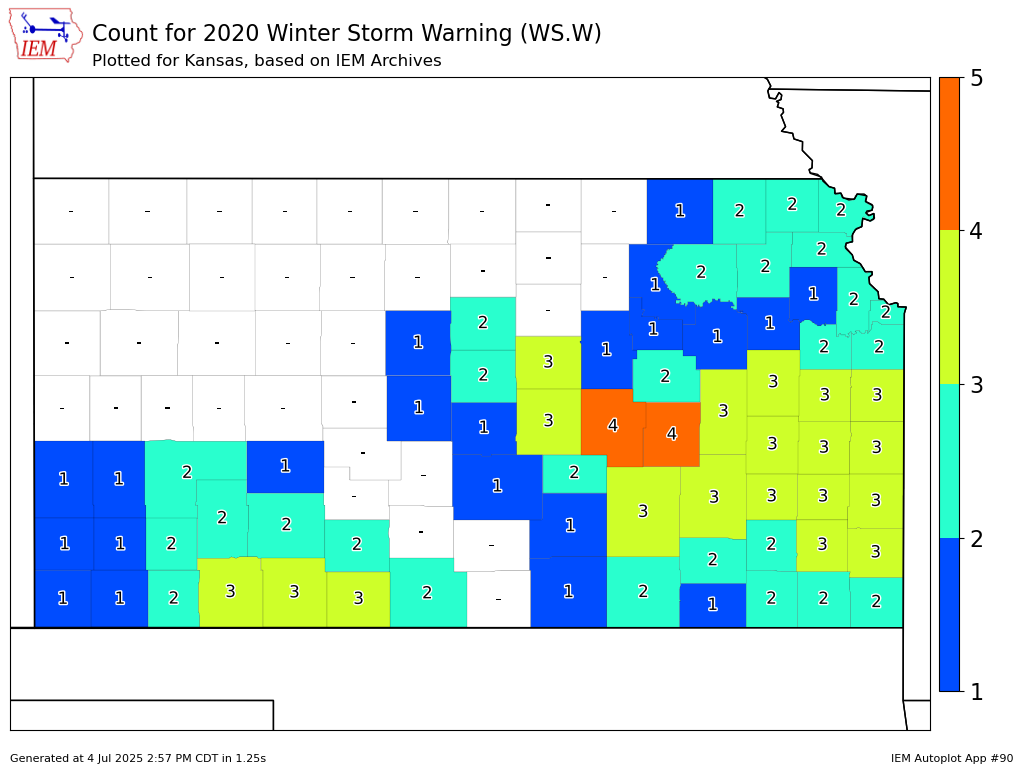
| 2020 Winter Storm Warnings | 2020 Winter Weather Advisories |
 |
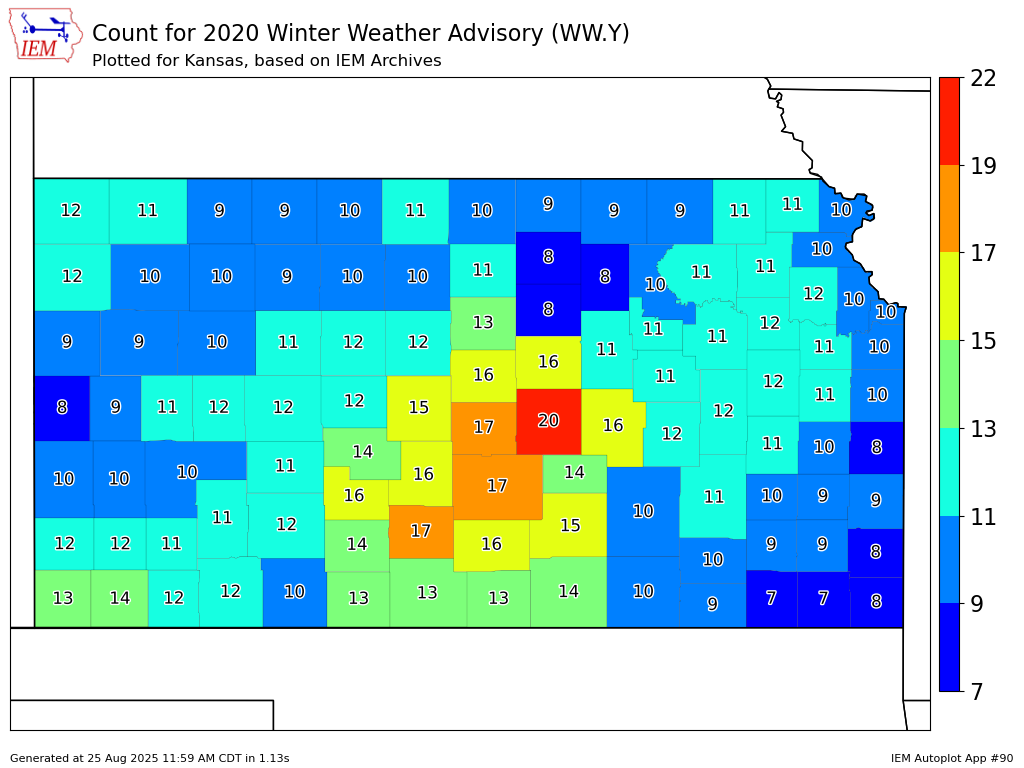 |
| The map above shows the number of Winter Storm Warnings issued in the state during 2020. | The above map shows the number of Winter Weather Advisories issued in the state during 2020. |
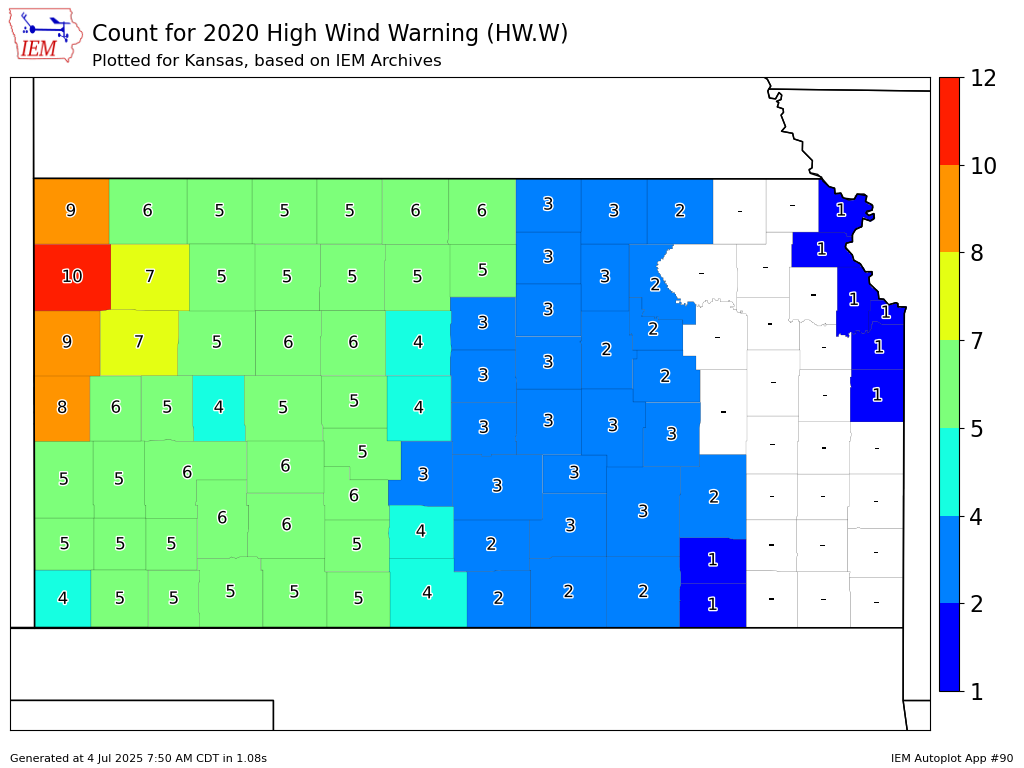
| 2020 High Wind Warnings | 2020 Red Flag Warnings |
 |
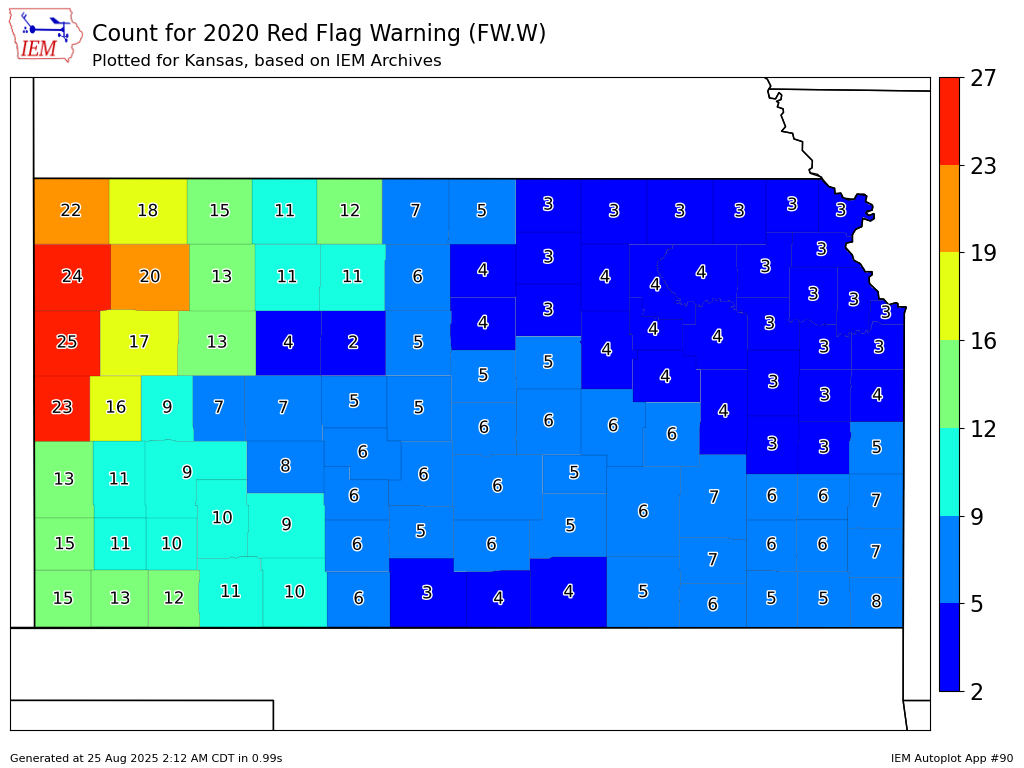 |
| The map above shows the number of High Wind Warnings issued in the state during 2020. As is often the case, western and central Kansas had the highest frequency of strong wind events. | The above map shows the number of Red Flag Warnings issued in the state during 2020. For more information on Red Flag Warnings, and what they mean, check out https://www.weather.gov/mqt/redflagtips. |
 |
Media use of NWS Web News Stories is encouraged! Please acknowledge the NWS as the source of any news information accessed from this site. |
 |