Analysis of the March 6th, 2007 South-central and Southeast Kansas Fire Weather Event
Andrew D. Kleinsasser
National Weather Service, Wichita, KS
1. Introduction
On the afternoon of March 6th, 2007, the combination of stout southwesterly winds, low relative humidities, and critical fuels contributed to extreme fire danger across most of south-central and southeast Kansas, along with southern portions of central Kansas. Consequently, the first ever Red Flag Warning (RFW) was issued for all of southeast Kansas, generally along and east of the Kansas Turnpike (I-35). Red Flag criteria was met for most of south-central and portions of central Kansas as well, but fuels were not considered "critical." Most (but not all) short and medium range numerical model guidance poorly anticipated the red flag conditions within 24 hours of the event, particularly dewpoints and to some extent wind speeds. This poor model performance contributed to a slower forecaster recognition of the situation, which in turn delayed the RFW issuance until late in the morning on March 6th. Note: images can be enlarged by left-clicking on them.
2. Synoptic Overview
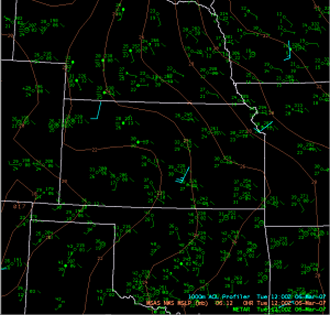
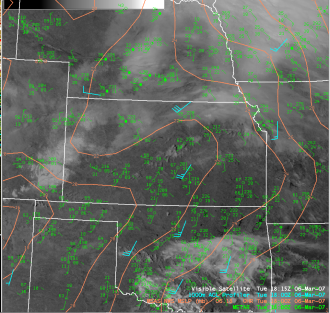
The day started out seemingly benign from a surface analysis standpoint, but the very dry airmass south of the quasi-stationary frontal boundary would quickly be realized per strong mixing as the morning progressed. Refer to Figures 1, 2 and 3 below.
 |
 |
 |
| Figure 1. 12z surface analysis. A quasi-stationary frontal boundary extended from southwest Colorado east/northeast into southwest and central Kansas. Notice the relatively dry low-level airmass generally south of the boundary, particularly across the western Oklahoma/Texas panhandle. | Figure 2. 18z surface analysis. The quasi-stationary boundary moved slightly south from its 12z position. Good mixing per deep southwesterly low-level flow allowed winds and temperatures to increase substantially, with dewpoints decreasing quite a bit south of the boundary. | Figure 3. 21z surface analysis. Mixing increased even more by mid afternoon, allowing for stronger winds, higher temperatures, and substantially lower dewpoints. Minimum afternoon relative humidities dropped into the low to mid teens, with a few locations dropping into the single digits. |
3. Numerical Model Performance
As stated in the introduction, most short and medium range model guidance drastically over-forecasted dewpoints on March 6th, with the exception of the RUC, which drastically under-forecasted dewpoints. The models, to a somewhat lesser extent, under-forecasted wind speed as well. However, the RUC and NAM were closer to reality than the GFS with regard to dewpoint and wind speed. All models under-forecasted daytime temperatures as well. The combination of higher than anticipated temperatures and lower than anticipated dewpoints resulted in lower than anticipated afternoon relative humidities, which fell well below 20% across much of south-central and southeast Kansas. The below images (Figures 4, 5, 6, 7, 8, and 9) will focus primarily on the over-forecasted dewpoints and under-forecasted wind speeds. Refer to the cursor readout over central Harper County for dewpoint readings.
 |
 |
| Figure 4. 00z initialization time, valid time 18z. NAM, GFS and LAPS surface dewpoints and winds, and surface observations valid 18z, March 6th. GFS and NAM initialization time is 00z, March 6th. NAM and GFS forecasted dewpoints were about 10 degrees too high compared to the relatively accurate LAPS data, especially over south-central Kansas. Conversely, NAM and especially GFS winds were too low compared to surface observations. | Figure 5. 00z initialization time, valid time 21z. NAM, GFS and LAPS surface dewpoints and winds, and surface observations valid 21z (00z GFS), March 6th. GFS and NAM initialization time is 00z, March 6th. Both the NAM and GFS continued to over-forecast dewpoints, although the NAM was somewhat closer to reality. The NAM was actually fairly close with respect to the wind. |
 |
 |
| Figure 6. 06z initialization time, valid time 18z. NAM, GFS, RUC and LAPS surface dewpoints and winds, and surface observations valid 18z, March 6th. GFS, RUC and NAM initialization time is 06z, March 6th. NAM and GFS continued to over-forecast dewpoints by about 10 degrees especially over south-central Kansas, while the RUC was much closer to reality, and actually under-forecasted dewpoints. All models continued to under-forecast wind speed, with the NAM showing the least amount of error. | Figure 7. 06z initialization time, valid time 21z. NAM, GFS and LAPS surface dewpoints and winds, and surface observations valid 21z (00z GFS), March 6th. GFS and NAM initialization time is 06z, March 6th. Over-forecasted dewpoints and under-forecaster wind speeds continued. |
 |
 |
| Figure 8. 12z initialization time, valid time 18z. NAM, GFS, RUC and LAPS surface dewpoints and winds, and surface observations valid 18z, March 6th. GFS, RUC and NAM initialization time is 12z, March 6th. NAM and GFS continued to drastically over-forecast dewpoints, especially over south-central Kansas. The RUC was still much closer to reality, but continued to under-forecast dewpoints by several degrees across Oklahoma. All models continued to under-forecast wind speed, with the NAM showing the least amount of error. | Figure 9. 12z initialization time, valid time 21z. NAM, GFS, RUC and LAPS surface dewpoints and winds, and surface observations valid 21z, March 6th. GFS, RUC and NAM initialization time is 12z, March 6th. NAM and GFS continued to over-forecast dewpoints by about 10 degrees, while the RUC was drastically under-forecasting dewpoints. GFS continued to drastically under-forecast wind speed. |
 |
 |
| Figure 10. DDC March 6th, 12z upper air sounding, compared to the NAM, GFS, RUC and LAPS 12z initializations. Notice the extremely deep and dry airmass, shallow surface moisture, and the shallow inversion (~50 mb), along with the 20-30 kt southwesterly winds near the top of the inversion. Given the anticipated synoptic conditions, one could have expected increasing surface wind speeds and decreasing dewpoints as the morning progressed, per the anticipated deep mixing. | Figure 11. OUN March 6th, 12z upper air sounding, compared to the NAM, GFS, RUC and LAPS 12z initializations. Essentially identical to the DDC upper air sounding (Figure 10). |
4. Review of the Equal Area Method: Forecasting Minimum Afternoon Dewpoints Using the Morning Sounding
|
Recall from the 10 February 2006 Harvey County Fire Review (Schreck and Cook, 2006) that the minimum afternoon dewpoint can be forecasted with decent accuracy using just a morning sounding. However, keep in mind that the equal area method does not take into account moisture advection or major airmass changes between the morning sounding and the afternoon. Included here are the steps outlining the equal area method along with a graphic to help visualize the process (Figure 12):
Applying the equal area method to the 12z ICT LAPS sounding indicated an afternoon minimum dewpoint dropping to near 19F. The actual ICT afternoon minimum dewpoint was 16F. The NAM and GFS 12z numerical model output suggested minimum afternoon dewpoints in the mid-20s and the mid-30s, respectively, 10-20 degrees higher than reality. So the equal area method was by far superior to the NAM and GFS with regard to forecasting dewpoints. |
 |
5. Summary and Discussion
Critical fuels, strong southwesterly winds, and low relative humidities on the afternoon of March 6th, 2007 contributed to extreme fire danger across a significant portion of central, south-central, and southeast Kansas. This prompted the first issuance of a Red Flag Warning (RFW) from the National Weather Service Office in Wichita. The forecast for this event was quite difficult given the poor moisture resolution by the numerical weather prediction models.
It was found through this review that utilization of the equal area method to forecast dewpoints should be used for analyzing environments that could be favorable for extreme fire danger. This method produced, in this case and previous cases assessed, better results for afternoon dewpoint minimums when a deep mixed layer exists. Caveats do exist with this method when strong moisture advection is occurring or expected, so it is suggest to analyze upstream environments when this is the case.
6. References
Schreck, M. and Cook, K.R. 2006: Major Grass Fire in Harvey County, NWS ICT Science and Education Publications

