Patio furniture buried under the snow in Belmond (Wright County). Photo Courtesy of KCCI (uLocal). Used with Permission.
During the snowstorm while driving outside of Humeston (Wayne County). Photo Courtesy of KCCI (uLocal). Used with Permission.
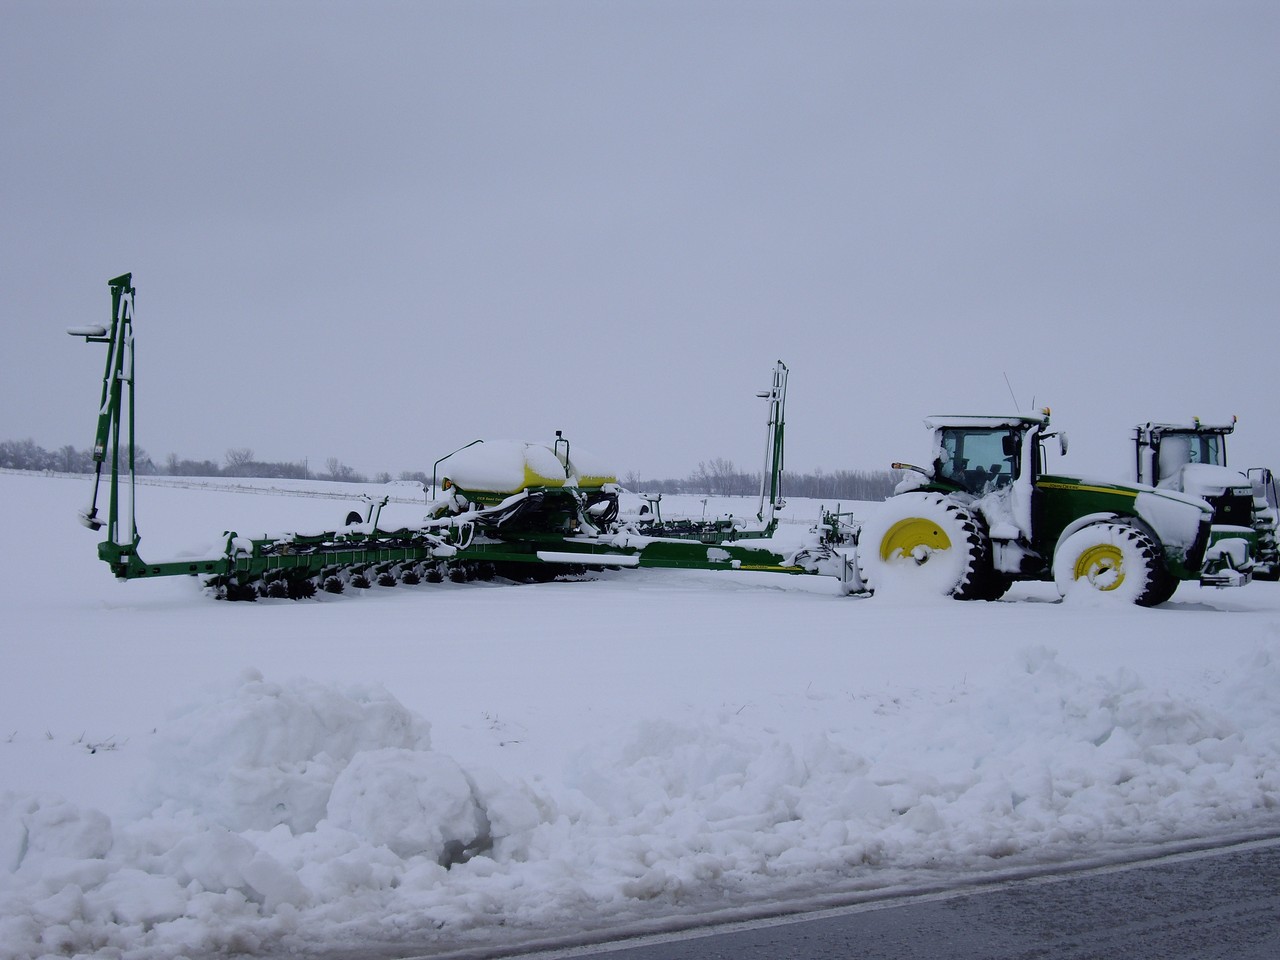
Farmers won't be going out in the fields in Dakota City (Humboldt County). Photo Courtesy of KCCI (uLocal) and Kelsey Olson. Used with Permission.
Downed snow-laden tree branch in Woolstock (Wright County). Photo Courtesy of KCCI (uLocal) and Tyler Anderson. Used with Permission.
Snow decorates the tulips in Pella for the Tulip Time Festival (Marion County). Photo Courtesy of KCCI (uLocal). Used with Permission.
A picturesque postcard...for December. Taken outside of Nevada (Story County). Photo Courtesy of Don Henderson and KCCI (uLocal). Used with Permission.
Snow filled Tulip in Pella (Marion County). Photo Courtesy of KCCI (uLocal). Used with Permission.
Downed tree in Vincent (Webster County). Photo Courtesy of KCCI (uLocal). Used with Permission.
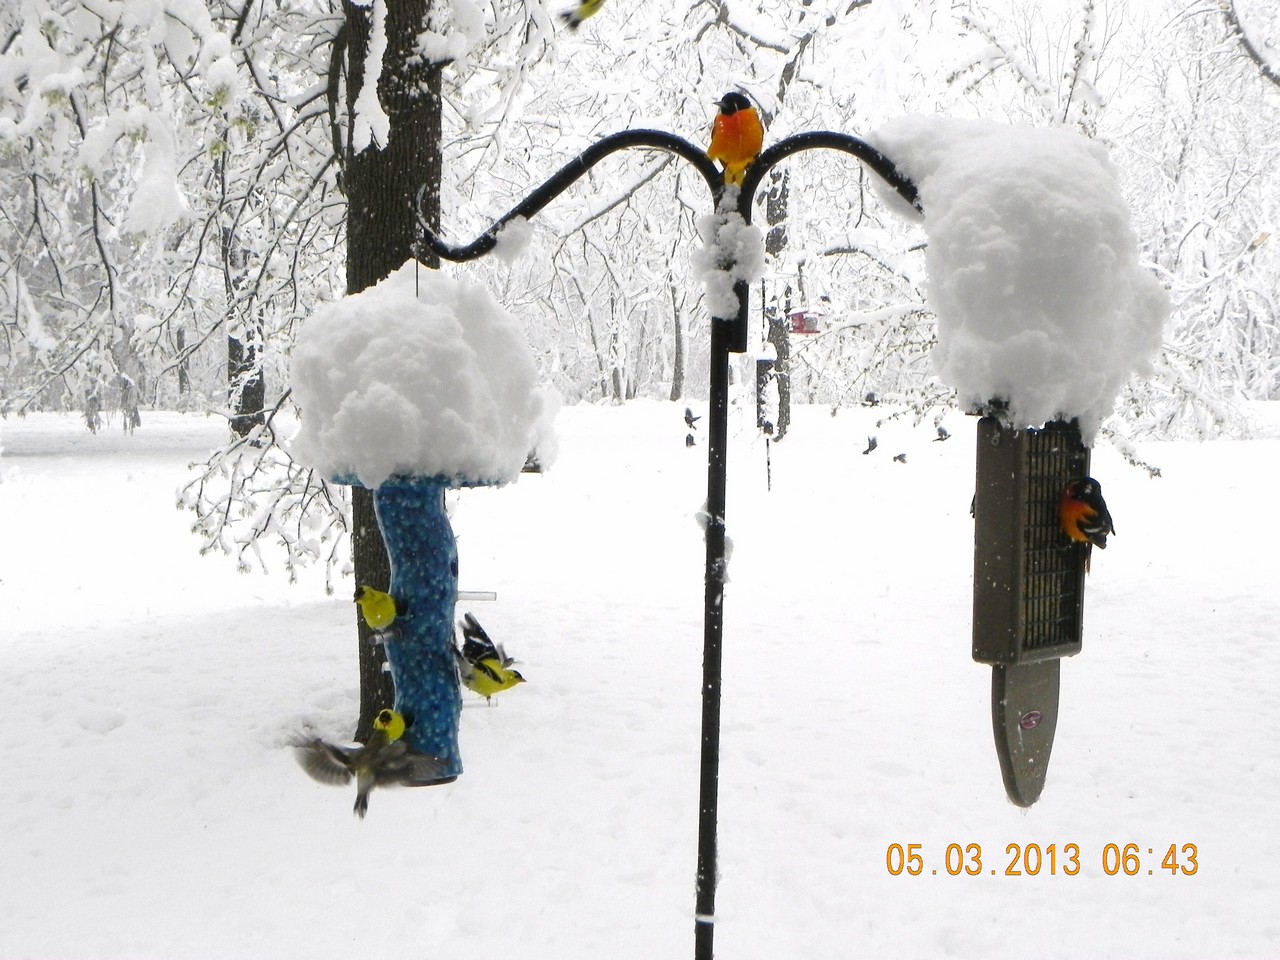
Snow topped bird feeders in Chariton (Lucas County), where some of the highest snow totals were observed. Photo Courtesy of KCCI (uLocal) and Linda Schrader. Used with Permission.
Snow-topped lilacs in Des Moines (Polk County). Photo Courtesy of KCCI (uLocal). Used with Permission.
Many Iowans took the opportunity to go play in the snow one more time. Photo taken in Lehigh (Webster County). Photo Courtesy of KCCI (uLocal). Used with Permission.
Snow buried car in Dakota City (Humboldt County). Photo Courtesy of KCCI (uLocal). Used with Permission.
Many Iowans wondered where spring had gone. Photo taken in Indianola (Warren County). Photo Courtesy of KCCI (uLocal) and Darren Worthington. Used with Permission.
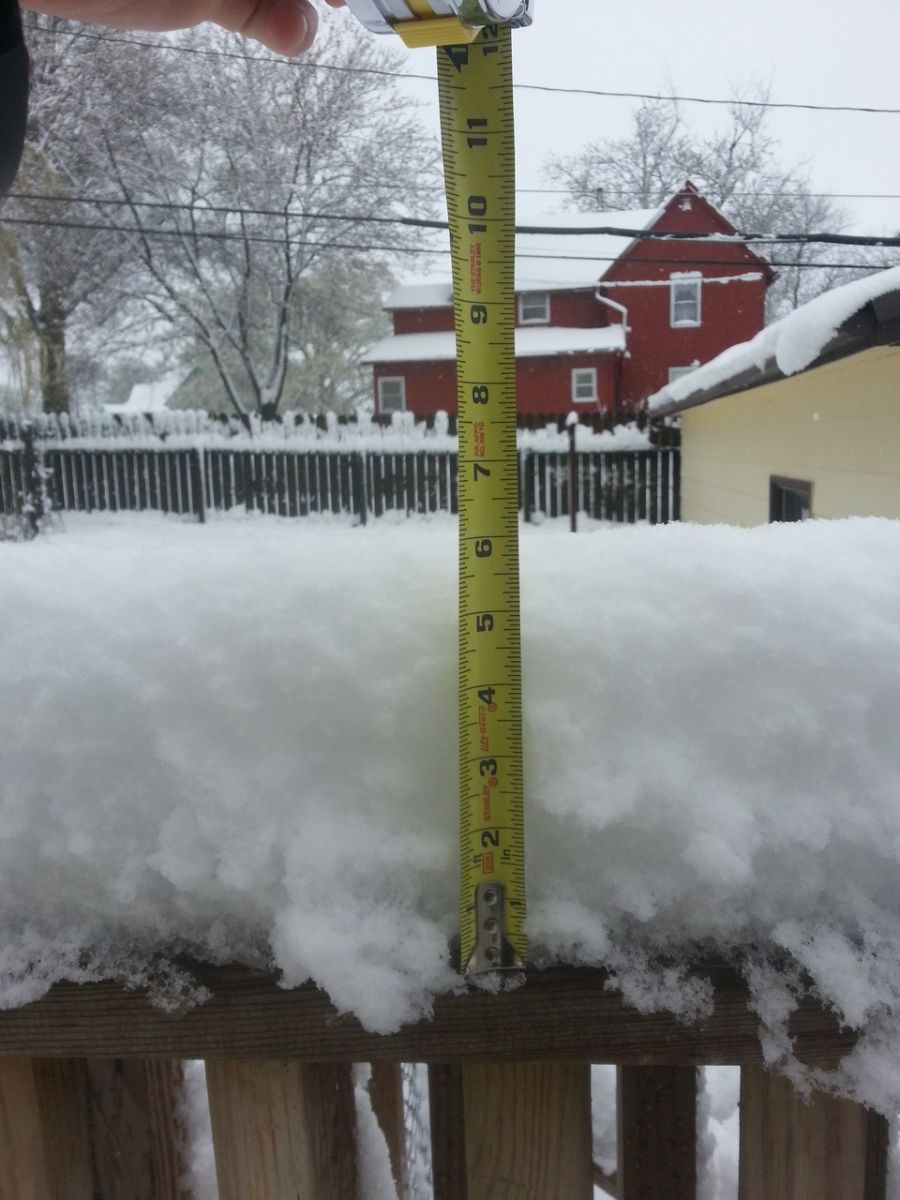
Six inches of snow on a deck railing in Knoxville (Marion County). Photo Courtesy of KCCI (uLocal). Used with Permission.
The snow wasn't about to stop this biker from heading out in Webster City (Hamilton County). Photo Courtesy of KCCI (uLocal). Used with Permission.
Radar loop of the snowstorm from the Des Moines WSR-88D Radar from 10am on May 1 to 6pm on May 3 (56 Hours)
Snowfall totals map from May 1 to 3 across Iowa. The highest snowfall amounts were recorded in south central and north central Iowa.
Snowfall totals across the central United States from the storm. The heaviest snow fell across northern Wisconsin and southeast Minnesota, where some places received over 15 inches of snow! Meanwhile, parts of northern Arkansas and eastern Oklahoma saw their first May snow in recorded history.
A before and after animation showing how quickly temperatures dropped behind the strong cold front that passed through the state on May 1. Temperatures are in red.
Overview of the synoptic setup that led to this event. Red lines are 500mb heights, yellow wind barbs are at 850mb, and the background color image is 300mb winds. The background black and white image is precipitation. A strong, blocking ridge of high pressure over the eastern US caused the approaching trough from the west to stall out and eventually separate from the main jet stream, forming a cut-off low over the south central US. Southeasterly winds between the ridge and the trough pumped moist air from the Atlantic up into the Midwest, where strong low and mid level forcing quickly generated widespread precipitation.
Cross section taken from NW (red star) to SE (green star) across much of the state. The two background images are frontogenetical forcing and relative humidity (see key at the top), showing that the area of strong frontogenesis (orange outline and white arrows) is sloped upwards from the near surface in the SE to around 600mb in the NW and most of the profile is quite saturated. The green lines are temperature (C), with the 0C isotherm highlighted in red. Dashed green lines are temperatures below freezing, and the solid green lines are temperatures above freezing. The dendritic growth zone, or the region where the largest snowflakes can be formed, is contained between the two blue lines (-10 and -20 C). Yellow lines are upward vertical motion, or omega. Dashed yellow lines imply upward motion and solid lines are downward motion. The image in the top right is the correlation coefficient (CC) radar product with the cross section line/stars overlaid.
Null.
Looking across north central Iowa on the evening of May 1, with Des Moines in in the bottom right of the image. CC and ZDR do a wonderful job of capturing the transition zone between the rain and snow (bracketed by the two black lines). The region in between the black likes is likely experiencing a mixture of rain and snow, or possibly sleet. Meanwhile, the conventional reflectivity product in the upper left is not displaying is kind of detail.
Later in the evening on May 1, looking across northern Iowa. Again, the rain/snow transition is well depicted in CC and ZDR. Rain is located to the east of this line and snow to the west. Notice the radial streaks in the CC product to the north of the transition zone. Also note the "bend" in the freezing layer near Fort Dodge (close up in the next image).
Close up of the "bend" in the freezing layer near Fort Dodge. It appears like this region is all snow based on the near 0 dB ZDR values in this region. In areas where it is raining (right side of the panes), the ZDR is closer to 1 dB. Embedded in the freezing layer is a pocket of all rain (white circle), while a small rain/snow shower lags behind the rest of the transition zone just to the east of Pocahontas.
The rain/snow line inches ever closer to Des Moines, while light rain with embedded heavier rain showers precedes the snow. The showers show up very well on ZDR (yellow circle in bottom left image) as patches of higher values (light blue to green, or 1 to 2 dB).
A gravity wave propagates from northeast to southwest through the band of heavy snow. The wave shows up well on the conventional reflectivity product (white circle) as a herringbone structure in the image. This wave actually generated a mixed precipitation shower well behind the rain/snow line (blue circle). This small shower propagated southwestward with the wave. Meanwhile, the rain showers continue to show up well in ZDR as patches of elevated values (red polygon).
Several hours after sunrise on May 2 finds the rain/snow line having pushed east of Des Moines and become substantially narrower than it was before. At this point, it was almost easier to locate the transition zone in ZDR instead of CC.
The rain/snow line makes its farthest advance to the east by the early afternoon of May 2 (yellow arrows). Meanwhile, ice crystals appear to be leading to the very high ZDR values over western Iowa (white arrows).
By the morning of the 3rd, a deep warm layer began overspreading the state from the east, generating a very large melting layer on the CC and ZDR products and pushing the rain/snow line back to the west. This warm layer eventually expanded across the entire state on the afternoon of the 3rd, finally transitioning the snow to rain.
An unprecedented spring snowstorm impacted the central United States from May 1 to May 3, dropping record-shattering amounts of snow up and down the western Mississippi River Valley. Some locations across the southern United States saw their first ever May snowfall and cities in Kansas and Missouri saw their highest snowfall totals in 106 years. Meanwhile, noteworthy May single day and storm total records for the states of Iowa, Minnesota, and Wisconsin were eclipsed by this event. South central Iowa up through southeast Minnesota and western Wisconsin bore the brunt of the snowfall with 10+ inch reports not uncommon. Warm road temperatures across Iowa helped to initially melt the falling snow, but conditions quickly deteriorated across the regions where heavier snow fell. This led to numerous accidents and spin outs. Sporadic power outages also occurred as snow-coated tree branches broke and took out power lines.
 |
 |
 |
|
Radar loop of the snowstorm from the Des Moines WSR-88D Radar from 10am on May 1 to 6pm on May 3 (56 Hours!)
|
Snowfall totals map from May 1 to 3 across Iowa. The highest snowfall amounts were recorded in south central and north central Iowa.
|
Snowfall totals across the central United States from the storm.
|
Records Broken
May snowfall and temperature records across Iowa fell like dominoes during this historic event. Below is a listing of central Iowa and statewide records that were surpassed. Previous records are listed in italics.
| State of Iowa |
- Highest May Storm Total Snowfall: 13.0" in Osage
(10.0" in Le Mars on 5/28/1947)
- Biggest Iowa Snowstorm based on Average Statewide Snowfall: 3.3" **
(1.2" on 5/28/1947)
- Latest Spring Storm to produce more than a Foot of Snowfall: 5/1/2013 to 5/3/2013
(4/20/1918 and 4/20/1992)
** Preliminary
|
| Des Moines |
Snowfall
- 5/2 Daily Snowfall Record: 3.4" (T in 1976)
- 5/3 Daily Snowfall Record: 3.5" (1.2" in 1907)
- Monthly (May) Maximum One Day Snowfall: 3.5" on 5/3/2013 (1.2" set on 5/3/1907)
- Total May Snowfall: 6.9" (1.3" in 1907)
- Latest Snowfall of 3.5": 5/3/2013 (4/29/1907)
Interesting Fact: Snow was continuously reported at the Des Moines Airport from 6:34am on May 2 to 2:48pm on May 3, or for an uninterrupted 31 hours and 14 minutes!
Temperature
- 5/2 Record Low Maximum Temperature: 41 (47 in 1953)
- 5/3 Record Low Maximum Temperature: 35 (41 in 1967)
- Monthly (May) Record Low Maximum Temperature: 35 on 5/3/2013 (39 on 5/5/1944)
Interesting Fact: The average temperature at Des Moines on May 3 was 34.5 degrees, tying it with May 5, 1944 for the coldest May day on record. That day in 1944 was also the last time Des Moines had measurable snowfall in May (0.2").
|
| Waterloo |
Snowfall
- 5/2 Daily Snowfall Record: 1.2" (T in 2005/1976)
- 5/3 Daily Snowfall Record: 0.5" (Ties Previous Record of 0.5" in 1935)
- Second Highest Total May Snowfall: 1.7" (Highest Total: 2.0" in 1945 and 1947)
Temperature
- 5/2 Record Low Maximum Temperature: 39 (42 in 1909)
- 5/3 Record Low Maximum Temperature: 36 (38 in 1954)
- Monthly (May) Record Low Maximum Temperature: 36 on 5/3/2013 (37 on 5/1/1909)
|
| Mason City |
Snowfall
- 5/2 Daily Snowfall Record: 6.0" (T in 1954)
- 5/3 Daily Snowfall Record: 3.5" (T in 1954)
- Monthly (May) Maximum One Day Snowfall: 6.0" on 5/2/2013 (4.0" set on 5/28/1947 and 5/8/1938)
- Total May Snowfall: 9.5" (4.5" in 1947)
- Latest Snowfall of 6.0": 5/2/2013 (4/14/1949)
Temperature
- 5/2 Record Low Maximum Temperature: 36 (40 in 1935)
- 5/3 Record Low Maximum Temperature: 33 (35 in 1954)
- Monthly (May) Record Low Maximum Temperature: 33 on 5/3/2013 (34 on 5/1/1909)
|
Meteorological Overview
It took a combination of several unseasonably strong and unusual features to produce this exceeding rare snow event.
 The last few days of April were characterized by warm, summer-like temperatures with Des Moines reaching 86 degrees on the 30th. This was a welcome reprieve after what had been undoubtedly a cold and damp start to spring. This warmup came to an abrupt end late on Tuesday, April 30 as a strong cold front slid through Iowa, igniting several severe thunderstorms over the southwest corner of the state. Temperatures behind the front began falling on Tuesday night and kept dropping through the day on Wednesday (May 1), with many locations recording their warmest readings for the day shortly after midnight. Daytime temperatures on May 1 were a full 30-40 degrees colder than the previous day. The surface observation map animation on the left loops between the early morning hours of May 1 and May 2, showing the stark change in temperatures (in red) over the state after the passage of the front.
 Just behind the surface cold front, a strong mid to upper level trough of low pressure slid southeastward from Canada. However, a large stationary ridge of high pressure, known as a omega block, was also taking shape across the eastern United States. Its forward progress inhibited, the upper level trough simply came to a grinding halt over Iowa. The trough eventually formed a cut-off low centered over the south central US by Friday morning (May 3), which meandered over the region for the next three days before drifting eastward. The system was also able to tap into a nearly continuous supply of moisture from both the Gulf of America and western Atlantic Ocean during its stay over the Midwest. This moisture worked up into Iowa, where strong mesoscale and synoptic lift generated a wide swath of precipitation that fell for days straight. The synoptic setup for this event is shown in the image on the right.
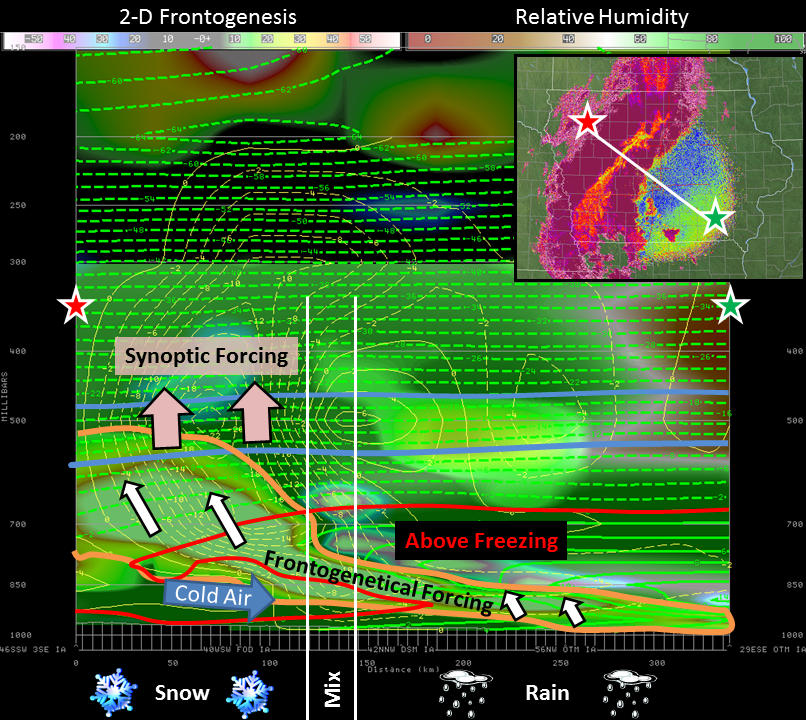 The precipitation shield first took the shape of rain showers over southeast South Dakota and northwest Iowa late on April 30th. This band of rain lifted northwestward during the overnight hours as the trough stalled and began transitioning to snow over far northwest Iowa just before sunrise on Wednesday, May 1. It then began a slow, steady march to the southeast over the next 36 hours. The leading edge of the precipitation shield consisted of light rain with embedded heavier showers. The rain eventually transitioned to a rain/snow mix and eventually snow as continued cold air advection and melting ice crystals cooled temperatures aloft below freezing. The cross section on the left attempts to tie the type and location of forcing, vertical temperature/moisture profiles, and radar signatures to what was observed on the ground. The diagram shows that the precipitation-generating frontogenetical forcing on the eastern side of the precipitation shield was well within the low-level above freezing layer, leading to the rain (and lack of a melting layer aloft in CC). Meanwhile as one travels further NW the frontogenesis band becomes more elevated and broad, synoptic lift associated with the trough of low pressure becomes evident in the omega plot. This leads to the generation of large snowflakes aloft (note how the omega maximum is located in the dendritic growth zone) that, as they fall/melt through the 850-700mb warm layer, quickly cause the air to cool below freezing and allow the snow to reach the ground. This schematic almost perfectly matches what was seen in the CC radar product (top right), where the melting layer shows up as the area of orange and yellow values.
The cold air advection and cooling due to melting snow caused the rain/snow line to shift all the way to east central Iowa. The line then became stationary late on May 2 as the upper level trough transitioned to a closed low. The rain/snow line then retreated back to the west during the day on May 3 as a broad region of warm air wrapped north and west around the eastern flank of the low. This surge of warm air eventually brought the snow to an end by late in the day on Friday, but a widespread, cold rainfall continued into the weekend with the cut-off low spinning overhead.
Dual-Pol Radar Overview
The WSR-88D dual-pol radar in Des Moines captured many intriguing features and signatures during this snowstorm. As with the blizzard back in December, the new dual-pol products did a great job honing in on the transition zone between rain and snow, as well as discerning the different types of rain drops and snowflakes. Each screenshot below consists of a four panel image, with conventional reflectivity in the upper left, correlation coefficient (CC) in the upper right, differential reflectivity (ZDR) in the lower left, and specific differential phase (KDP) in the lower right. Click on each image for more information on what the radar was sampling. Show the definition of the dual-pol products.
Unlike conventional radars, dual-pol radars are able to determine the shape and size variability of particles that it samples, thus it is able to distinguish between different types of precipitation (rain, snow, rain/snow mix, hail, etc.) and allows for better precipitation estimates. The dual-pol upgrade introduced three new products: differential reflectivity (ZDR), correlation coefficient (CC), and specific differential phase (KDP). ZDR determines whether the particles are round or oblate and whether they are oriented the horizontal or vertical. CC shows whether or not the particles in the sample volume are similar in shape and size, and KDP determines the water content of the precipitation.
Photos
Below are some of the amazing photos taken across central Iowa during and after the storm.
Central Iowa Storm Total Snowfall Amounts
The table below contains storm total snowfall amounts from May 1 to 3, sorted by amount. These values are still considered preliminary and may be subject to adjustment.
| Key: |
NWS Observation |
NWS COOP Observer |
COCORAHS Observer |
Spotter/Public Report |
| Location |
Amount |
|
Location |
Amount |
| Chariton |
12.0" |
|
Clarion |
6.0" |
| Lake Mills |
11.6" |
|
Conrad |
6.0" |
| Britt |
11.0" |
|
Knoxville |
6.0" |
| 2 mi NNE of Forest City |
11.0" |
|
Lorimor |
6.0" |
| Northwoord |
10.7" |
|
1 mi NW of Nevada |
6.0" |
| 5 mi NE of Algona |
10.7" |
|
Parkersburg |
6.0" |
| 4 mi S of Allerton |
10.0" |
|
Pocahontas |
6.0" |
| Humeston |
10.0" |
|
4 mi W of Swea City |
6.0" |
| State Center |
10.0" |
|
1 mi NW of Centerville |
5.5" |
| Kanawha |
9.5" |
|
3 mi WNW of the Newton Airport |
5.5" |
| Mason City <- Official Total |
9.5" |
|
Rolfe |
5.5" |
| Allison |
9.0" |
|
West Ames |
5.3" |
| Hampton |
9.0" |
|
5 mi WNW of Des Moines |
5.3" |
| Garner |
8.5" |
|
Hartford |
5.3" |
| Iowa Falls |
8.5" |
|
Boone |
4.4" |
| Grundy Center |
8.0" |
|
Osceola |
4.1" |
| 6 mi NW of Promise City |
8.0" |
|
Audubon |
4.0" |
| 2 mi W of Indianola |
7.5" |
|
Emmetsburg |
4.0" |
| Mason City |
7.5" |
|
NWS in Johnston |
3.9" |
| 3 mi NNW of Whittemore |
7.3" |
|
Clive |
3.5" |
| 3 mi W of Algona |
7.0" |
|
Bedford |
3.2" |
| Dumont |
7.0" |
|
Estherville |
3.0" |
| 5 mi NNW of Fort Dodge |
7.0" |
|
3 mi W of Grinnell |
3.0" |
| Guthrie Center |
7.0" |
|
1 mi SSE of Cedar Falls |
2.5" |
| 1 mi W of New Virginia |
7.0" |
|
Denison |
2.5" |
| Ringsted |
7.0" |
|
4 mi N of Oskaloosa |
2.5" |
| Rockwell City |
7.0" |
|
Rathbun Dam |
2.5" |
| Webster City |
7.0" |
|
1 mi NE of Atlantic |
2.3" |
| Des Moines Arpt <- Official Total |
6.9" |
|
Brooklyn |
2.0" |
| 1 mi ESE of Altoona |
6.5" |
|
Mount Ayr |
2.0" |
| Carroll |
6.5" |
|
Waterloo Arpt <- Official Total |
1.7" |
| 3 mi NW of Badger |
6.2" |
|
1 mi S of Pella |
1.2" |
| Murray |
6.1" |
|
4 mi NW of Ottumwa |
1.0" |