Overview
Throughout the day on June 30, 2014, a series of severe thunderstorms raked across the central corridor of Iowa, bringing a wide spectrum of high-impact severe weather on a scale not seen across the state in many years. The early phases of the event witnessed several supercell thunderstorms drop hail over 4 inches in diameter over parts of western Iowa. Additional storms moving in from northeast Nebraska in the late morning congealed into a damaging straight-line wind storm as it reached the Missouri River. However, multiple storms retained their supercellular characteristics along and out ahead of the squall line. These storms were responsible for three short-lived EF1 and EF-2 tornadoes in Adair, Madison, and Tama counties. By the time the storms reached east central Iowa, a well-defined bow echo had formed and accelerated eastward towards Cedar Rapids and the Quad Cities. Widespread flash flooding also took place in many areas already hit with the damaging winds and tornadoes due to a combination of training and efficient rain producing storms. Most locations under the squall line picked up a quick one to two inches of rain in under 30 minutes, which simply could not be handled by the already saturated ground. Some reporting stations recorded 4-6 inches for the calendar day.
|
|
 |
| Radar Loop across Iowa from 12:00am to 9:00pm CDT on June 30, 2014 | Storm Reports from June 30 across the US (Click Image for More) |
The Environment
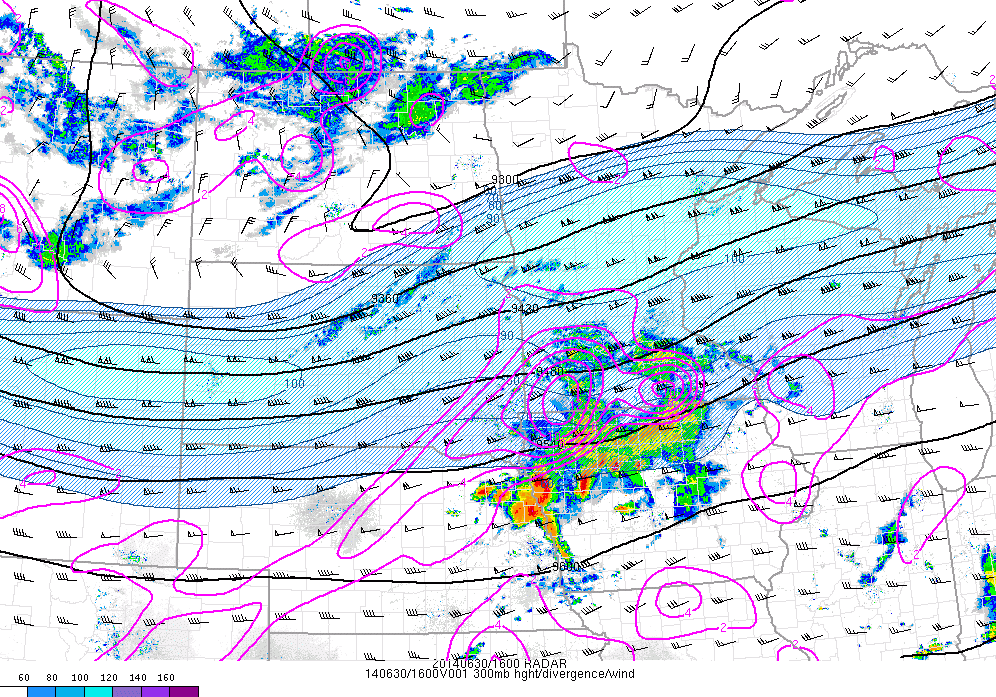
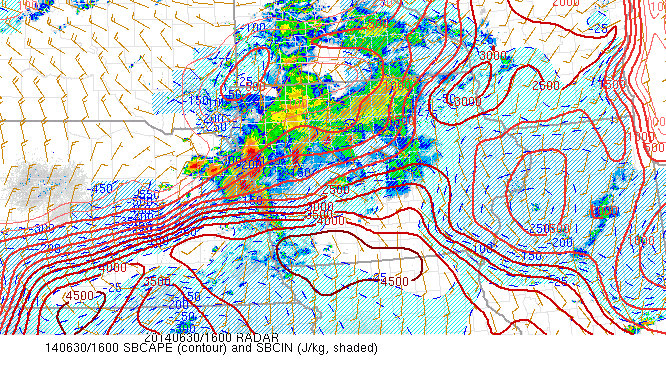
The overall environment was primed for a major severe weather event on the morning of June 30. A sharp upper-level shortwave trough was diving south as it rotated around its parent low in south central Canada. A 60-80 kt zonal jet stream existed upstream of this trough over South Dakota and Minnesota, with a 100 kt jet streak located over Minnesota (Fig. 1). Iowa was situated under the right-rear quadrant of this jet, an ideal location to maximize the synoptic, broad-scale lift provided by this jet streak. Ample low-level moisture was available for ingesting into the storms (850mb Fig. 2) while the 12Z Omaha sounding on June 30 (Fig. 3) revealed a deep elevated mixed layer (EML) from 800 to 600 mb. This pocket of dry air increased the surface-based CAPE (SBCAPE) of the sounding to over 4000 J/kg, more than ample instability to fuel thunderstorm development.
 |
 |
 |
| Figure 1: 300 mb Heights, Winds, and Divergence | Figure 2: 850 mb Heights, Temp, and Dewpoint | Figure 3: The Omaha Sounding at 12Z (7:00am CDT) on 6/30 |
The near-storm environment was just as potent as the synoptic environment. Wind shear throughout the lower to mid troposphere was quite strong, often times in the 50 to 60 kt range (Fig. 4). This change in wind speed/direction enabled the storms to maintain their organization over long periods of time, increasing their severity. The shear also led to updraft rotation in many of the storms which accelerated the growth of hailstones and can aid in tornado formation. Initially the storms were elevated, that is that the updrafts were ingesting instability based not at the surface, but potentially thousands of feet in the atmosphere. Many storms during the overnight and morning hours are elevated due to the presence of a nocturnal inversion. While the threat for damaging winds and tornadoes lessens with elevated storms, these cells can still be prolific hail producers. This was the case with the initial supercells that impacted the state (Fig. 5). Despite 2000-4000 J/kg of CAPE, the inversion was still in place (measured by convective inhibition, or CIN). However, as daytime heating commenced, the inversion at the surface was wiped out and the storms became rooted at the surface (Fig. 6), allowing for the onset of widespread damaging winds and tornadoes.
 |
 |
 |
| Figure 4: Effective Shear (kts) at 1:00pm CDT 6/30 |
Figure 5: Surface-Based CAPE at 11:00am CDT 6/30 |
Figure 6: Mixed-Layer CAPE at 1:00pm CDT 6/30 |
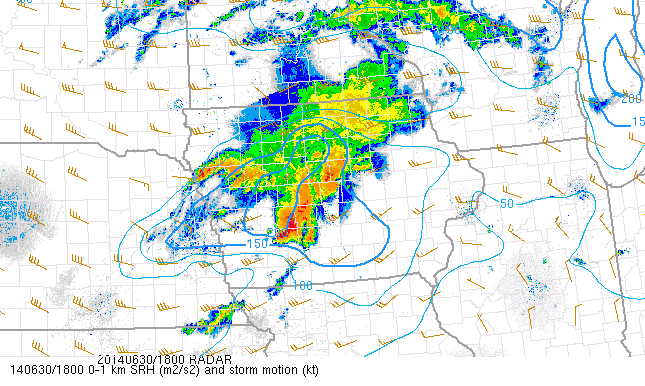
The tornadic environment also became more favorable as the late morning and early afternoon wore on. In addition to the storms becoming surface-based, the low-level helicity, a measure of the potential for updraft rotation (using sounding hodographs), increased from about 50 m2/s2 to 200 m2/s2 by 1:00pm CDT, around the time of the first tornado touchdown (Fig. 7). The lifted condensation level, or LCL, also fell to around 750 m in central Iowa by 1:00pm CDT (Fig. 8). Generally any values less than 1000 m are conducive for tornado development. At the time of the first tornado touchdown around 12:45pm CDT, the significant tornado parameter, which takes all of these aforementioned variables and more to determine the potential for a tornado, was pegged over southwest Iowa, almost precisely where the first tornado touched down (Fig. 9).
 |
 |
 |
| Figure 7: 0-1 km Helicity (m2/s2) at 1:00pm CDT 6/30 |
Figure 8: LCL Height (m) at 1:00pm CDT 6/30 |
Figure 9: Sig Tor Parameter (Eff) at 1:00pm CDT 6/30 |
By the mid afternoon, conditions had also become conducive for a widespread, damaging wind event. Values of Downdraft CAPE (DCAPE), which measures the potential negative buoyancy of a parcel, had exceeded 1000 J/kg out ahead of the developing bow echo (Fig. 10). The derecho composite parameter, which uses several variables to predict the likelihood of a widespread, damaging wind event, had risen quite high in the same locations out ahead of the storm (Fig. 11).
 |
 |
| Figure 10: Downdraft CAPE (J/kg) at 1:00pm CDT 6/30 |
Figure 11: Derecho Composite Parameter at 2:00pm CDT 6/30 |
Radar and Photo Review
Hail
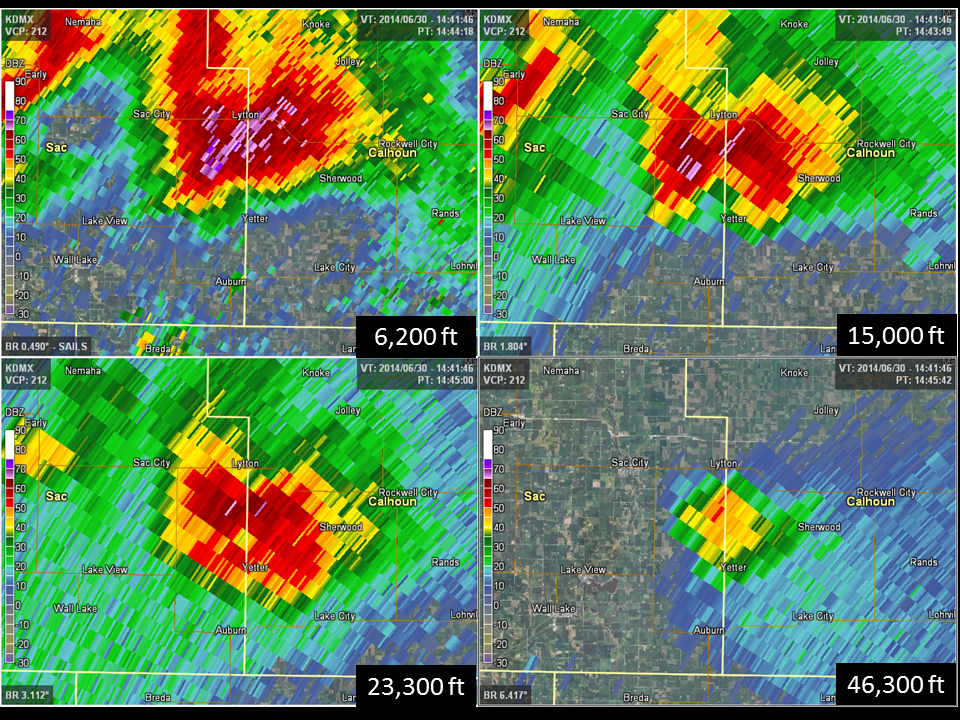
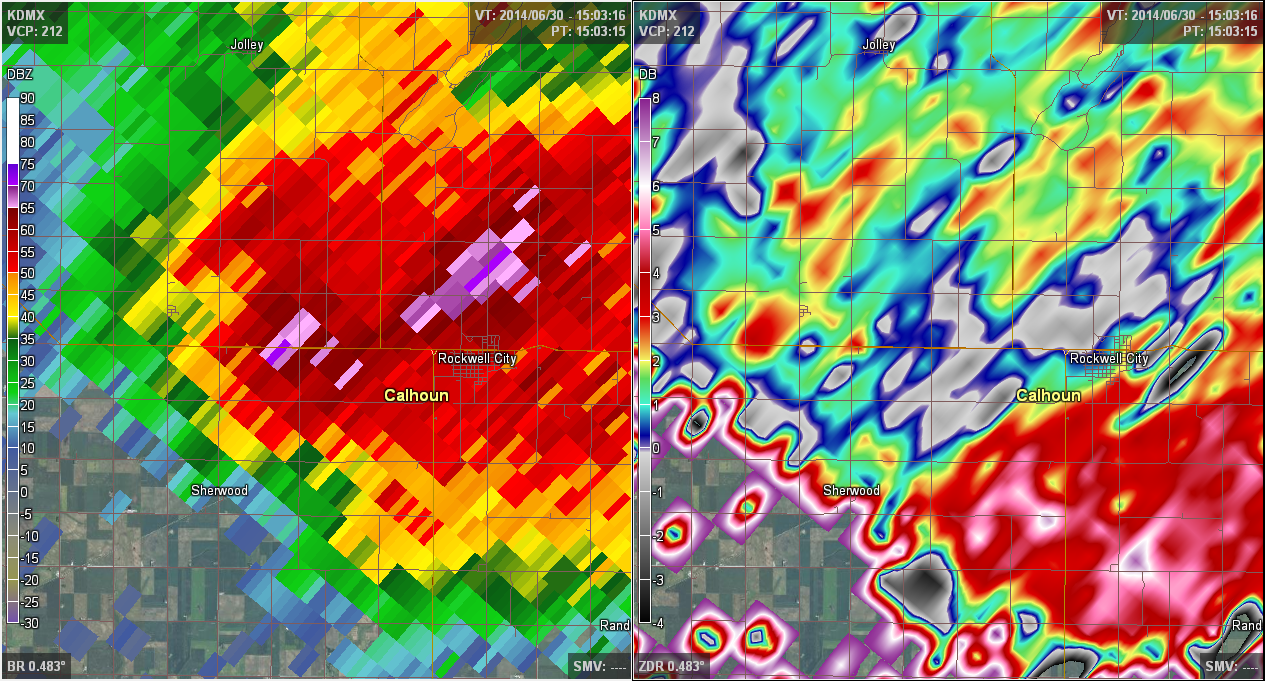
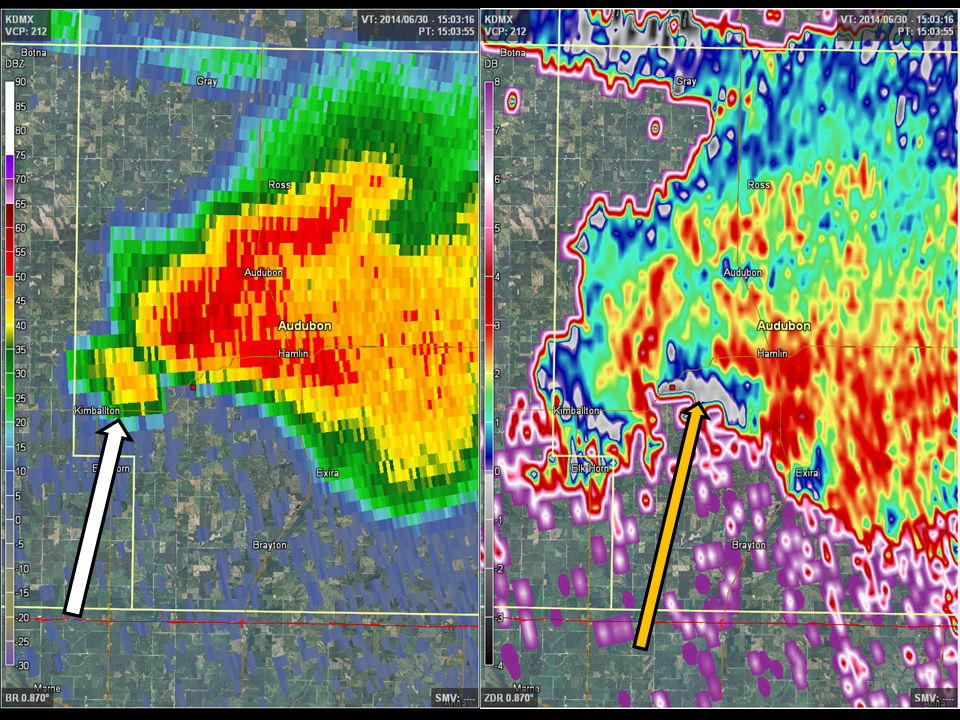
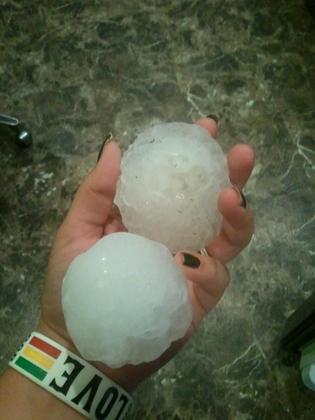
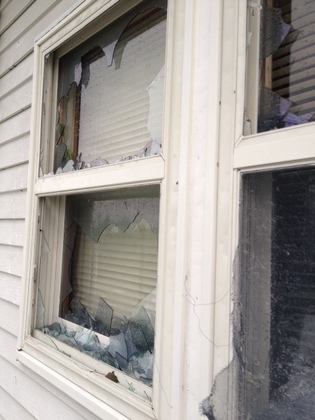
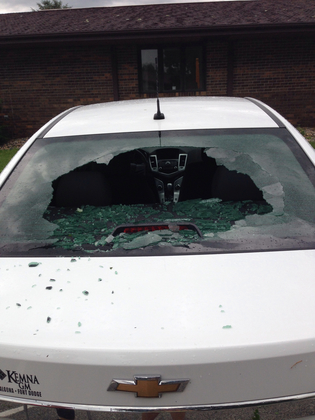
Multiple supercell thunderstorms formed during the early to middle stages of the event and unleashed dangerously large hail over parts of western Iowa. One northern cell tracked across Sac, Calhoun, and Webster counties between 9:00am and 11:00am, dropping hail close to the size of baseballs on Rockwell City and tennis ball size hail on Fort Dodge. This hail smashed car windshields and damaged roofs in both towns. A second supercell ongoing at the same time to the south plotted a course from Harrison County to northern Boone County before merging with another cell and transitioning into a wind/tornado threat, with hail as large a golf balls falling from this storm. Finally, a third massive supercell developed over Audubon, Cass, Adair, and Guthrie counties shortly after 12:00pm and proceeded to drop wind-driven golf ball size hail over a wide swath of prime farm land.
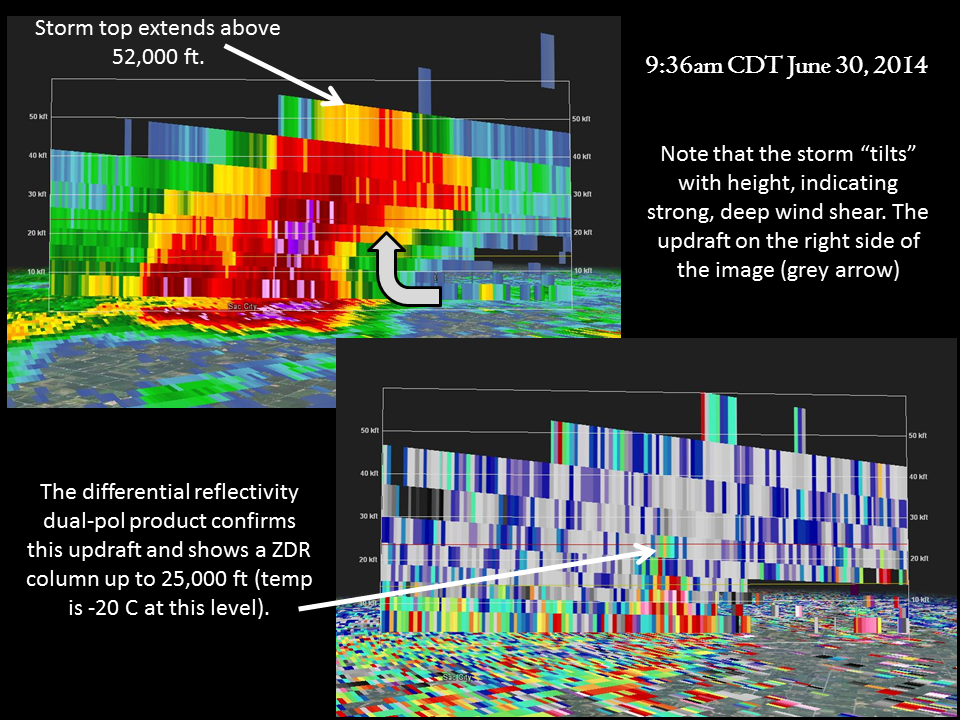
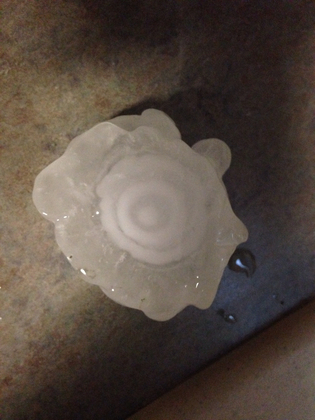
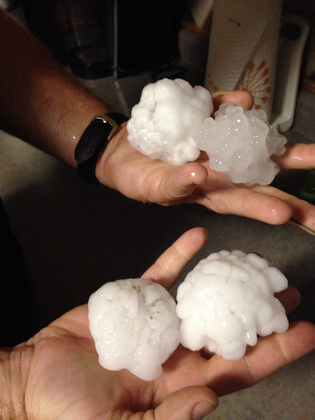
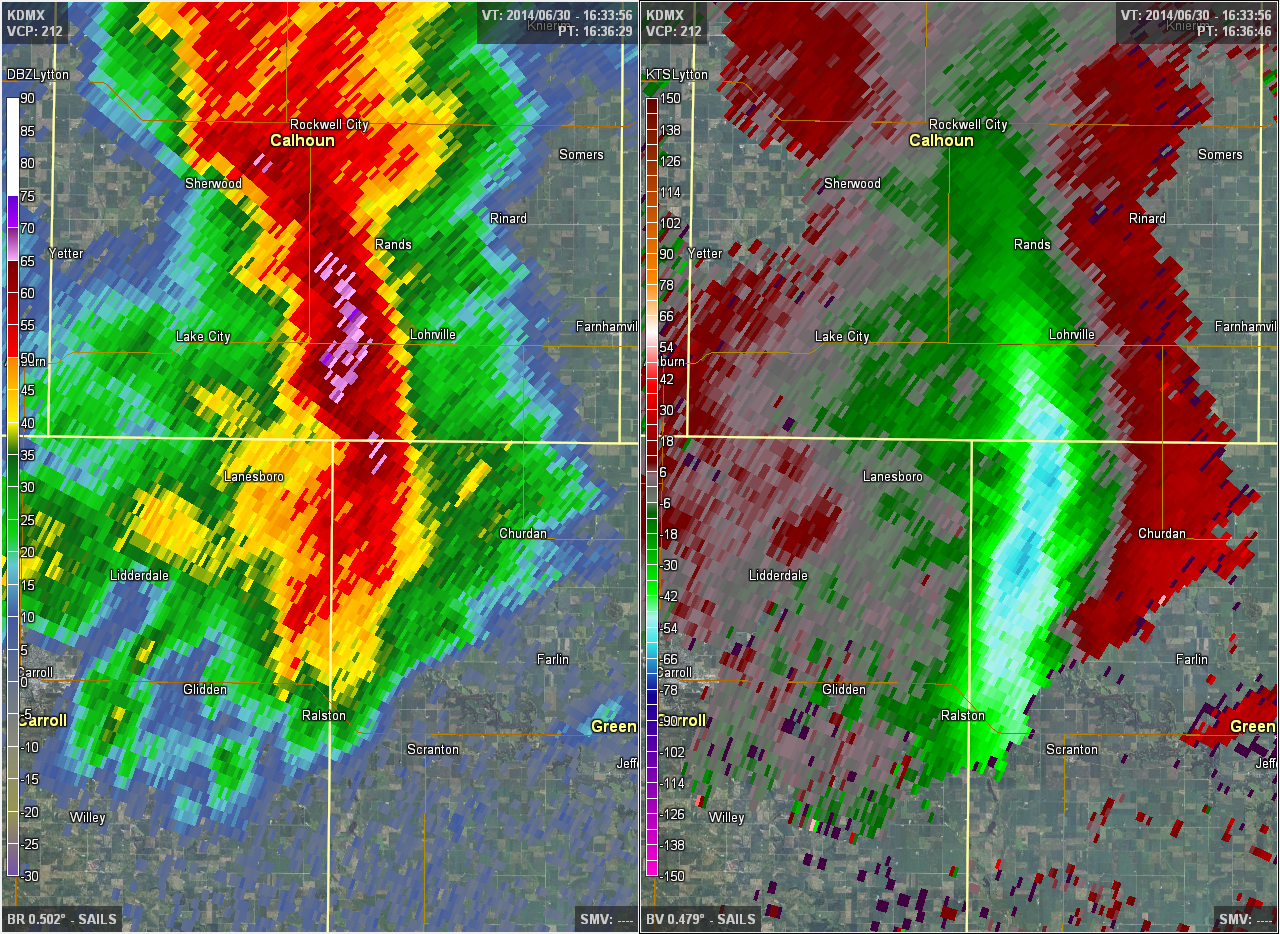
All three storms exhibited impressive structure and characteristics normally seen with storms over Texas, Oklahoma and Kansas. The northern supercell extended up to 52,000 ft in the atmosphere (with a sustained core of 50+ dBZ to 46,000 ft) with a ZDR column that reached up to 25,000 ft high (freezing level was 13,000 ft). A ZDR column is an area of higher differential reflectivity values well above the freezing level that denote the presence of liquid water drops being lofted by the storm's updraft. The higher the ZDR column, the stronger the updraft and the higher the hail producing potential. Meanwhile, the second cell to the south sported a very classic supercell structure with a persistent RFD (which generates the telltale "hook echo") that lasted for much of its life. Both the first and third supercells developed features known as bounded weak echo regions (BWERs) in their mid levels, a key tip off that the storm's updraft is quite strong and capable of producing massive hail. The latter supercell in particular was well sampled by the WSR-88D radar in Des Moines, with radar cross sections easily resolving a large BWER juxtaposed on a tall ZDR column just below a large hail core. The radar images below highlight some of the defining characteristics of these storms, followed by several public photos of the resultant hail.
 |
 |
 |
 |
 |
 |
 |
 |
 |
 |
 |
 |
 |
 |
 |
Straight-Line Winds
Damaging straight-line winds affected much of the southern half of Iowa at some point during the day. The first wave of damaging winds originated from a squall line tracking out of northeastern Nebraska into Woodbury and Monona counties around 10:30am. However, the strongest winds were not realized at the surface due to the storm being somewhat elevated and the bow echo weakened as it crossed Crawford County as a new complex of cells took shape to the south over Shelby and Audubon counties just before noon.
Multiple cells out ahead of this main squall line contained damaging winds. One storm in particular tracked through Ida and Sac counties fast on the heels of the 4 inch hailstorm and continued on a due east course to Tama County before being absorbed by the main squall line. WSR-88D velocity data indicated winds of 55 to 60 kts with the line as it pushed towards I-35. The aforementioned second, southern supercell merged with this line in northern Boone County, and this merger generated a small but intense region of damaging winds from NE Boone County eastward to Tama County.
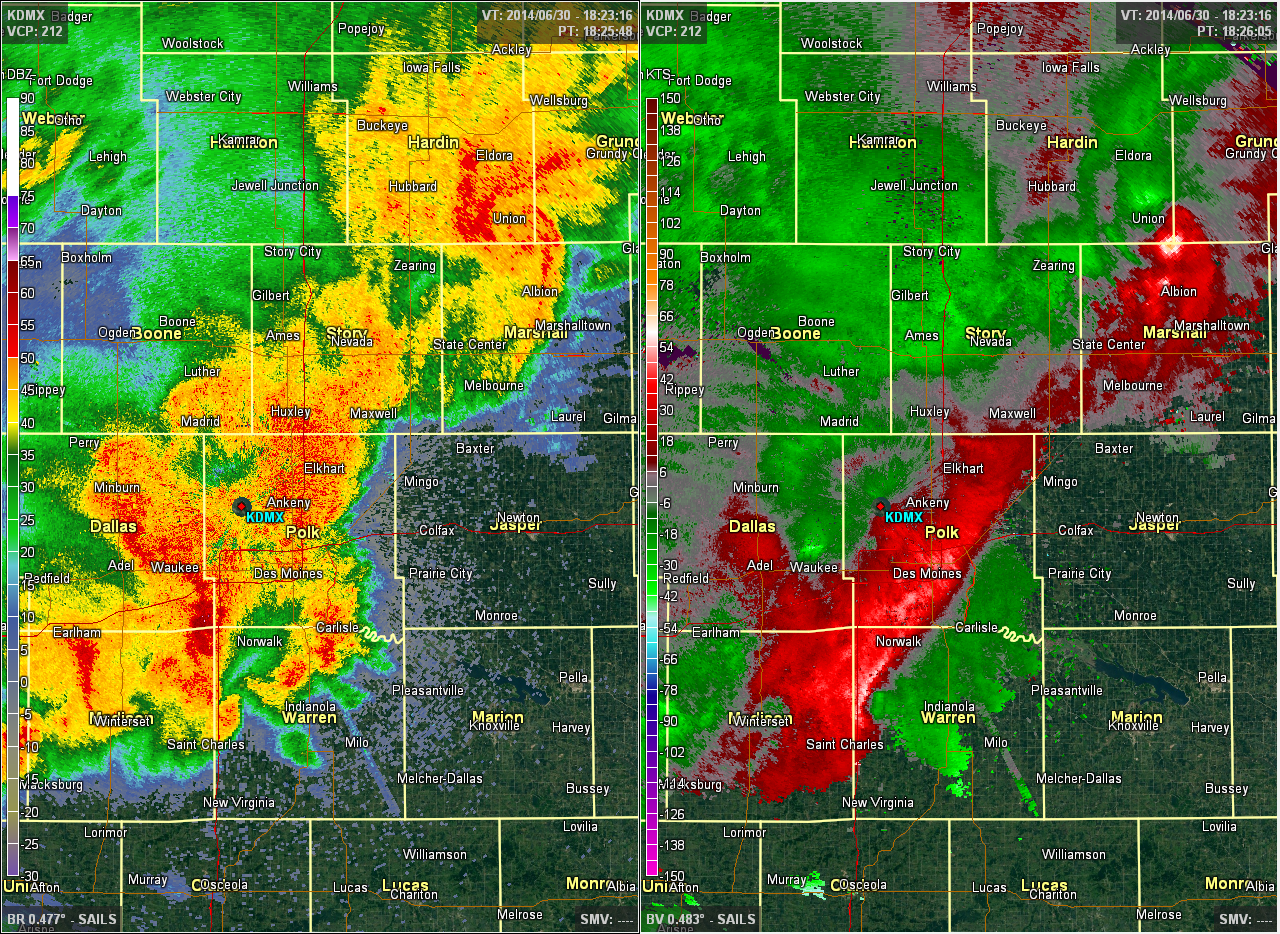
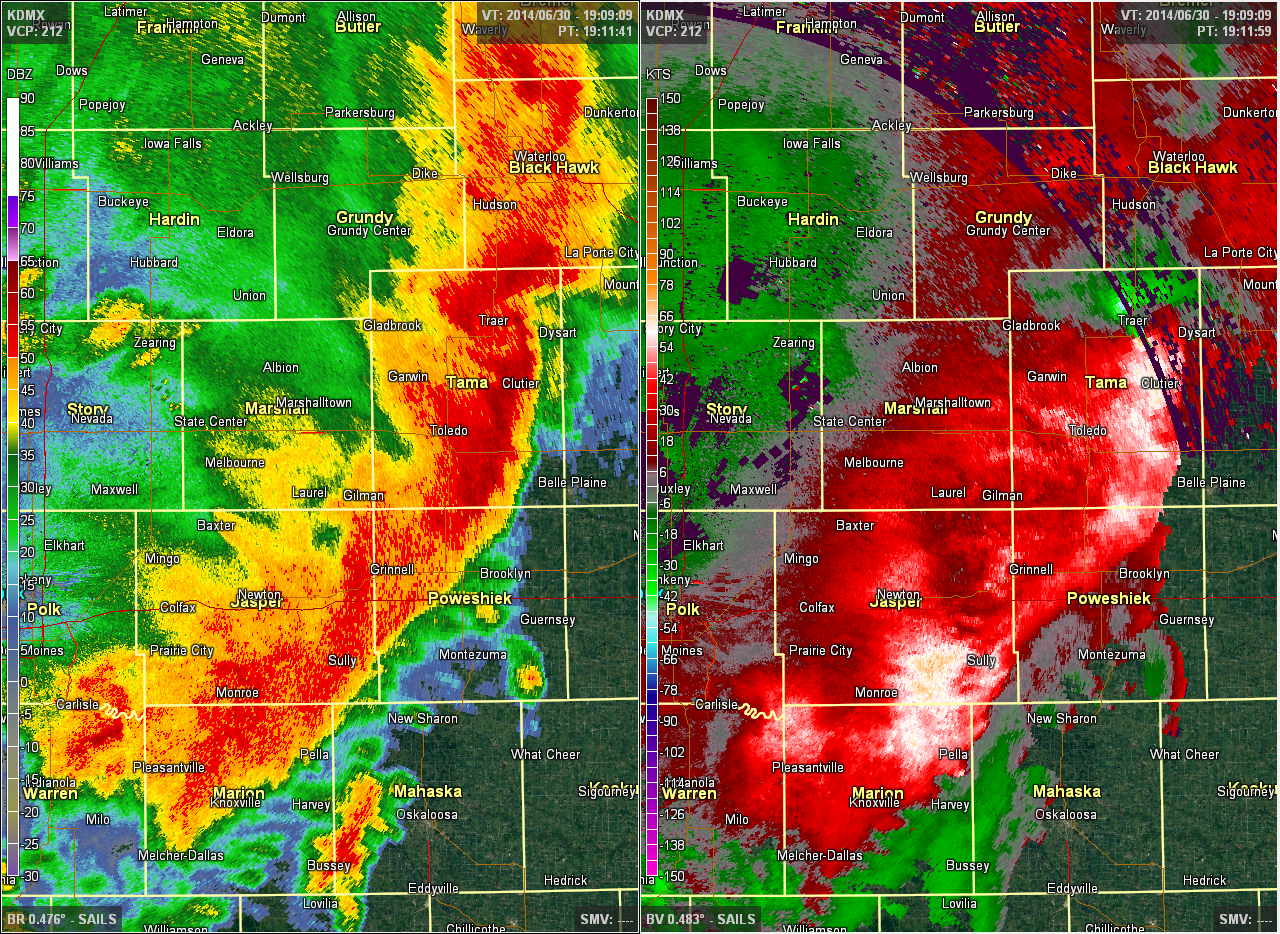
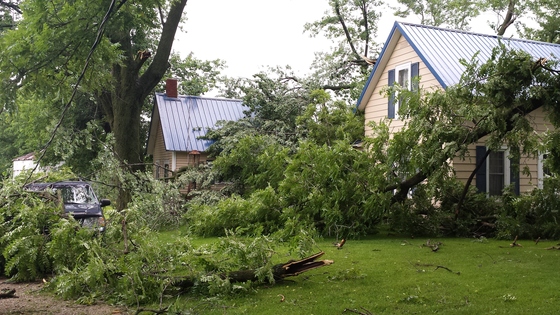
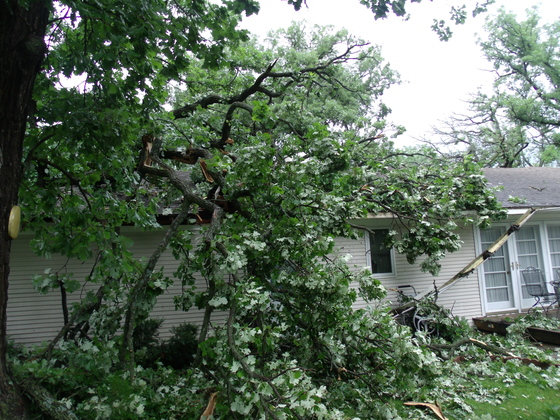
Once the hail core collapsed on the newly developed southwest complex before 1:00pm, it quickly transitioned into a wind threat in eastern Guthrie and Adair counties. Meanwhile, the first squall line caught up with this developing southern line and began to strengthen as well. It was here that the complex rolled through the Des Moines metro, with the strongest winds over Madison and Warren counties but there were sufficient winds to cause some tree damage throughout the metro. Once the line cleared the metro, it rapidly grew upscale into a powerful windstorm as it merged with the northern cell in Tama County. A potent bow echo developed at the merger point by the time the storms reached eastern Tama County and only continued to intensify as it rolled towards Cedar Rapids. Widespread winds of 70-80 kts were measured by the Des Moines WSR-88D radar over eastern Tama County, with similar winds extending southwestward along the line to northern Marion County. This line would accelerate and press eastward across the Mississippi River and reach Chicago by the late afternoon, leaving a trail of widespread wind damage in its wake.
 |
 |
 |
 |
 |
 |
 |
 |
 |
 |
 |
 |
 |
 |
 |
Tornadoes
A total of three tornadoes were confirmed to have touched down in central Iowa from this event, with one additional tornado reported in eastern Iowa. All three were relatively short-lived (less than 10 minutes). Two of the tornadoes were rated EF-1 and one was rated Ef-2.
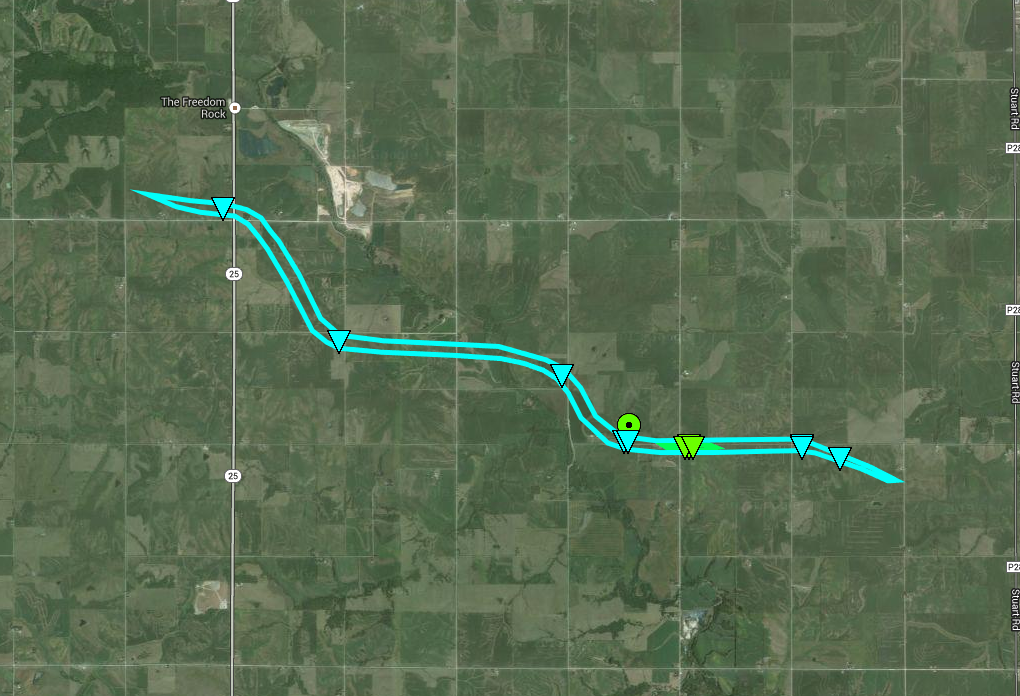
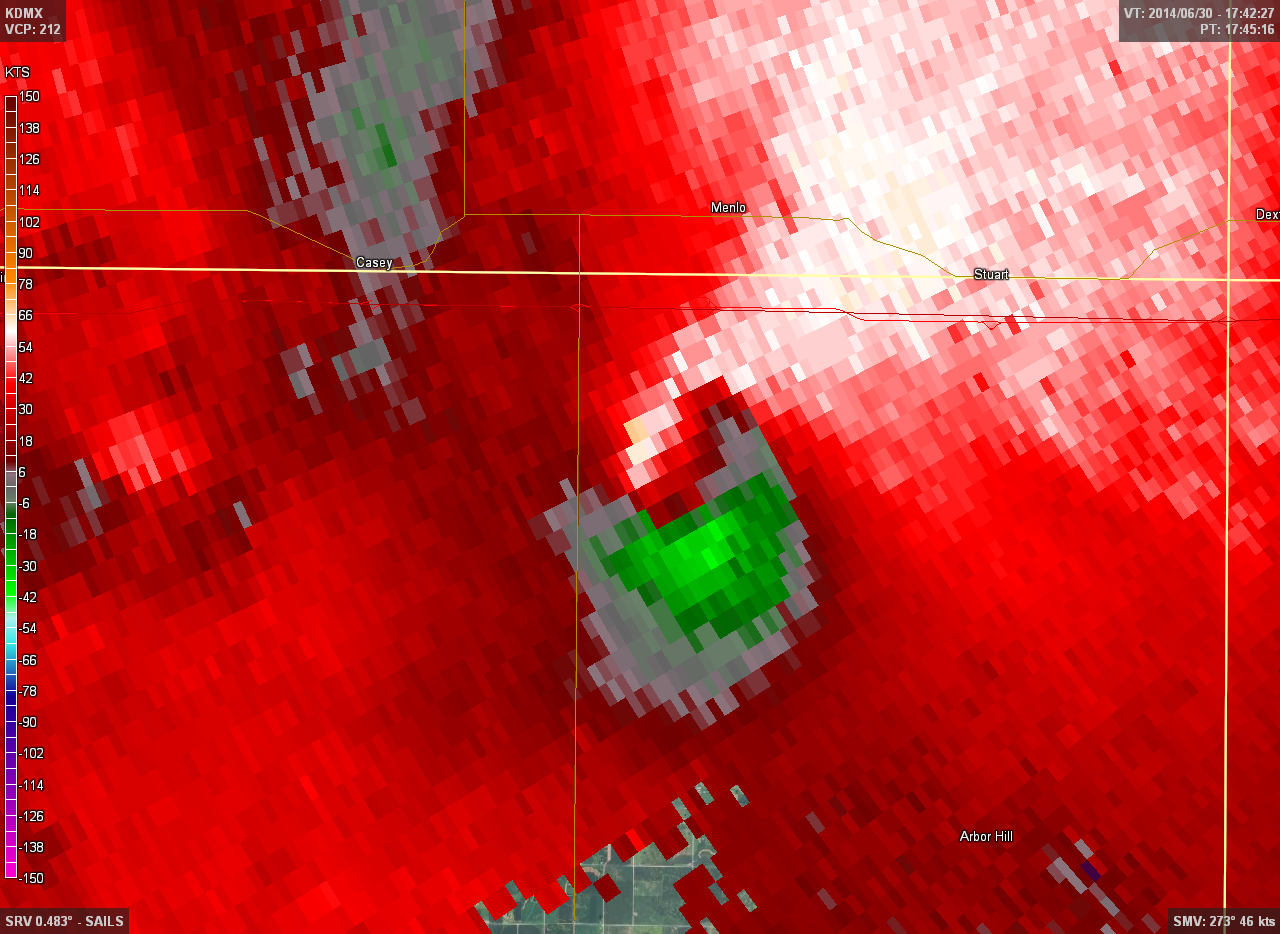
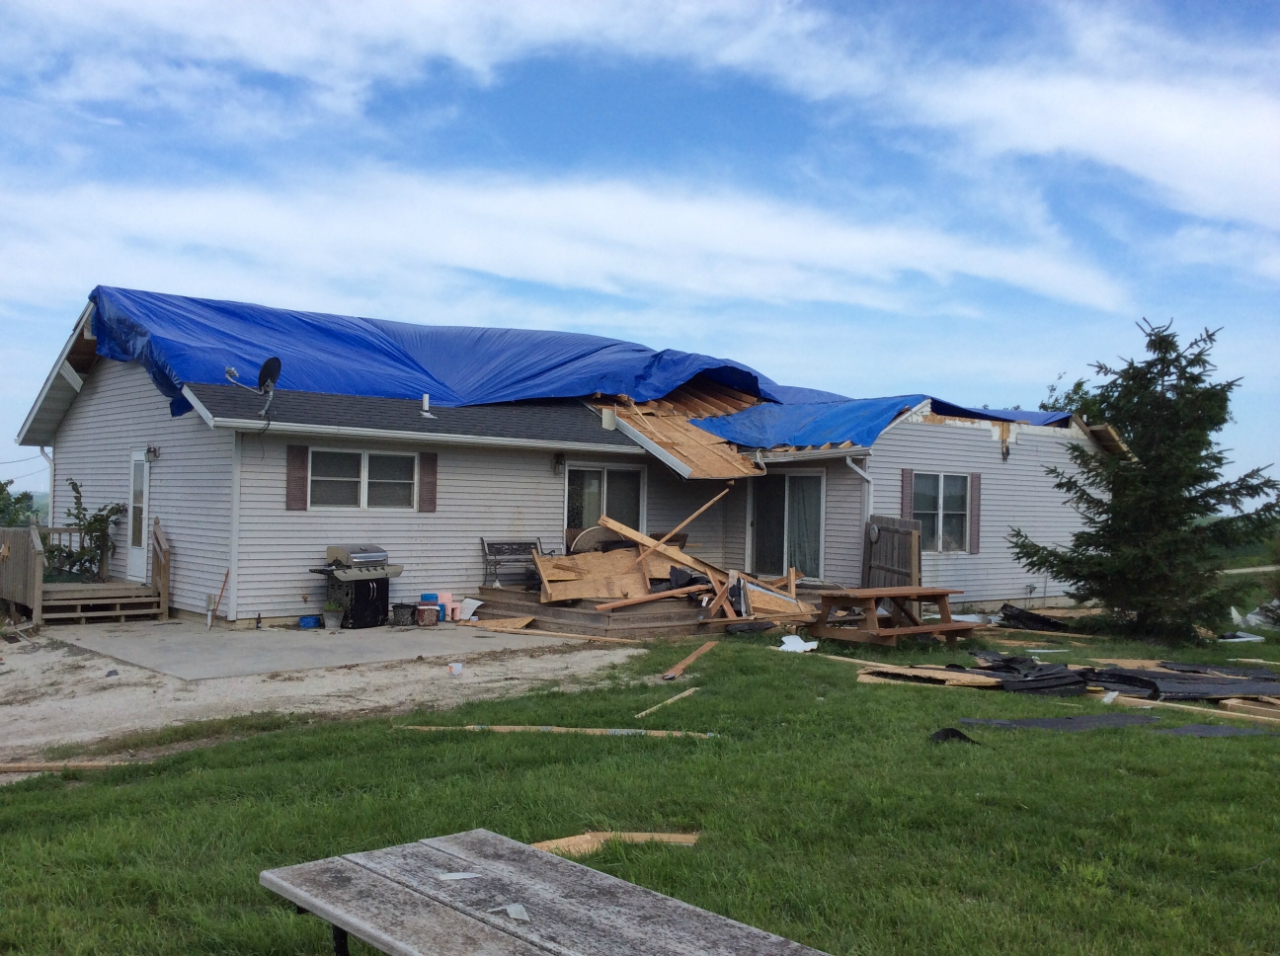
Tornado #1 Adair County
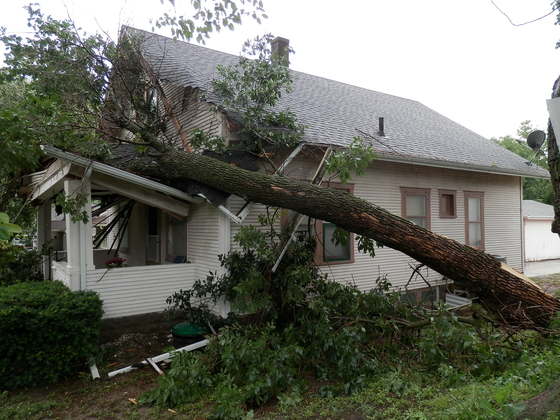
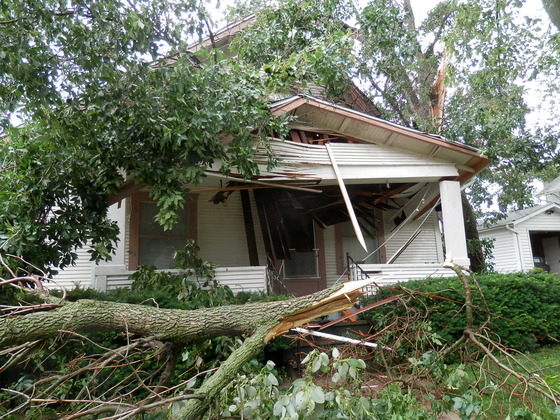
This tornado formed at 12:42pm 4 miles southeast of Casey and had an intermitient damage path for its first few miles over open country. It strengthened to an EF-1 tornado as it hit a farmstead and caused substantial damage to a house and destroyed several outbuildings. The tornado lifted at 12:50pm 5.4 miles southwest of Sturart.
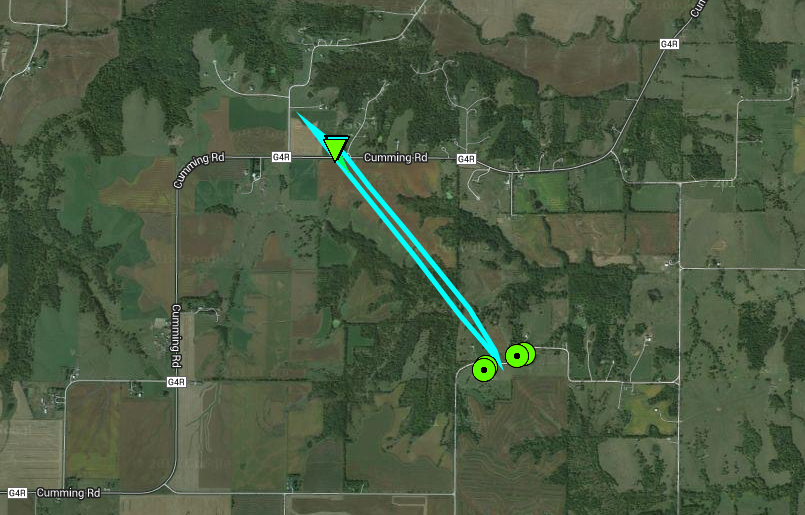
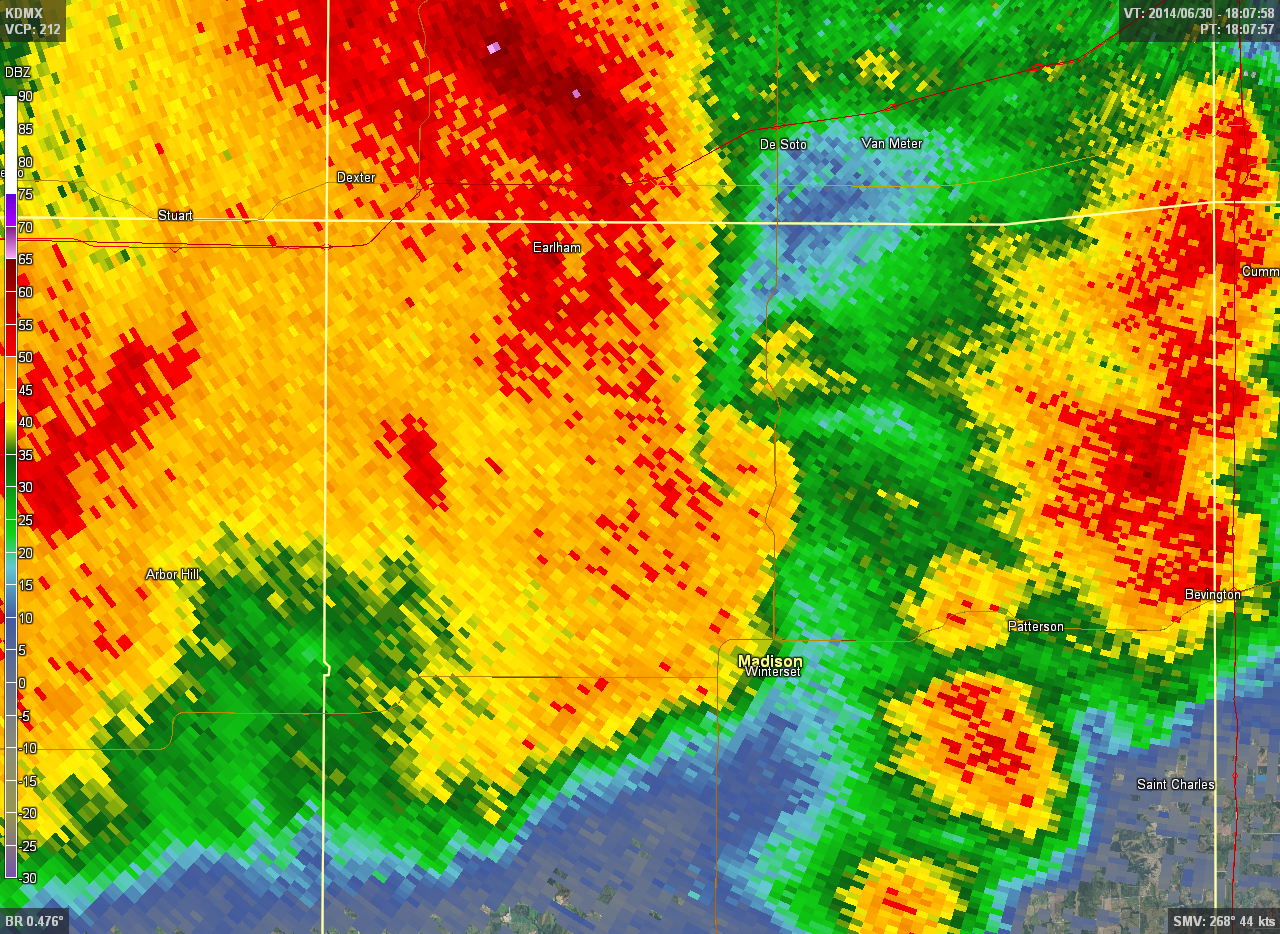
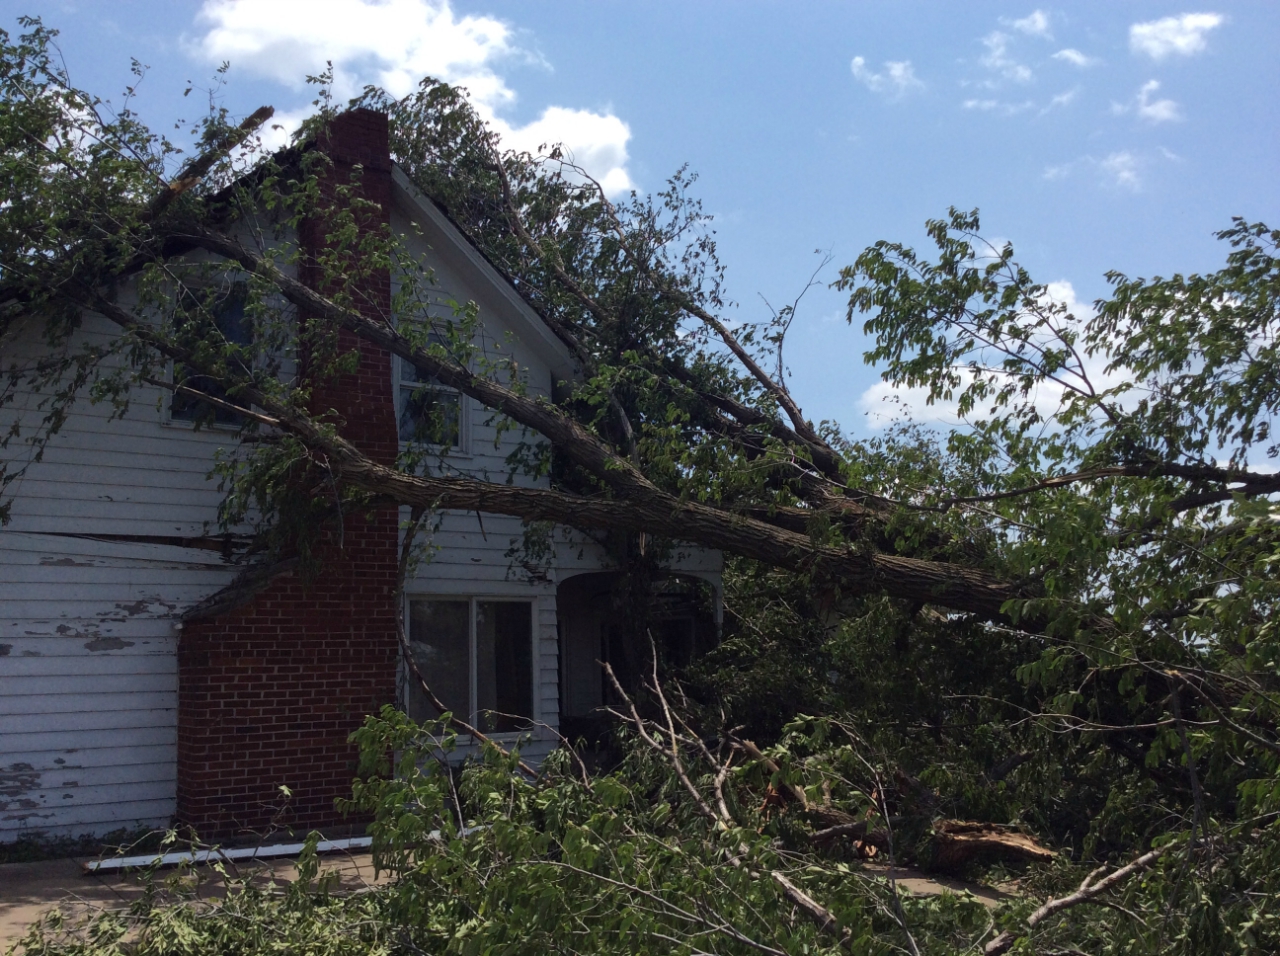
Tornado #2 Madison County
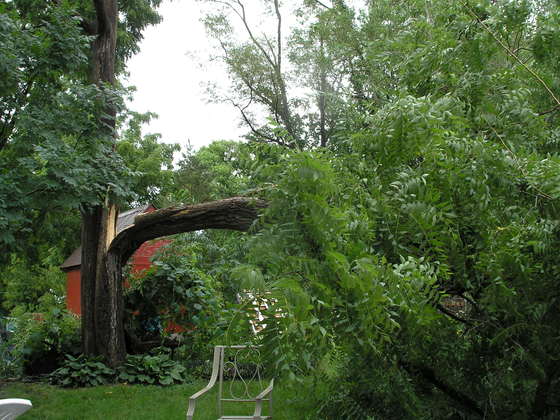
This brief tornado formed almost 6 miles northeast of Winterset and tracked southeast for just over a mile, damaging several trees and a house before it dissipated.
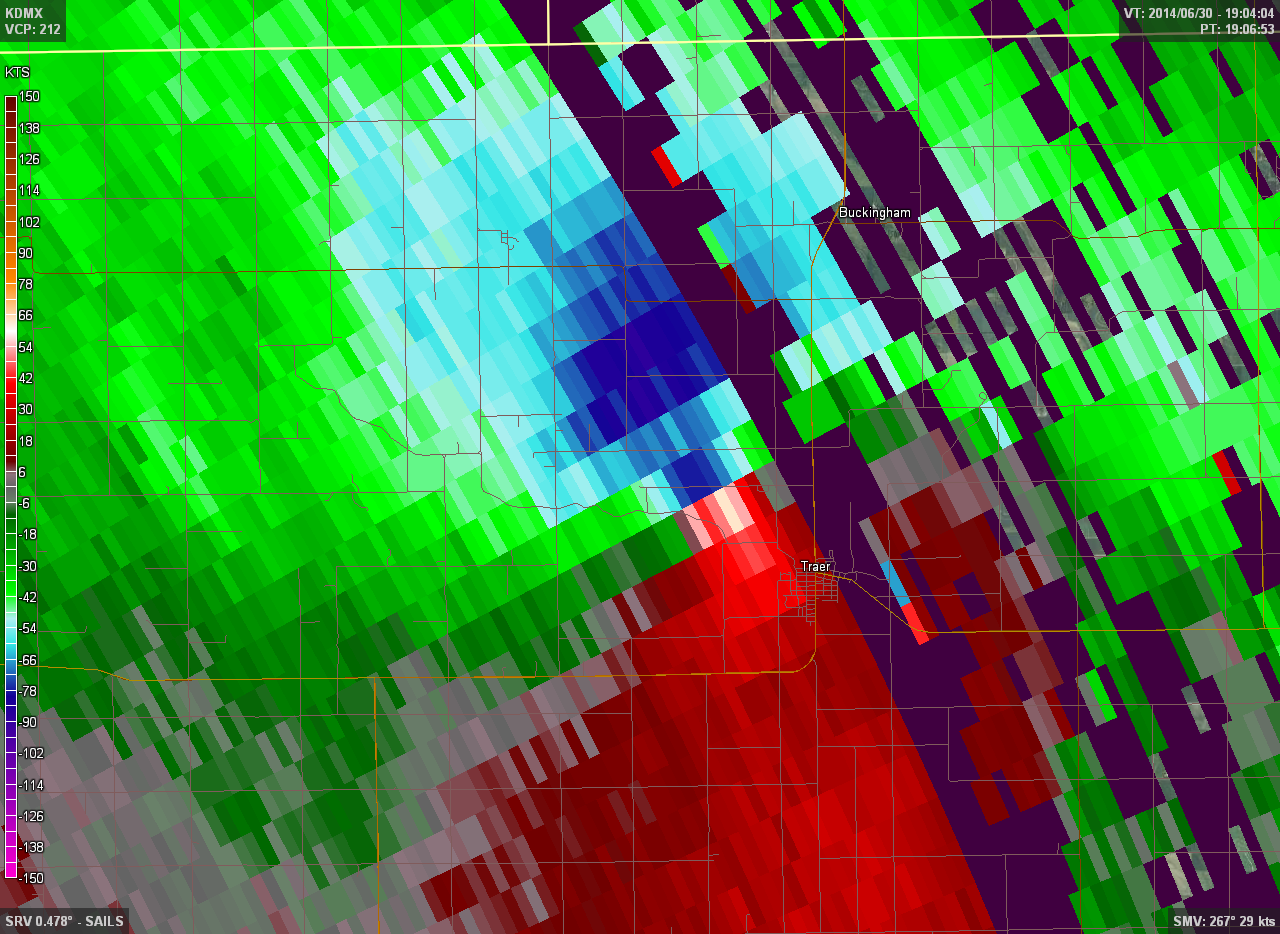
Tornado #3 Tama County
This tornado formed 4 miles northwest of Traer at 2:01pm and damaged several farmsteads before it tracked into the southwest side of Traer. It was here that the tornado was at its strongest and caused EF-2 damage to a house. The tornado weakened considerably as it moved through the southern side of town and dissipated on the southeast side of town at 2:10pm.
Flash Flooding
On top of the damaging winds, large hail, and tornadoes, these storms produced copious amounts of rain in a very short time span that simply could not be handled by the already saturated ground. Rainfall easily exceeded 2-3 inches per hour and many locations picked up 1-2 inches of rain in the first half hour of the event. The first round of excessive rainfall occurred as multiple rounds of storms tracked across Sac and Calhoun counties. The flash flood threat then shifted southward to two main swaths--one from northern Boone county to Black Hawk county, and another from Adair County eastward, through Des Moines, and through east central Iowa. A widespread 2-3 inches of rain fell in central Iowa with 3-5 inches common further east. A few spots even eclipsed the 6 inch mark for the day in east central Iowa (e.g. Iowa City). The resultant flash flooding washed out many roads and tragically led to one death in Cedar Rapids.
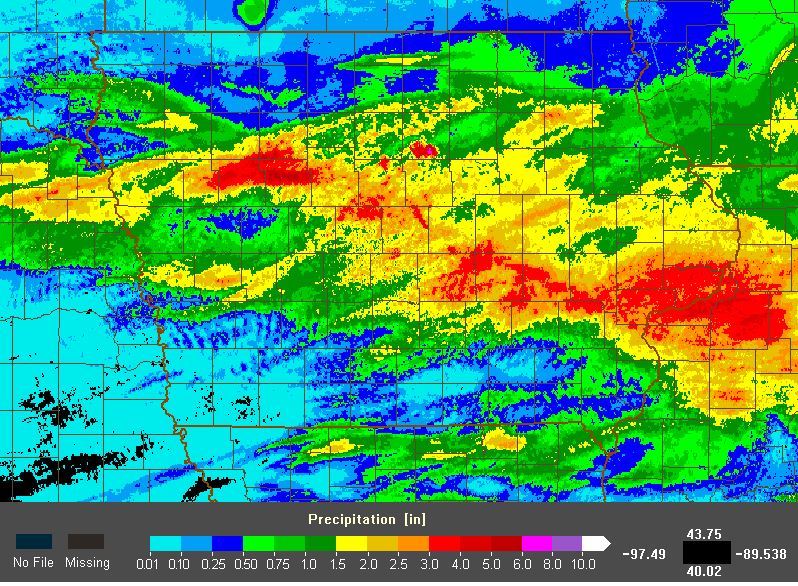
Rainfall Map for June 30, showing a widespread swath of 2-3 inches of rain with some locations approaching 6 inches.
 |
 |
 |
 |
 |
 |