The May 6, 2016 Event
By Aviva Braun
National Weather Service Boise, Idaho
Collaborators: Troy Lindquist, Stephen Parker, Josh Smith, Elizabeth Padian, and Korri Anderson
In early May 2016, an unseasonably large and deep upper-level closed low moved inland off of the California coast, passed to the south of the Boise CWA, and then continued east, wreaking havoc in the midwest. Along its journey, it affected the Boise region in a way rarely seen here with the threat of very heavy rain, strong winds, and possibly severe hail. SPC had the CWA under marginal risk, reinforcing our concerns for the afternoon and evening of May 6, 2016.
An “outbreak” of severe weather (this is a relative term here) was of great concern, as were flash floods. Additionally, with unseasonably deep snowpack and rivers and streams already running high in the Jarbidge and East Fork of the Bruneau River Basins, a small stream flood advisory was put in place for that basin. Details will soon be discussed, but first, let's look at the synoptic pattern.
Output between models looked quite similar for this event, so we’ll focus on the NAM. Variables displayed below are: 700-mb equivalent potential temperature, 500-mb heights, 700 mb wind, 700-500 mb RH and surface precipitation.
As the low passed to the south of the CWA, moisture moved over the region from the east, bringing PWAT values into the 90th percentile. These high PWAT values and the forecast instability and shear for the afternoon and evening had the office geared up for an active day of decision support and producing products in anticipation of the event.
Strongest CAPE and LI values were forecast over the region between 06/18Z and 07/00Z, with CAPE values reading between 100-500 J/kg. Variables displayed are: NAM surface computed CAPE and LI, as well as 500 mb heights.
The jet location (shown below) is another important factor in the synoptic setup, and helped produce the area’s heightened instability and shear. Variables displayed are: GFS 250 mb heights, and GFS 250 mb wind speeds. Note the jet max over the region near 70 kts. Shear seemed to be sufficient for organized storms to develop (we’ll see more detail of this in the skewTs to come).
The state of the atmosphere can best be summarized through skewT plots. Below is the May 6, 12Z sounding for Boise.
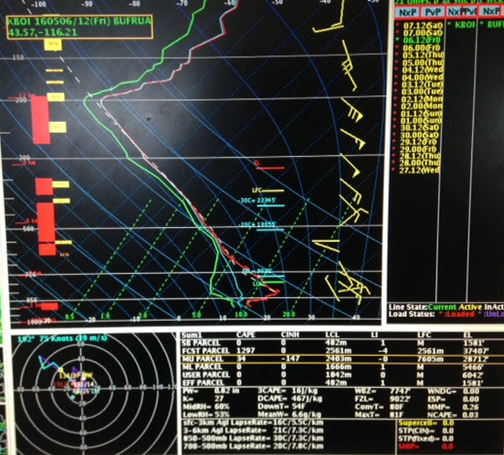
By May 7 at 00Z, the sounding looked like this:
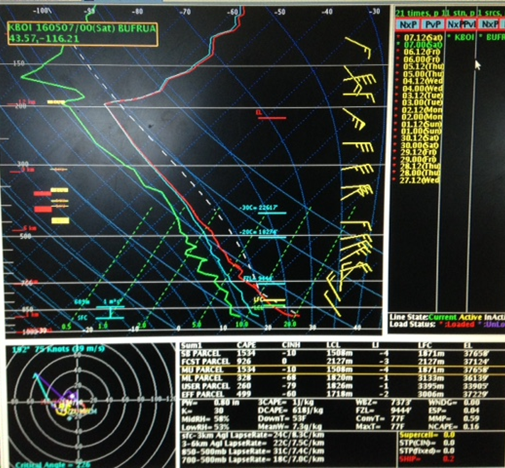
Instability had obviously risen, PWAT values were high and steady, and shear had increased through the 0-6 km layer.
Note that thunderstorms on May 5th associated with this system and atmospheric set-up had produced up to a half inch of rain in a short time period, which made flash flooding an impact worth monitoring.
A good way of showing the amount of activity we had that day, most of which occurred between 6 and 9 PM (00 and 03Z), is through composite reflectivity:
Water vapor imagery gives us a good idea of where storms formed - within cloud breaks. However, there weren’t that many of them!
A really good way of maintaining situational awareness through the event was through the MRMS -20C radar output and EET. This way we could see which storms were building vertically and were most likely to produce 1-inch hail. We had heard from SLC that they had received numerous reports of 1-inch hail with their storms that had passed through their region earlier. This loop goes from 13Z on the 6th through 06Z on the 7th.
Note the echo top heights of the cells on which SVRs were issued. Knowing that 1-inch hail had been reported on numerous occasions the same day, under the same environmental conditions in the SLC CWA, SVRs were deemed necessary on two separate cells.
Funny footnote: note the curved track of the storms that occurred around 21Z to 00Z. They came in from Elko’s region from the southeast and barely stayed in Owyhee County before recurving into Elko. The low’s placement is the obvious reason for this storm track.
Let’s move on to one hour precip amounts where we will get an idea of how much was dumped over the CWA, and illustrate why the initial small stream flood advisory was issued for the Jarbidge and East Fork of the Bruneau River Basins. It will also show the backbuilding that initiated the urban and small stream flood advisory over Ada County (first product over this area was an SPS, which was then upgraded to the advisory).
The 0.5 degree reflectivity gives a better look at the two advisories and the back-building that occurred over the Boise foothills, however, this doc cannot handle any more loops. Please let me know if you are interested in having this loop shared with you. Instead, here is an image produced for social media of the event:
Here is the Boise ASOS output for this period. Note the amount of rain received between approximately 7:30 pm and 7:49 pm MDT.
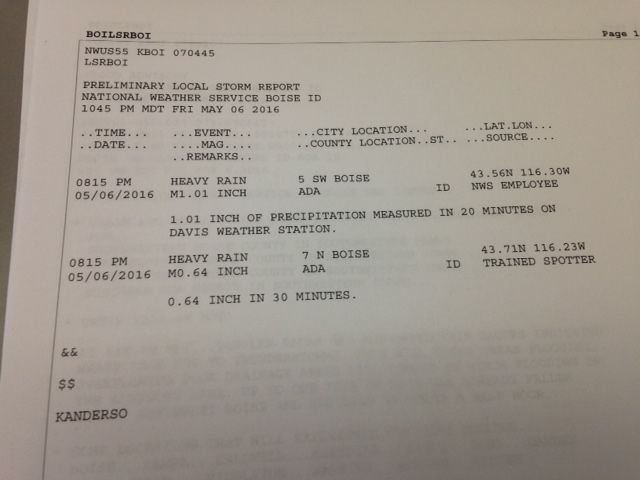
Below are the storm reports received. Very few were received, unfortunately. Korri’s CoCoRaHS rain gauge recorded 1.36”, while his Davis Weather Station reported 1.01” in 20 minutes during this storm (see below)! We did not receive any severe hail reports.
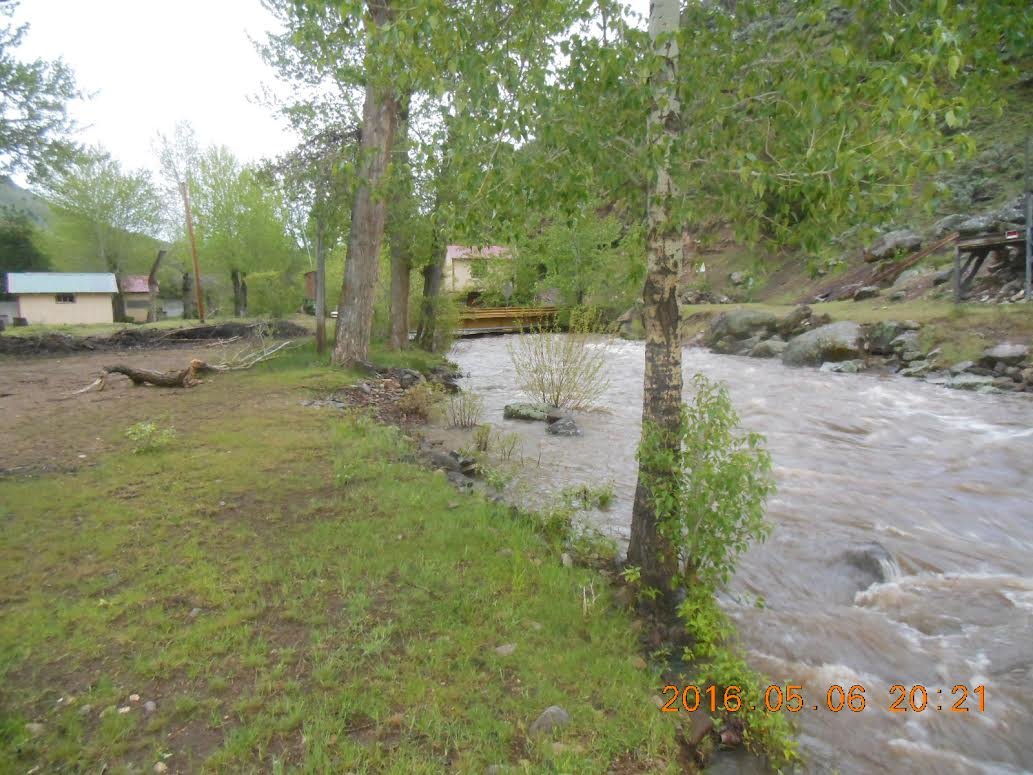
Now, lets discuss the small stream flood advisory issued for the Jarbidge and East Fork of the Bruneau River Basins. Our COOP observer in Murphy Hot Springs had been sending the office daily photos because of how high the waters were running and how much snowpack we knew to still be in the basin’s mountains.
This is an image from the morning of the event:
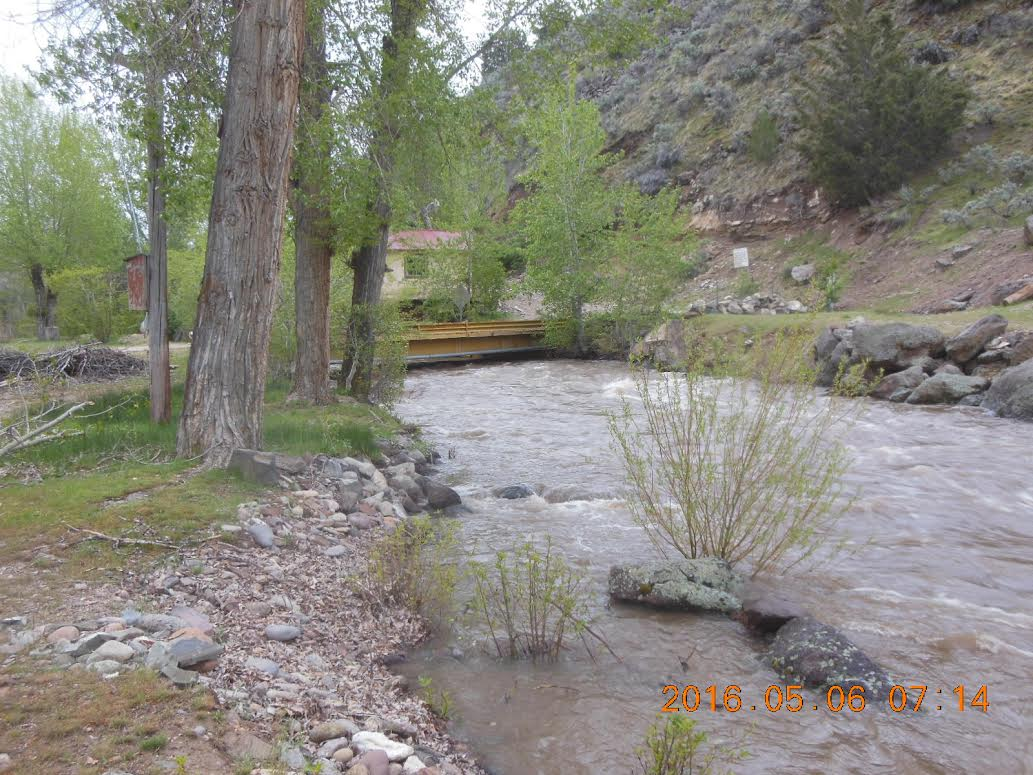
It is considered flooding when the stream reaches the bottom of the bridge.
These are pictures taken on the 7th. Water was running high but the heavy rainfall had not produced flooding.
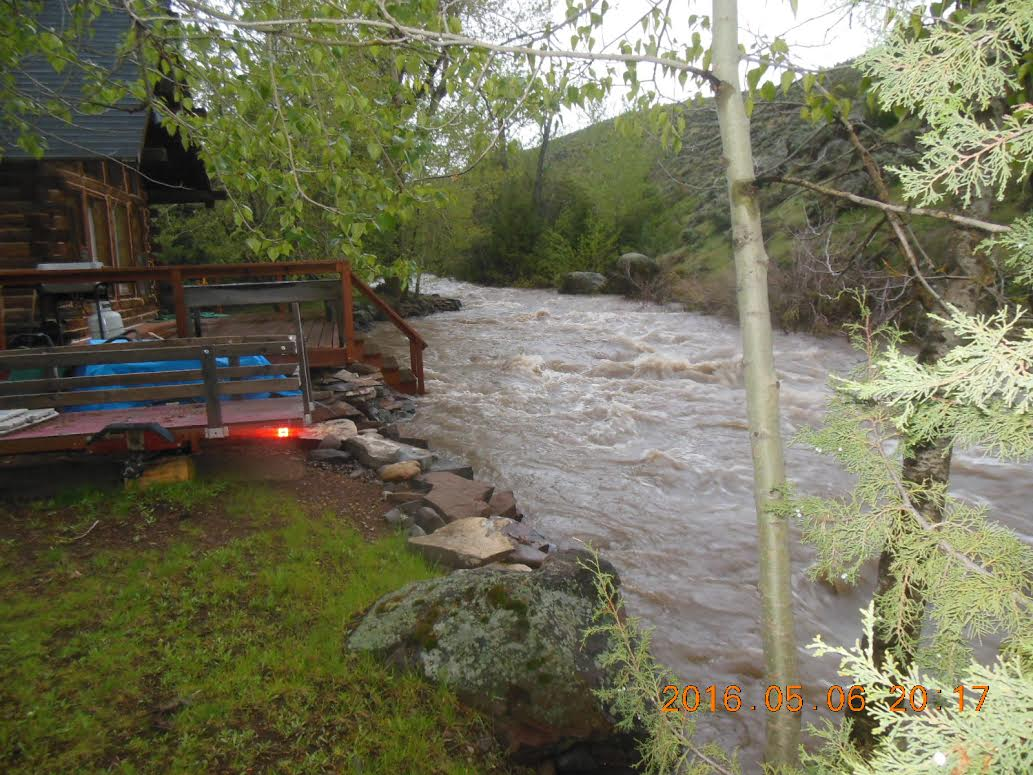
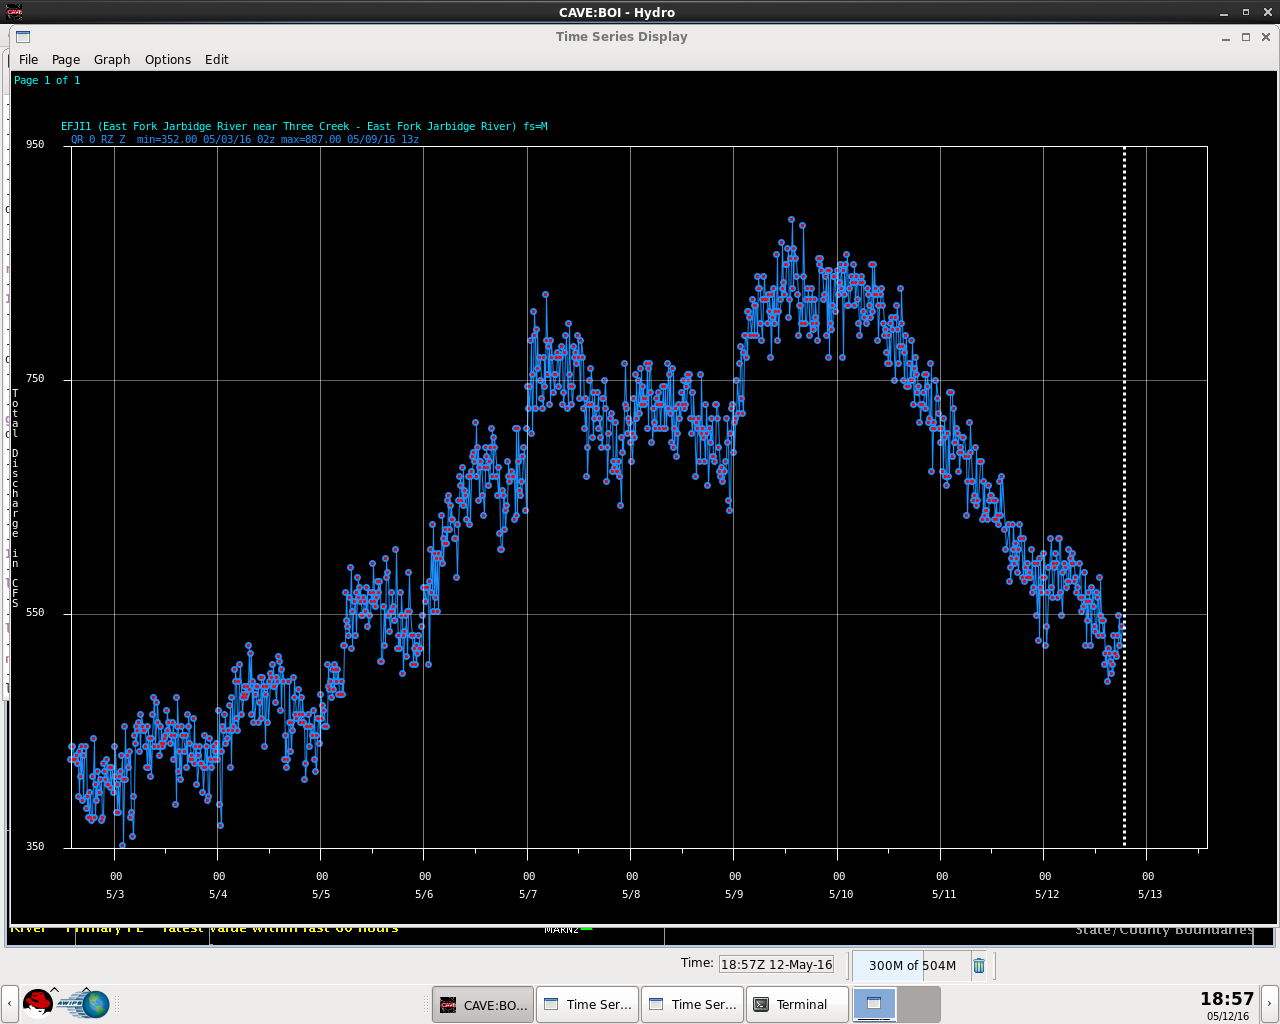
The Jarbidge River (EFJI1) time series stayed below the flood stage - which is estimated to be near 1000 cfs. This time series is out through the 13th to illustrate how much river flows have come down since this event.
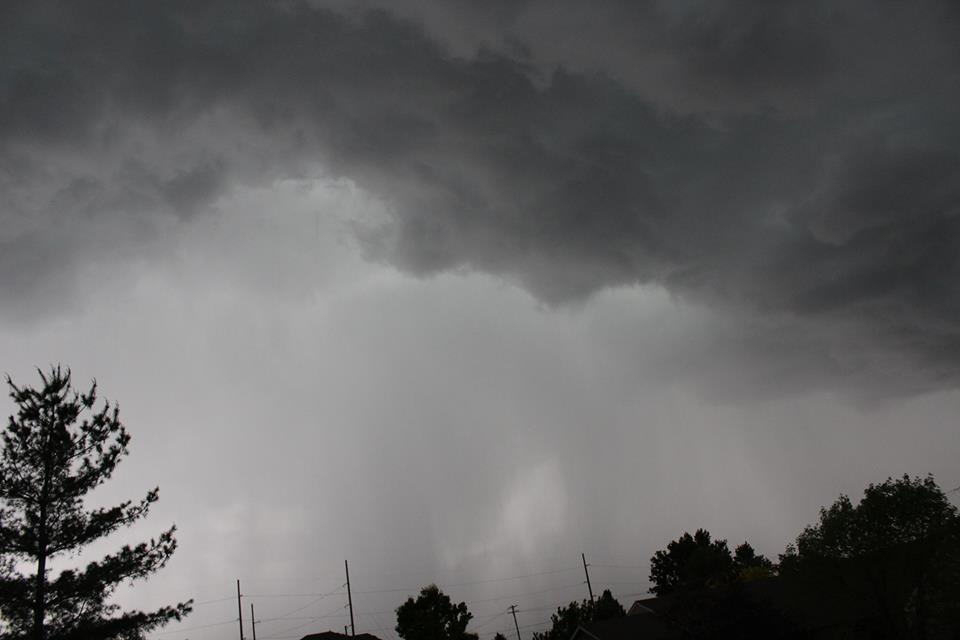
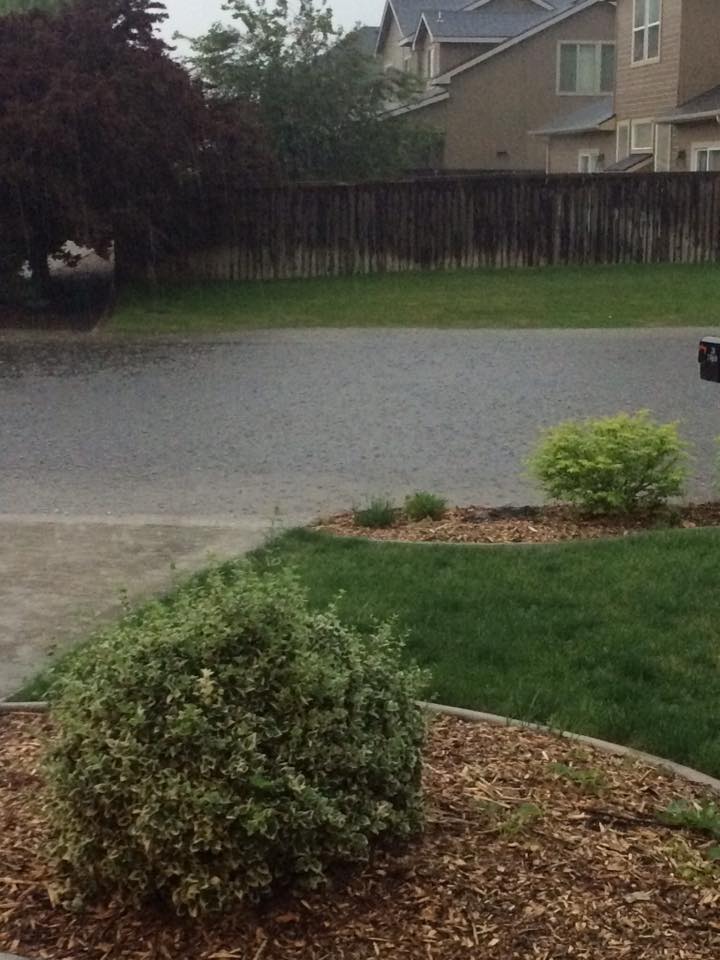
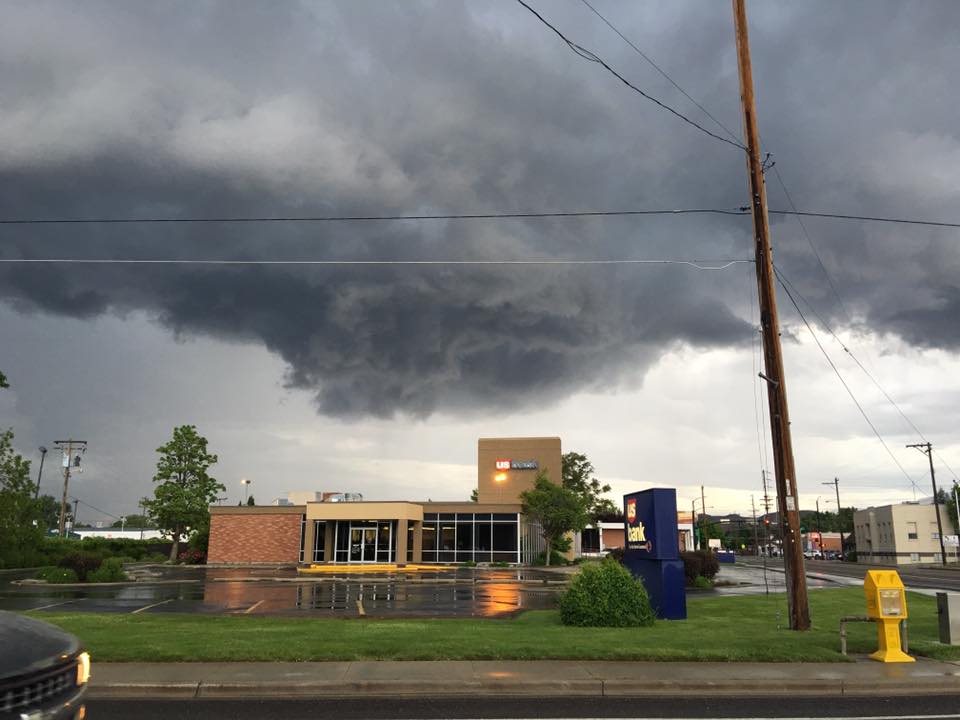
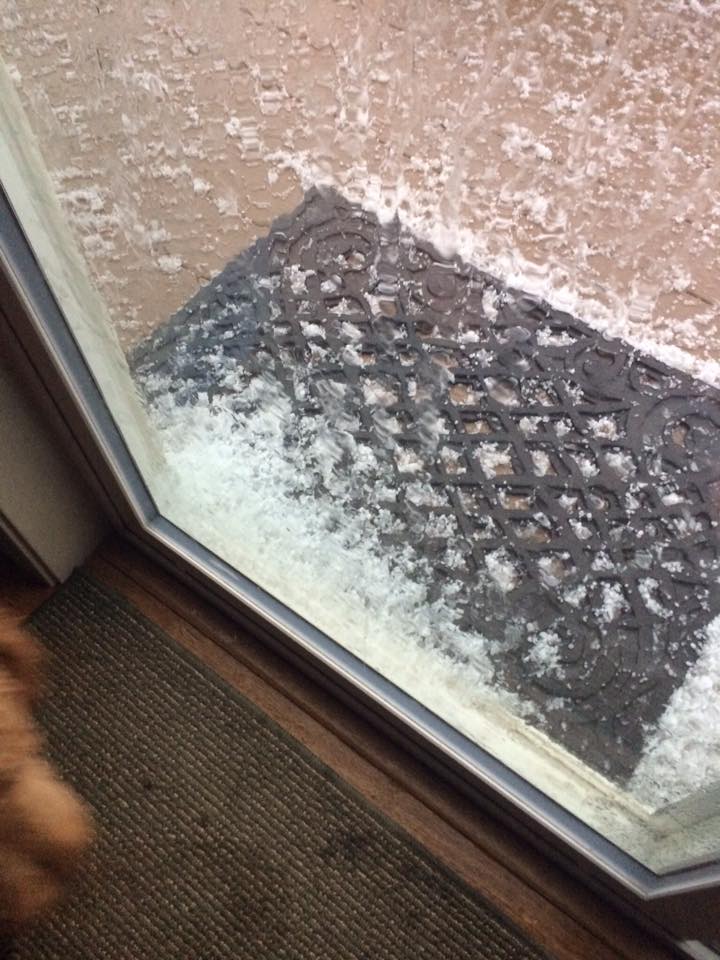
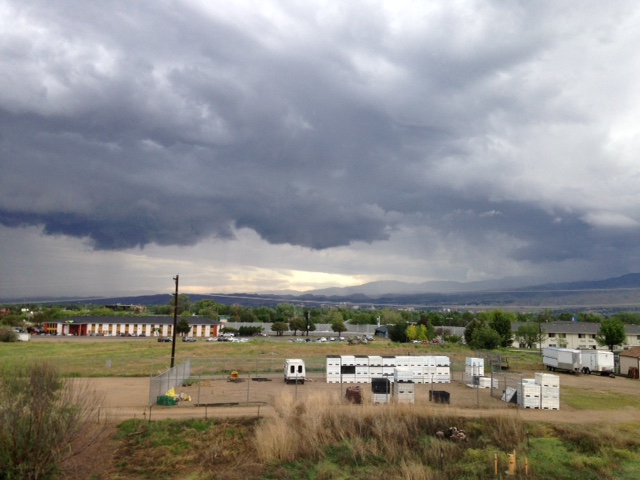
Some pictures from the event shared via social media or taken by your fellow NWS employees:
So, what can we learn from this event?
Convective parameters and pictures of high water made the office really excited about this event, and rightly so. It is great to have a good situational awareness cap on and to know what possibilities may arise in terms of impacts. However, this event did produce what we were anticipating, and while people stayed safe (with our help!), we may have cried wolf on a few of the products. We did know of severe hail occurring elsewhere during the same event and therefore it was still not a bad decision to come out with SVRs on the more likely storms displaying severe features. Flooding did, however, end up being a major player in this event. Advance notice of significant rain may have altered behavior and decision making and prevented actions that could have ended badly. Luckily, this doesn’t seem to have been an event that caused any injuries or damage.

