September 16th Bright-Banding Example
By Aviva Braun
National Weather Service Boise, Idaho
Collaborators: Stephen Parker, Josh Smith, Bill Wojcik
As we move into the winter months, it’s important to remember the subtleties of how winter weather affects what we see on radar. We overlooked one such subtlety on the 16th and thought that you all may want to get a refresher, as I have!
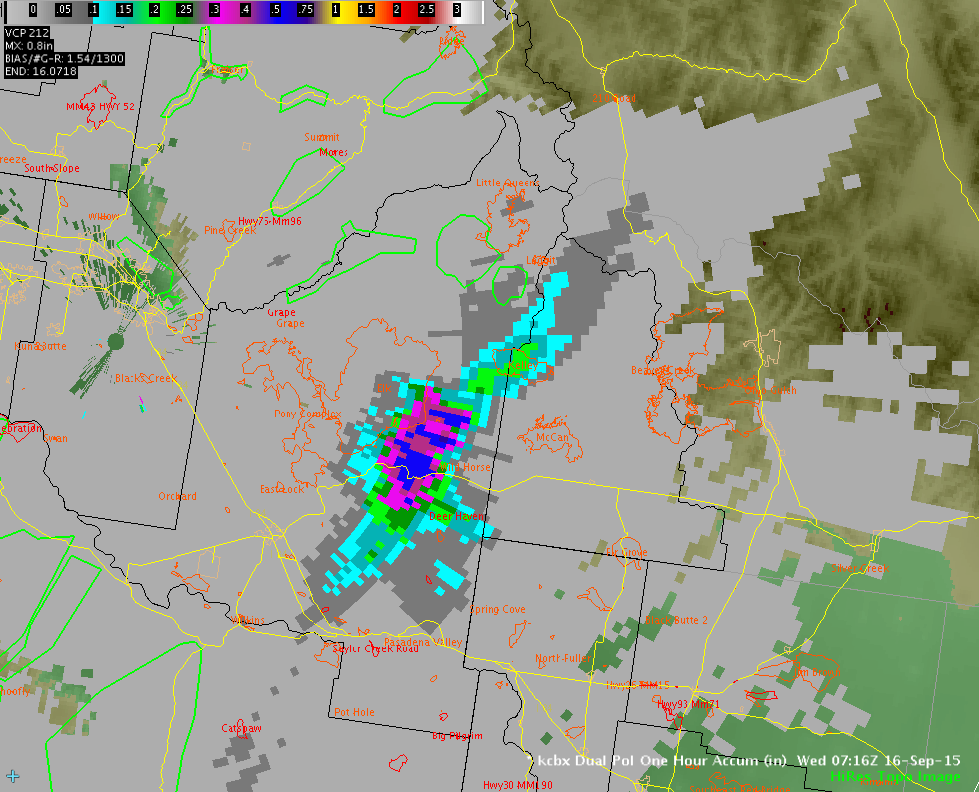
We were watching radar looking at Camas County and the band of high reflectivities headed towards them at the beginning of the loop. This is what we saw:
Maybe we were overly sensitive to the needs of Camas County having worked the flash flood event on August 26th, especially to the Kelley Fire scar, but they had received 2 days of rain at this point and we thought it wouldn’t take much precip falling at a faster rate to trigger another debris flow. Still, what should be noted is the storm-mode: non-convective - there likely wouldn’t be too much falling at a fast enough rate to cause this type of event to occur again.
When looking at the water vapor imagery, we can see that nothing looked to be slow-moving and convection was limited to mostly along the southern frontal boundary. In these cases, the only thing that can lead to heavy rain is persistent training of light to moderate rain, due to either orography or a boundary.
But in observing the OHP / 3 hr accum / STP / instantaneous precip loops, it seemed like there was a rain event we should be paying attention to. Notice that the STP loop indicated a max ~2 inches received, 0.7 inches over the Kelley scar (along the Camas/Elmore County border), most of this falling within this event. However, the antecedent conditions had been wet for the previous two days; this was a factor in our decision to warn that night.
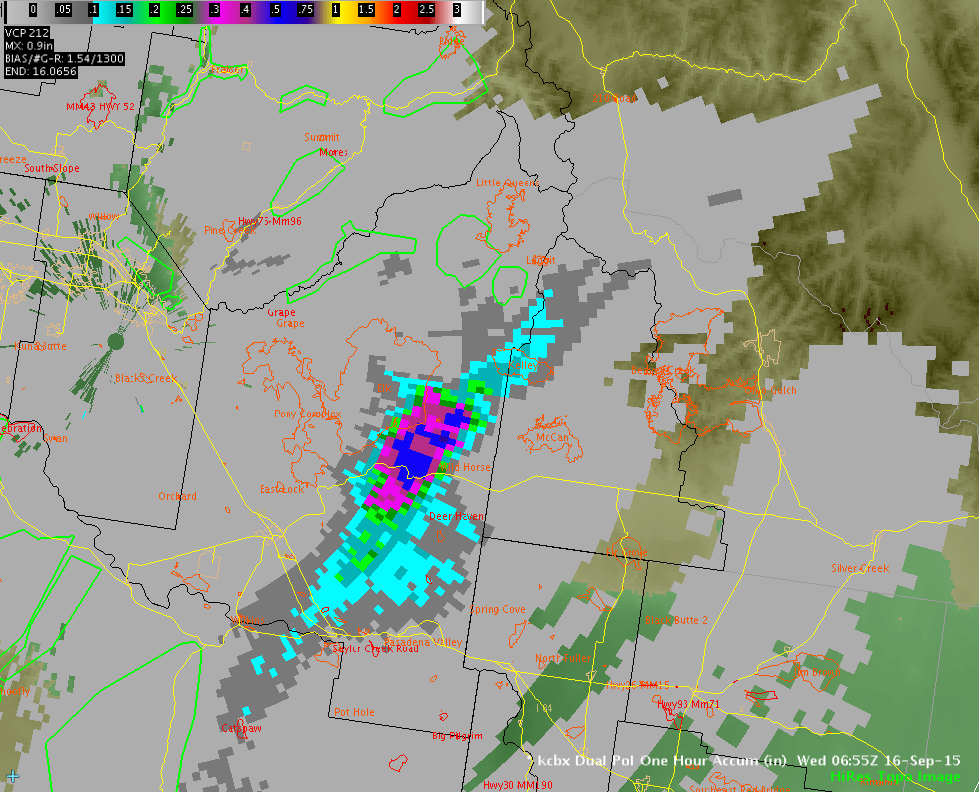
Let’s look at two OHP snapshots:
The first is for 0655Z. The max precipitation amount on the Kelley Fire was 0.2 inches, but the max amount being recorded not too far away from Kelley was 0.9 inches.
At 0716Z, radar had an estimated 0.2-0.3 inches of precip over the Kelley scar. We decided we should not halve the radar amounts due to beam blockage and the relative accuracy of the precip recorded during the Aug 26th flash flood event. The beam blockage is actually really obvious on the reflectivity loop on page 1 - look for a line of increased Z between Featherville and Pine in Elmore County.
Based on these precip rates and the amount of rain we knew to have fallen over the previous 48 hours, the following FFWs were issued and posted to social media (note that there are two green boxes drawn):
But let's think back to what the likely storm-mode was and take a look at the most recent skew-T at the time:
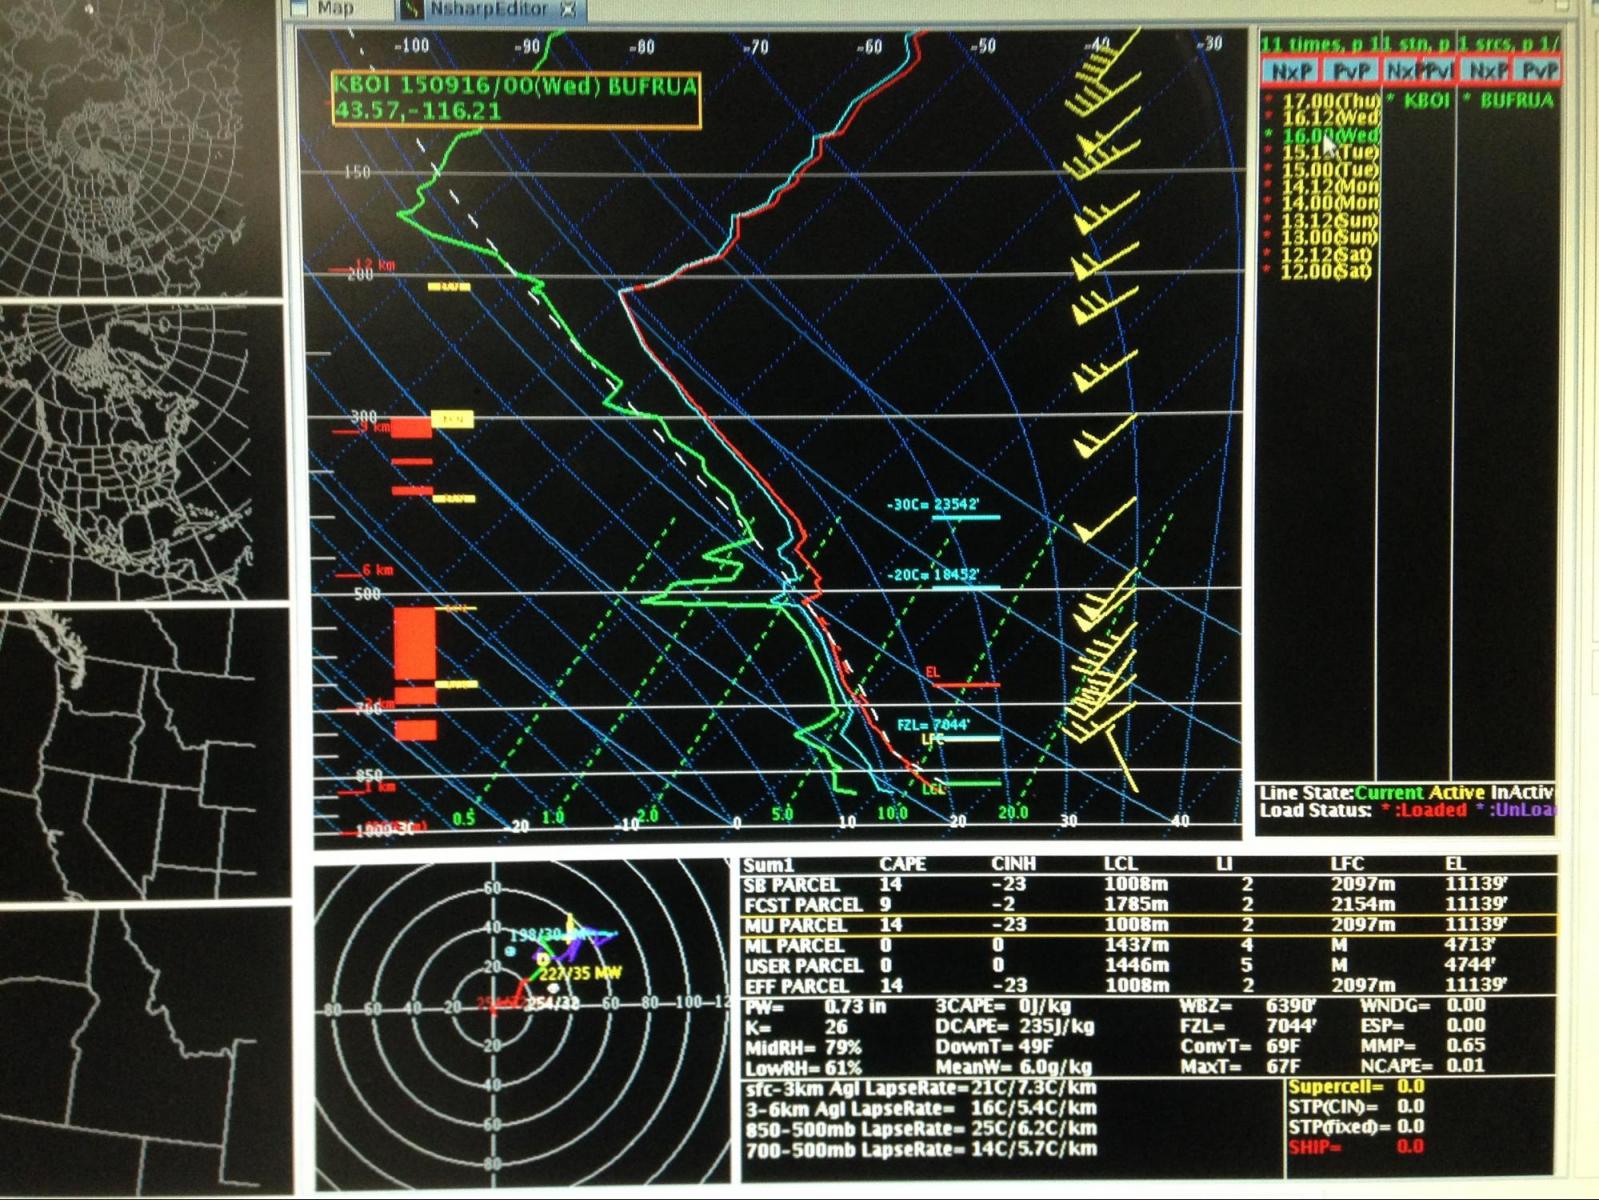
CIN was greater than CAPE, winds were not weak and there was a 700-500 mb moist layer. This skew-T indicates a wet, but non-convective event. Also note that the freezing level is at 7044’ and that there is a cap at about 500 mb.
Let’s go back at look at the radar loops with the melting layer algorithm plotted as well. This is the 0.9 degree angle:
There are a couple of things going on here. First off, the brightest Z values are within the melting layer and there seems to be another area of high Z values equidistant from the radar on the opposite side (a bright-banding indicator). Bright-banding usually comes in the form of an arc, however, it’s possible that beam-blockage prevented this phenomenon (beam-blockage is more obvious here in the reflectivity panel than on page 1). Continuing on with the line of high reflectivities SW of Camas, KDP values were <1 º/km, indicating that it probably wasn’t rain that the radar was seeing, and CC was ≤ 0.95, indicating complex shapes / a mixed phase event. I don’t have HC plotted here, but it was indicating a graupel and wet snow event.
Some other important information:
Cloud tops were on the 4.0º tilt. 1664 ft AGL, 21783 ft MSL. These are low.
The numbers above correlate with what the Enhanced Echo Tops were indicating: ~21 kft MSL.
There were reports of snow the next day (see social media post below)!
Also worth mentioning is the convection we saw earlier at Jerome that night. If you can recall from the IR loop (page 2), we were seeing some convection along the southern frontal boundary. Jerome ended up recording 0.09 inches per thunderstorm (see figure below) between 3-6Z. If this was the highest rainfall rate that convection was producing in this environment, it was unlikely that a non-convective event could produce a higher rate. This convection is also captured on the OHP loop on page 3.
Lessons learned: Winter is coming, so watch out for the associated winter radar nuances! However, the FFWs issued may not have been the worst of calls because it had rained over the previous two days, we did in fact receive a considerable amount of rain over that area that night (see figure below), and this is a sensitive area within our CWA.
See the Fleck Summit Obs site below. Fleck Summit is located to the NE of the Kelley Fire scar.
Precip that accumulated there during the 6-9Z period was about 0.5 inches. A rainfall amount of 0.24 inches was received between 0639Z and 0739Z (the largest amount received in one hour throughout the period). This was too slow a rate for a flash flood event to take place.

