October 19, 2015 Heavy Rain Event
By Aviva Braun
Collaborators: Troy Lindquist, Josh Smith, and Les Colin
On October 19th, a closed low passed over our CWA dumping a lot of rain before it moved out of the region. It seems like we didn’t truly expect the amounts produced, or the longevity of the event. I’d like to look back at the event and discuss the damage reported after it was over.
Let’s begin by looking at the storm totals:
This was quite an event! So what factors produced this amount of precip?
The main factors to discuss are the day’s PW values and the track and speed at which the low moved. We had expected the low to move east a bit faster than it did. On the morning of the 19th, instead of the closed low being centered over SW Idaho (with most of its impacts expected there) and on its way out, the low had moved farther west than we had expected, slowed, and was centered over our CWA for quite some time.
Let’s take a look at a model blend of the PoP forecast for the 19th between 00Z and 12Z. The models used in this blend are the NAM, the GFS, the SREF, and the ECMWF. The first frame is for 72 hours out. There are 6 frames, each is 12 hours closer to the event. The last frame is for 12 hours prior to the event.
There was obviously some uncertainty about what the closed low would do in the model outputs. But as we approached the event date, the model blend seemed to identify the areas of greatest precipitation. As an office, we had thought on the 18th that the area of concern would be southern SW Idaho due to a wider model consensus. This may have been a good time to issue a hydrologic outlook (BOIESFBOI). Although there was uncertainty in timing, location and amounts, it would have provided a heads-up for potential flooding in the general area.
I’ve saved a four-panel of model 500-mb heights, 700 mb wind, 700-500 mb RH and surface precipitation. Model output spans the 19.00Z - 21.00Z timeframe. The top left is the GFS, top right is the ECMWF, bottom left is the SREF, and the bottom right is the NAM. This is output from the 19.12Z run (if there is a way of retrieving previous model runs, I have yet to figure it out!).
At this point (mid-event), the models had a pretty good idea of how the atmosphere would behave, but the NAM pinpointed the problem area and timing the best.
Let’s take a look at a few of the satellite images. The first IR image is for 10.18.17Z - 10.19.17Z; the second is for 10.19.15Z - 10.20.15Z. The time breaks are the same for the WV imagery:
The closed low takes a northerly track into the CWA, treks west, and then slowly moves east and out of the region as the upper level closed low reforms over the SWern states.
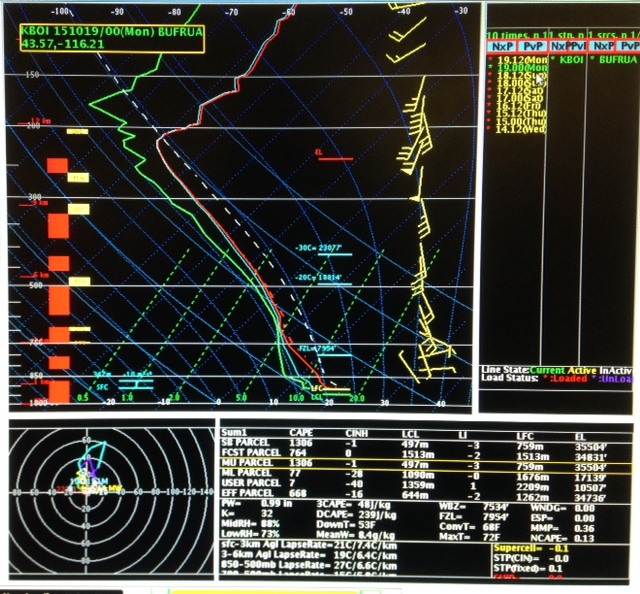
The 19.00Z skew-t is notable for its PW, strong CAPE and LI values, and its light transport winds (which is an indication of slow storm motion). This flight occurred around the event’s onset.
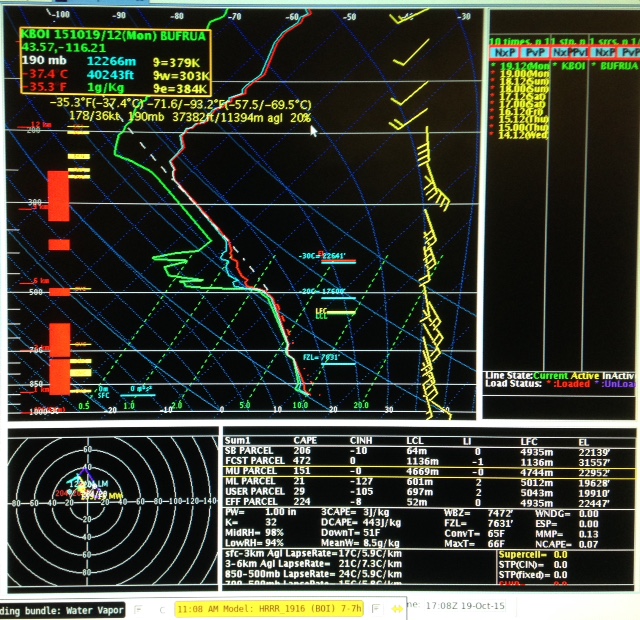
By the 19.12Z skew-t, the mid atmosphere was beginning to dry, though the PW was still high. The winds had picked up, and the airmass was becoming more stable. These PWs were above the 90th percentile and near the daily max according the SPC sounding climatology.
The next several frames will show the progression of the system in the composite reflectivity and OHP. The first two frames are between 18.21Z-19.17Z; the second two frames are between 19.19Z-20.15Z:
The event had gone on for quite some time before we issued a flood advisory.
The radar was indicating some very high precip rates that later verified.
Let’s move on to the next period:
The advisory was originally issued to 2 PM/20Z, but then was extended for another 4 hours to 6 PM/00Z.
Most of the precipitation fell between 19.00Z and 20.00Z (grids in 12 hour segments):
with minimal estimated amounts accumulating before and after this period.
Let’s take a look at a few surface observations. This first observation was from the Owyhee Ridge site in Malheur County. OWFO3 had been receiving precip for a while, however, between 09Z and 13Z, this location was receiving between 0.20-0.30 inches per hour. Between 13Z and 22Z the site was receiving 0.10-0.15 inches per hour.
Below are a few observed storm totals from various sites. BOI423 is essentially Owyhee County. BOI637 is essentially Malheur County. While Malheur received the greatest amounts, we received damage reports from both Malheur and Owyhee Counties. The flashy areas and burn scars in Owyhee County likely played a role in the large number of damage reports received there.
Succor Creek (runs through Malheur and Owyhee County) peaked around 04Z/10PM on the 19th near Homedale. Note the significant lag-time in runoff compared to when the heaviest rainfall occurred. Our advisory expired at 00Z/6PM, but the small stream response continued well afterwards (peaking at 04Z/10PM). Runoff lag-time is something to keep in mind when deciding the expiration time for flood related products.
What kind of damage reports did we receive from this event?
In Malheur County, the EM reported that “there was a road washed out in a couple of places. The road to Leslie Gulch washed out on Monday, causing the BLM and Sheriff’s Office to respond to check on some campers in that area on Tuesday. They were able to get equipment down there and got the campers out okay.”
In Owyhee County, the EM reported that there was flooding near Givens Hot Springs (due south of Caldwell) around daybreak. There was also a report of a judge driving through what looked like standing water, also at daybreak, losing traction, and being carried (a bit) down the road before regaining traction. The picture below is of an occurrence in the Hardtrigger Creek drainage which is SSW of Givens, according to the EM.

So, what can we learn from this event?
There are a few factors we could have been looking out for ahead of the event. The PWs, indication of slow storm motion, and model output of the closed low’s odd trajectory, all suggested that this event would be a slow, heavy rain producer over sensitive areas (flash flood prone areas and recent burn scar, noted on AWIPS overlays).
Advance notice of a significant rain event may have altered behavior and decision making of those impacted. Those leaving for work that morning may have been more careful, or even have waited it out, and campers may have packed up early or stayed home. Luckily, damage was limited and no lives were lost.