November 25, 2015 Winter Storm
By Aviva Braun
Collaborators: Bill Wojcik, Chuck Redman, Josh Smith, Les Colin, and Korri Anderson
On November 25, 2015, an upper level closed low moved from Southeast Oregon, into Northern Nevada, then recurved toward the Twin Falls area. Closed lows have a tendency to change course over a given forecast period and can be tricky to predict; even a 50 mile difference in the storm track could produce huge differences in the forecast! The big concern was of course, Thanksgiving travel.
Our neighboring offices wanted to advertize this storm system early (about a week out), warning of difficult travel conditions for the Thanksgiving Holiday. Our office was more reluctant to go the distance so early in the forecast since the low could move much farther south that models were predicting a week out. What the models first indicated as moving almost across the Treasure Valley, ended up moving just south of the ID/NV border. In the end, it was a good decision to hold off on early travel hazard posts.
Here is a brief look at the aftermath over the region and in the Boise area:
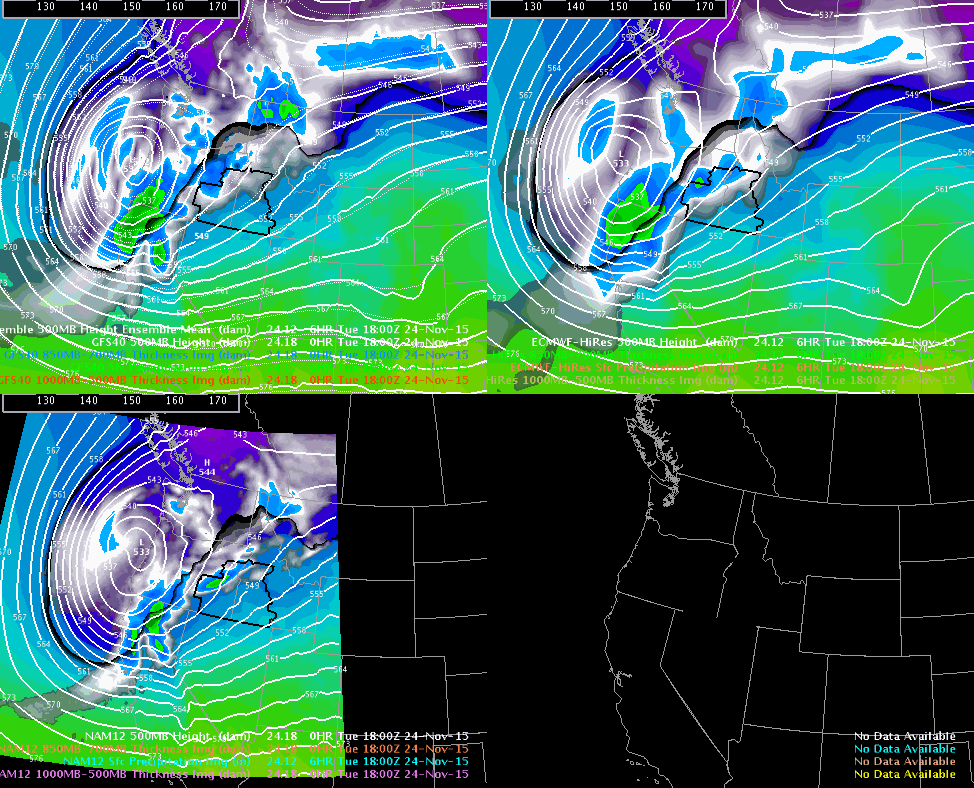
Let’s begin the discussion with the 18Z model run on the 24th to get a big picture of the event. The variables displayed are: 700-mb equivalent potential temperature, 500-mb heights, 700 mb wind, 700-500 mb RH and surface precipitation. The quadrants are as follows: top left - GFS, top right - ECMWF, bottom right - NAM, bottom left - SREF.
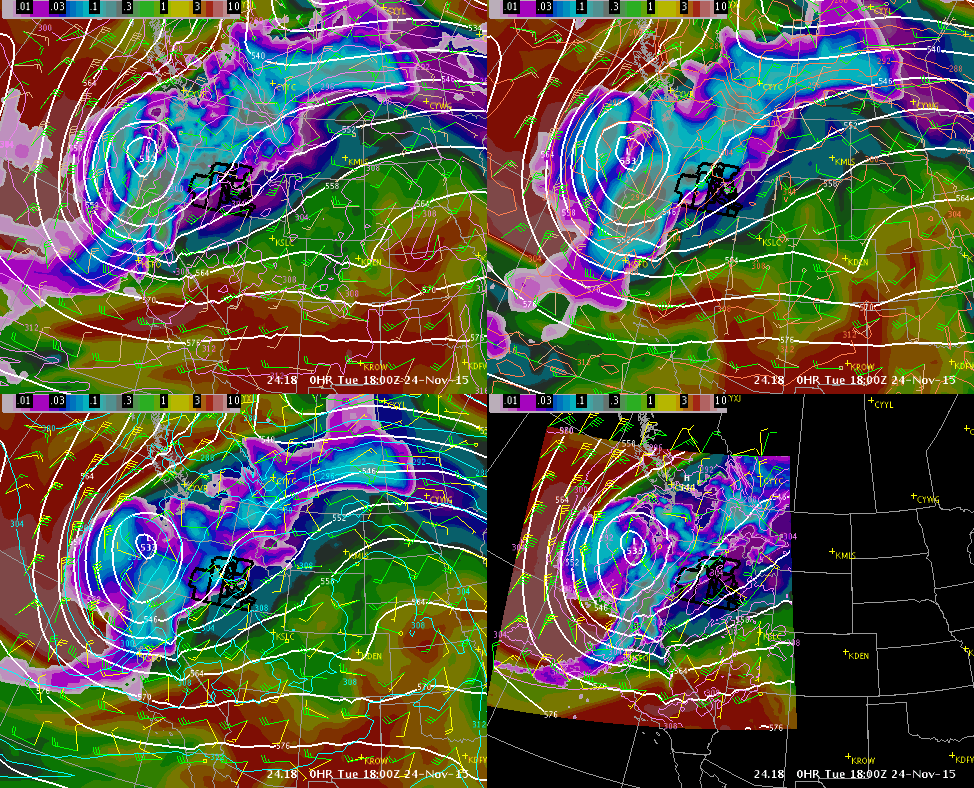
And again for a close-up:
Note where the deformation zone is throughout the loop (area of tightly packed equivalent potential temperature isopleths). This will be the area of heaviest precipitation, and the wind boundary.
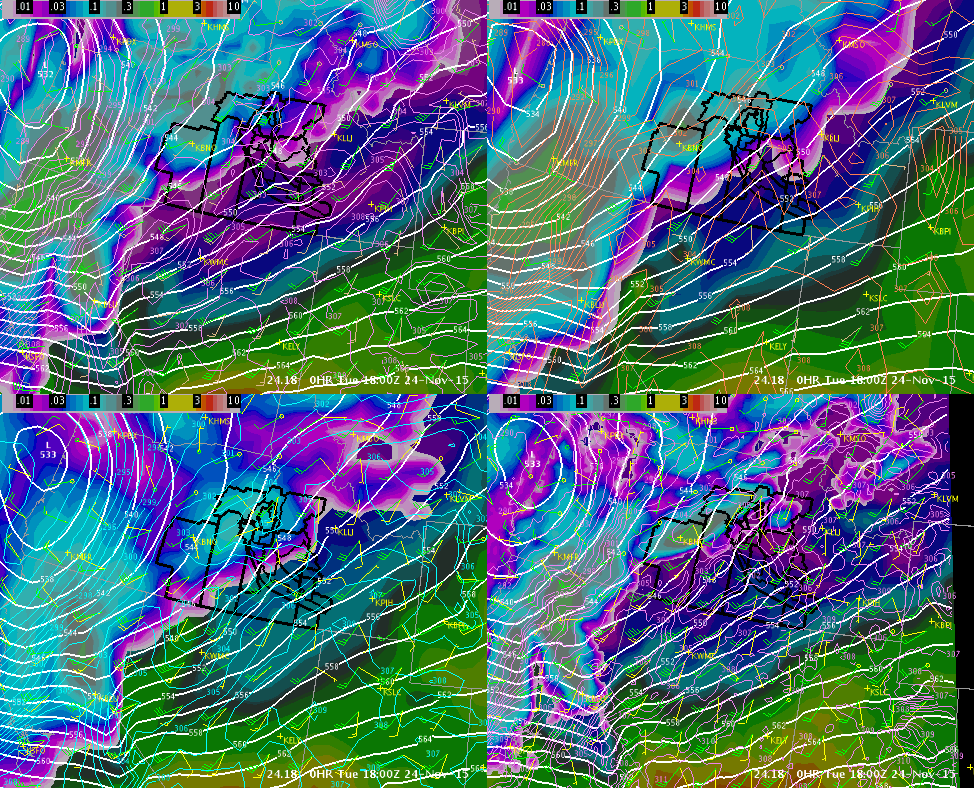
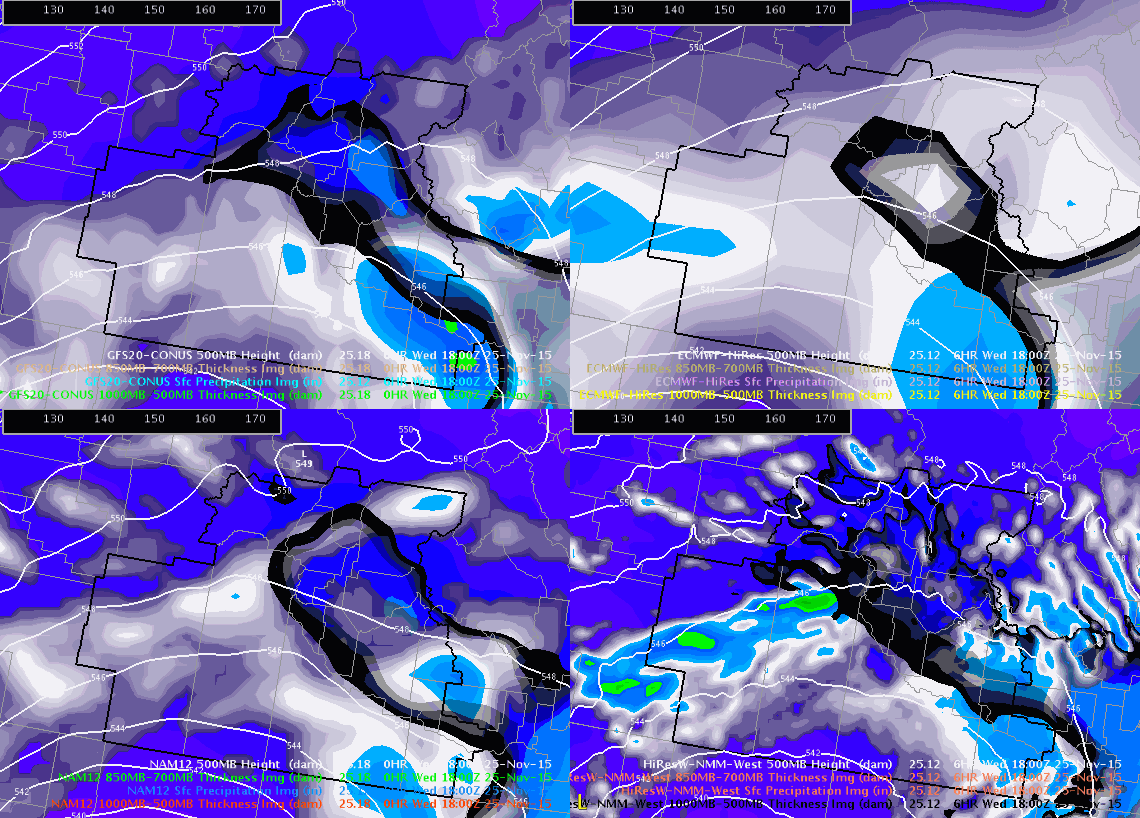
One of the aspects of the storm that we were struggling with was what type of precipitation would fall. The following model output depicts the snow level (using 850-700 mb thickness of 1525 m) embedded into the procedure. These are the model runs on the 24th: top left - GFS 18Z, top right - ECMWF 12Z, and bottom left - NAM 18Z. Variables displayed are: 500-mb height, 850-700 mb thickness, surface precipitation, and 1000-500 mb thickness. This model run shows all the models in pretty close agreement, but the previous model runs (not shown) were not as favorable.
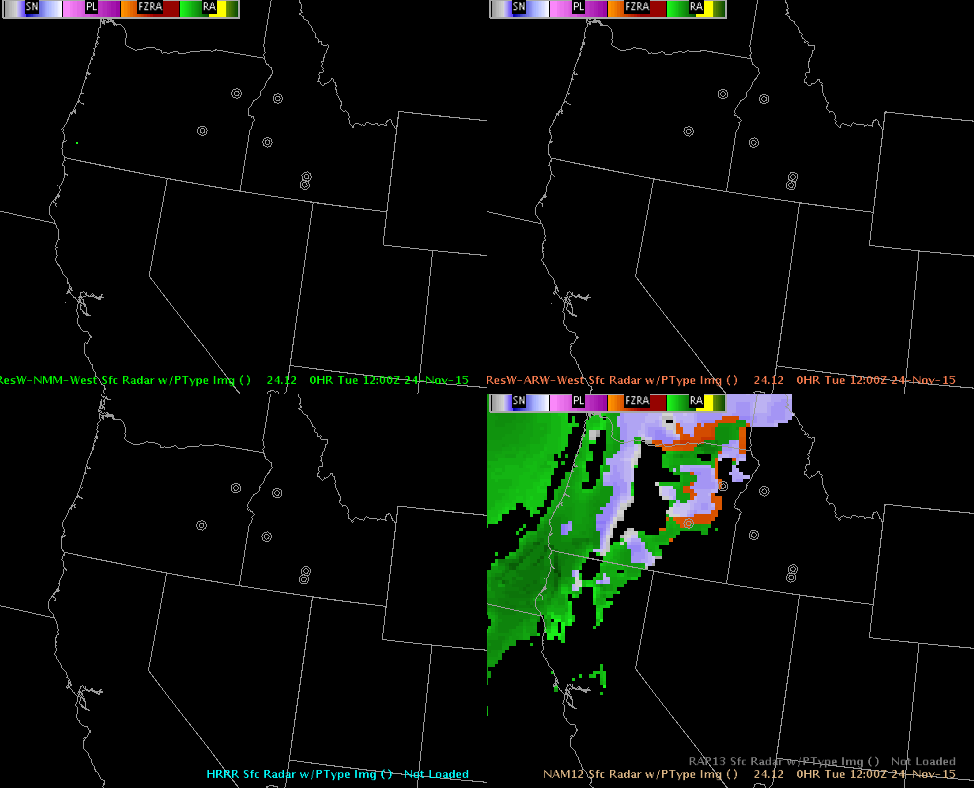
A look at the high-resolution model output for radar with precipitation type shows a similar story. This story would affect how we timed the onset of snow and hazardous conditions. Models shown are: top left - NMM, top right - ARW, bottom right - NAM, bottom left - HRRR.
High-resolution model surface precipitation output also indicated pretty good agreement of the closed low’s trajectory, though there were some discrepancies in QPF forecasts (not shown). Models shown below are: top right - NMM, top left - ARW, bottom right - NAM, bottom left - SREF. Variables displayed are: surface precipitation and 1000-500 mb thickness.
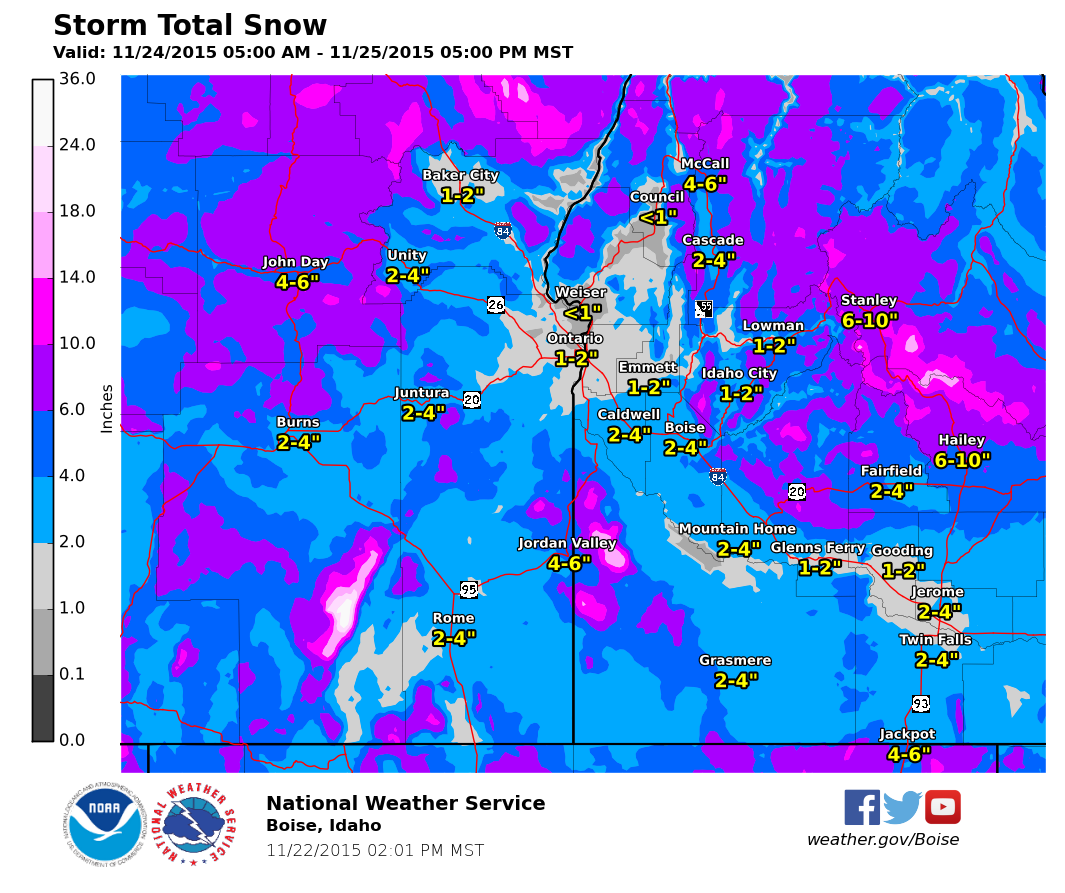
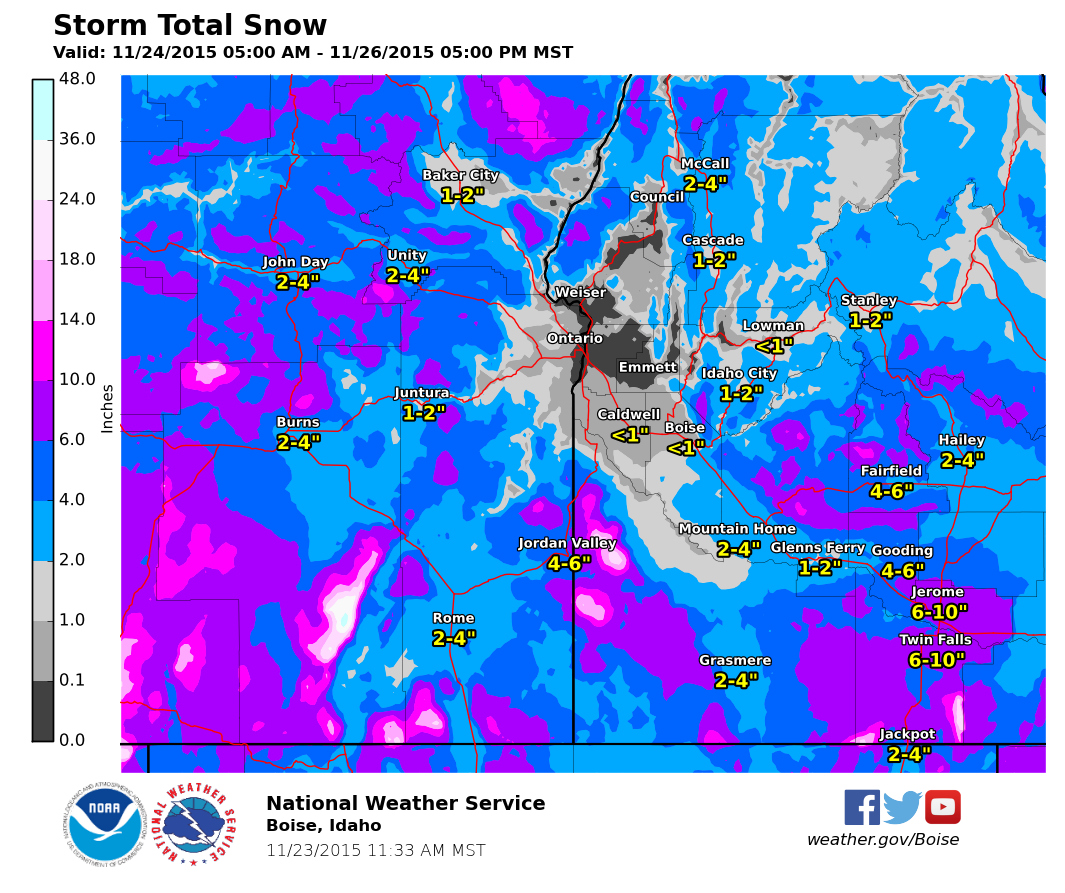
In the days leading up to the event, we focused on the areas we thought would receive the most precipitation. Several days out (likely somewhere in the 3-5 day range), the office made a snow total plot using only the raw ECMWF, which did a great job of highlighting where our problem areas would be - the southern zones; the model blends we used in the days leading up to the event (below), did not do us any favors however, since most of the guidance indicated a more northerly track at first.
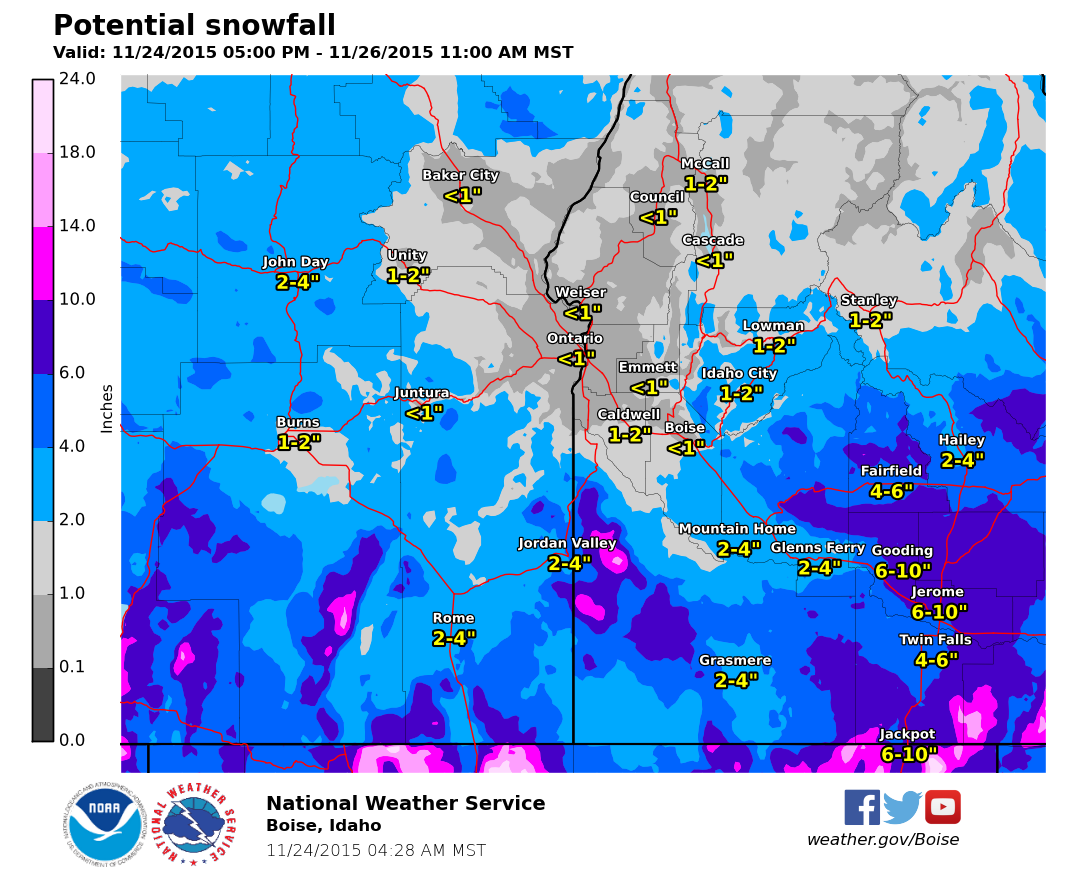
As we move through each forecast period beginning on the 22nd, watch how the closed low follows a more southerly trajectory, thus affecting where the heaviest snow would be, The timing of the event also changes from mostly on the 24th and 25th, to the late hours of the 24th through the 26th.
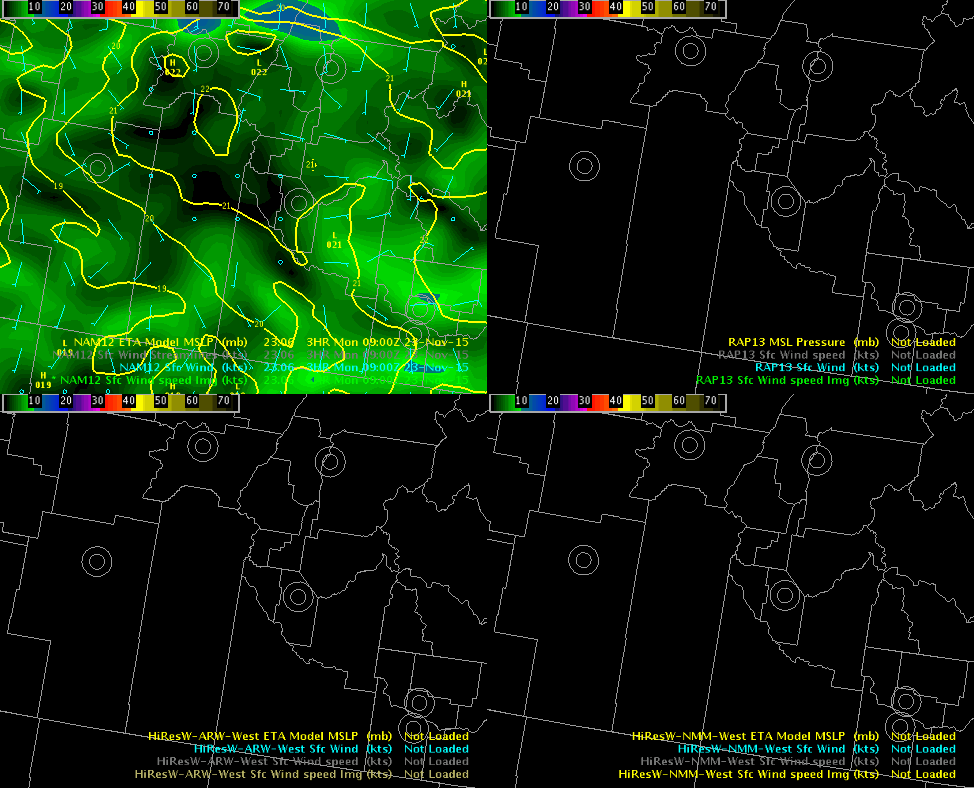
Another piece of the puzzle was the expected gradient winds on the back side of the low. This led us to upgrade advisory level snow to warning level heavy snow and blowing snow across Harney County. Models shown include: top left - NAM, top right - RAP, bottom right - NMM, bottom left - ARW. Variables shown are: model MSLP, wind, and wind speed.
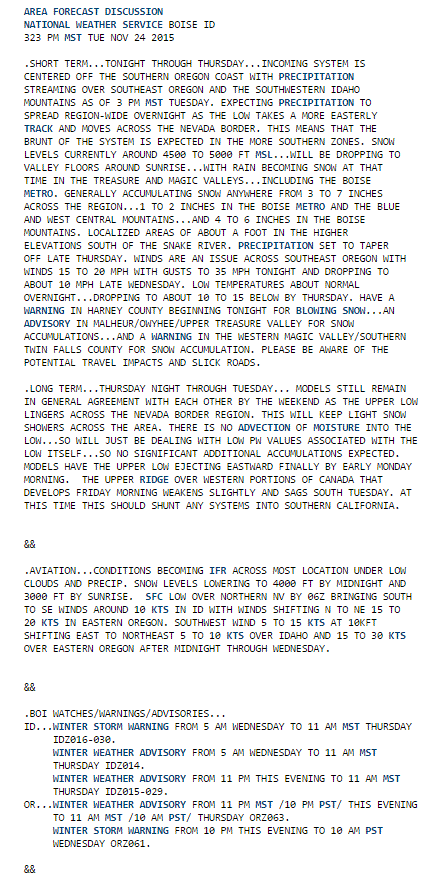
This was the forecast discussion for the 24th:
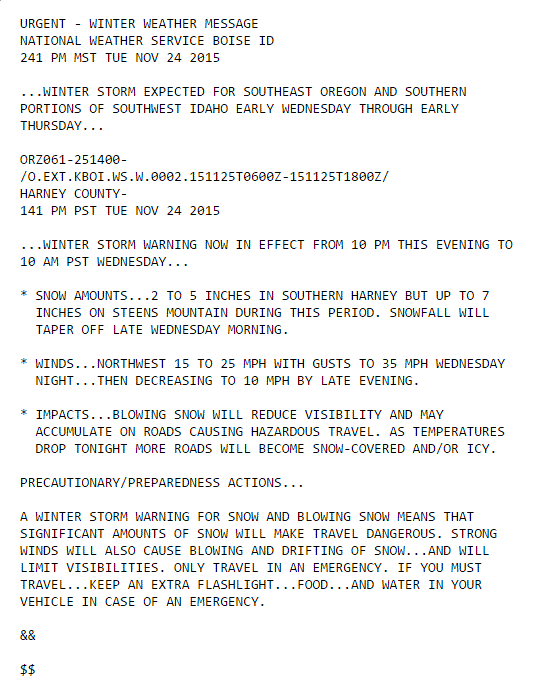
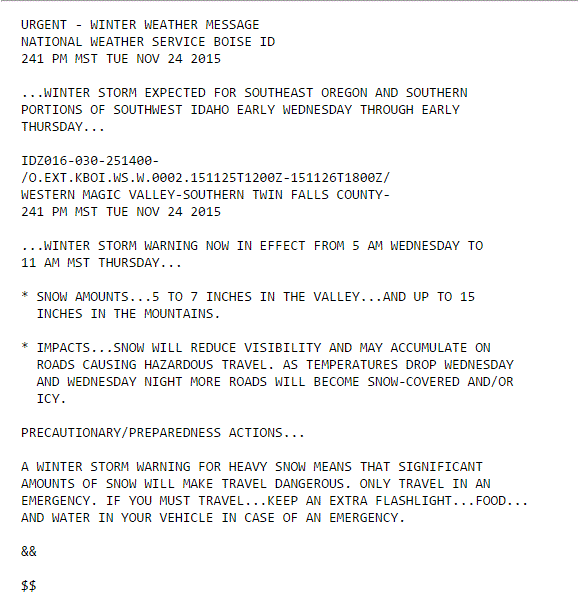
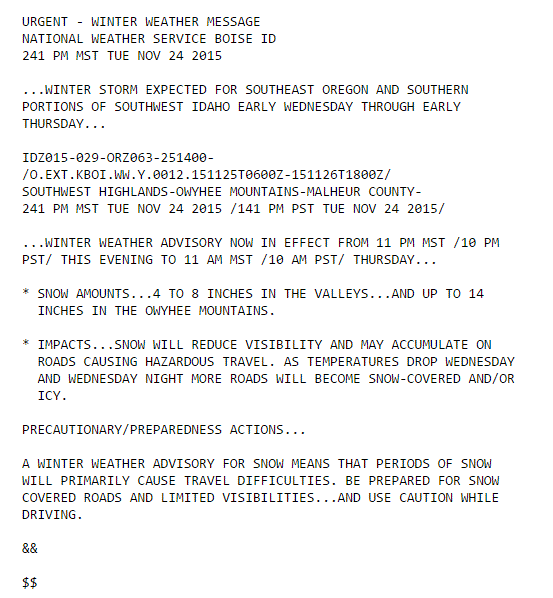
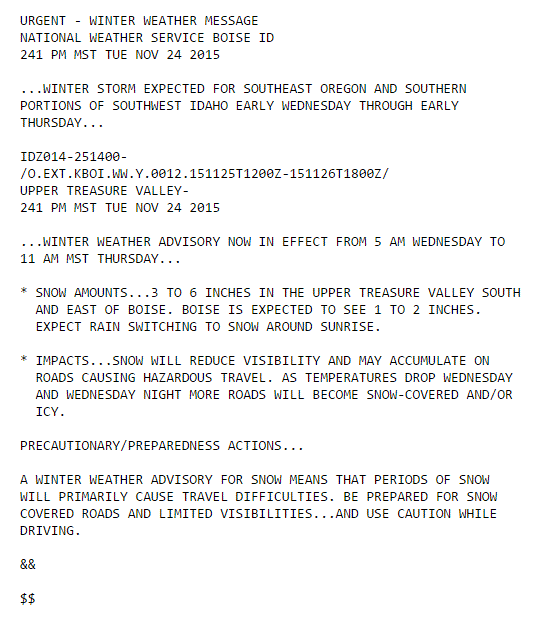
Products in effect on the 24th were as follows:
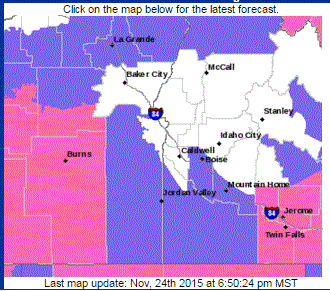
These were the winter products we issued, with warnings listed first, advisories second:
The 12Z model output on the 25th remained relatively consistent, allowing the forecast to continue unchanged . The models are displayed as follows: top left - GFS, top right - ECMWF, bottom right - NMM, and bottom left - NAM. Variables displayed are as follows: 500-mb height, 850-700 thickness, surface precipitation, and 1000-500 mb thickness.
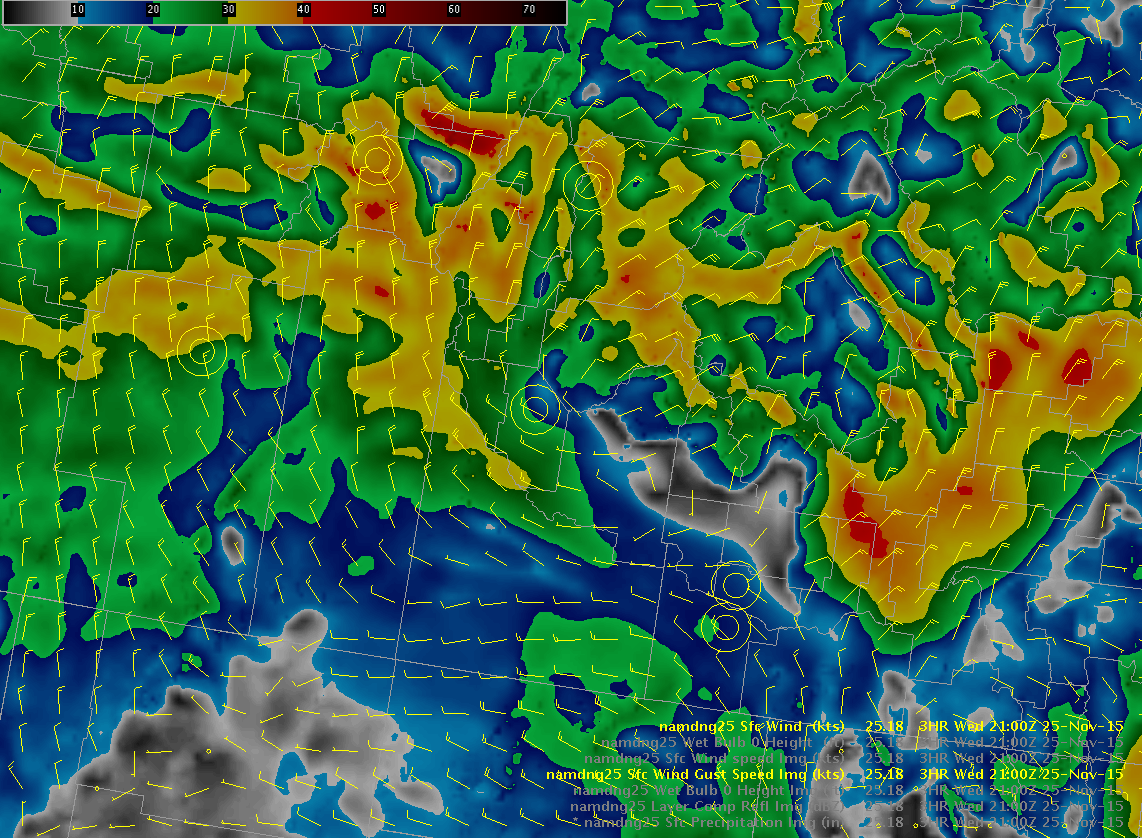
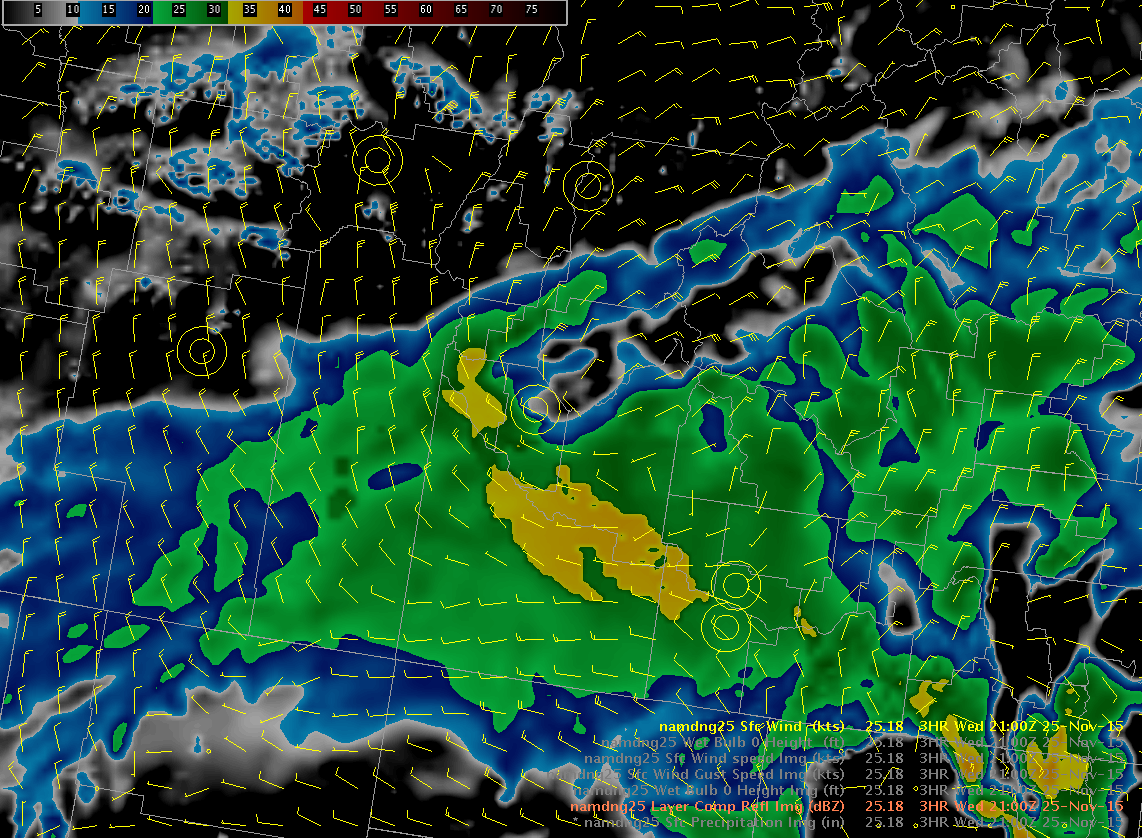
The NAM DNG model runs on the 25th did a pretty good job of displaying model estimated winds and gusts, and composite reflectivity.
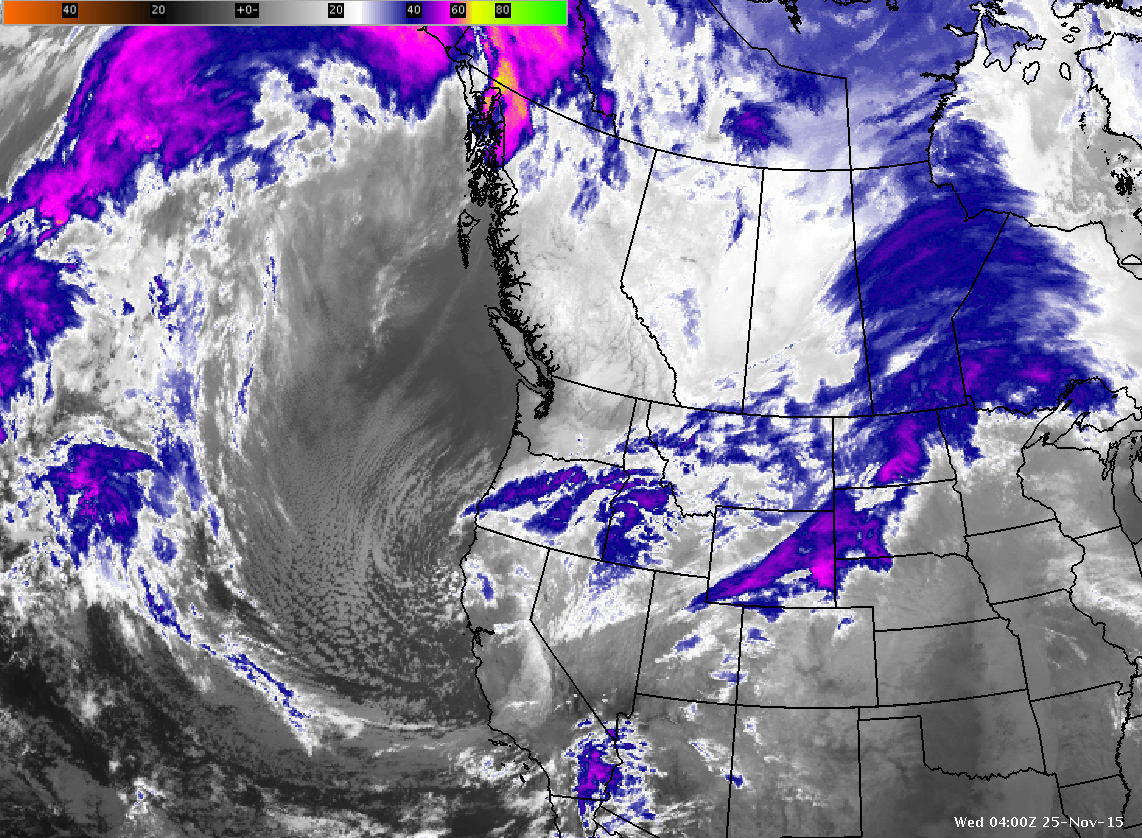
Here’s the IR imagery from 04Z the 24th through 05Z the 26th:
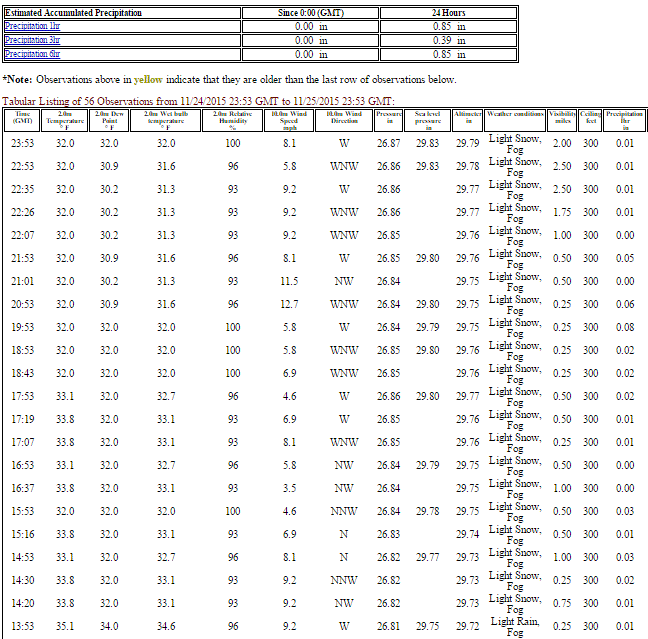
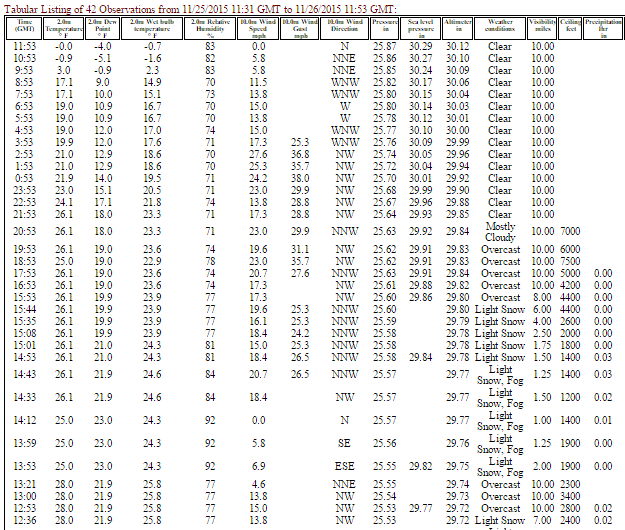
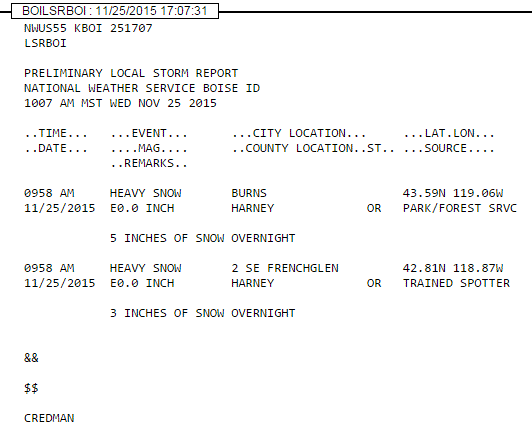
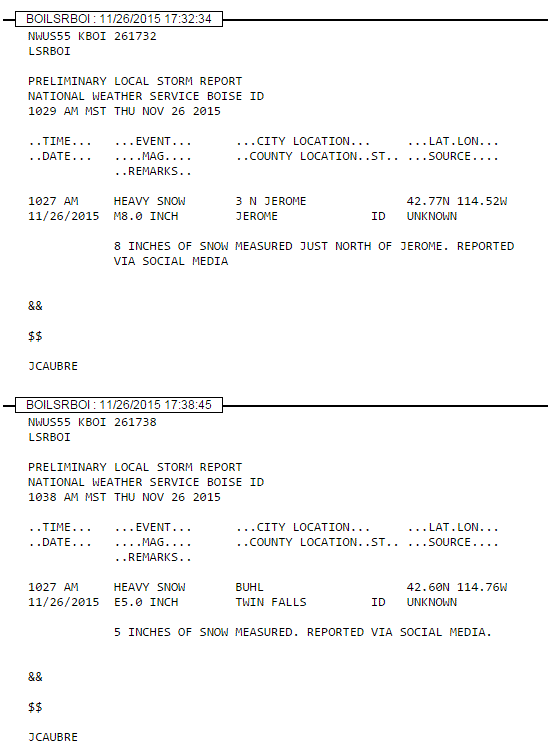
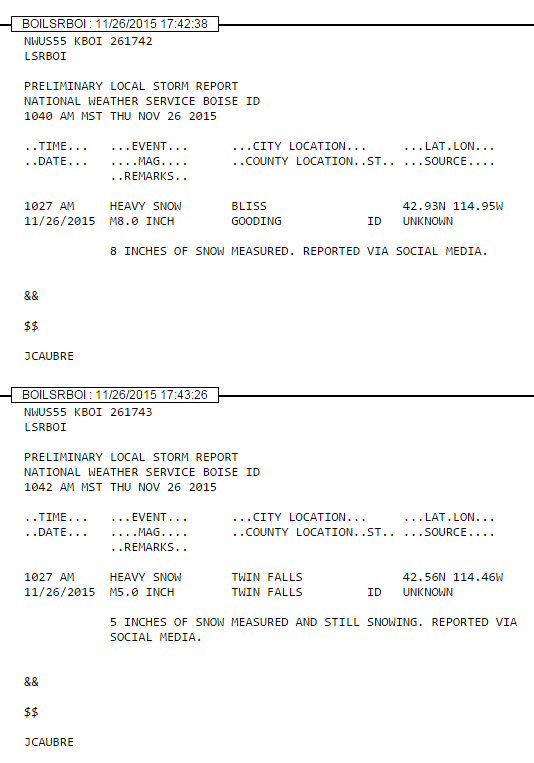
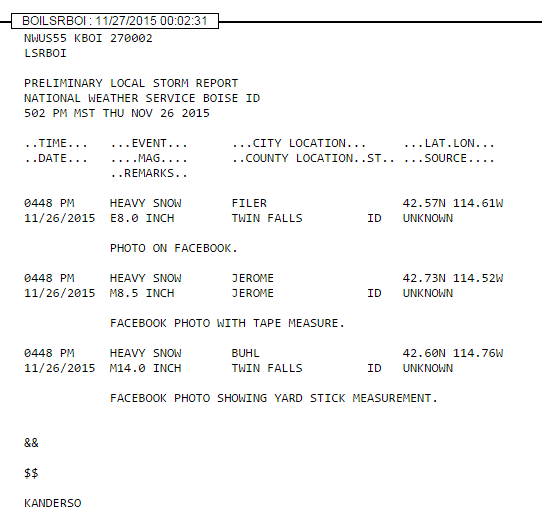
Below are observations and local storm reports for the event:
We told The Statesman that the precipitation would likely switch over from rain to snow around 15Z on Wednesday, the 25th in Boise:
We told the Emergency Manager at the MUO AFB that precipitation would likely switch from rain to snow in the late morning and would probably start accumulating on the roads by early afternoon. We were a few hours off on the switch from rain to snow, as snow began in MUO at 16Z. There are no reports of when the snow began to accumulate on the roads.
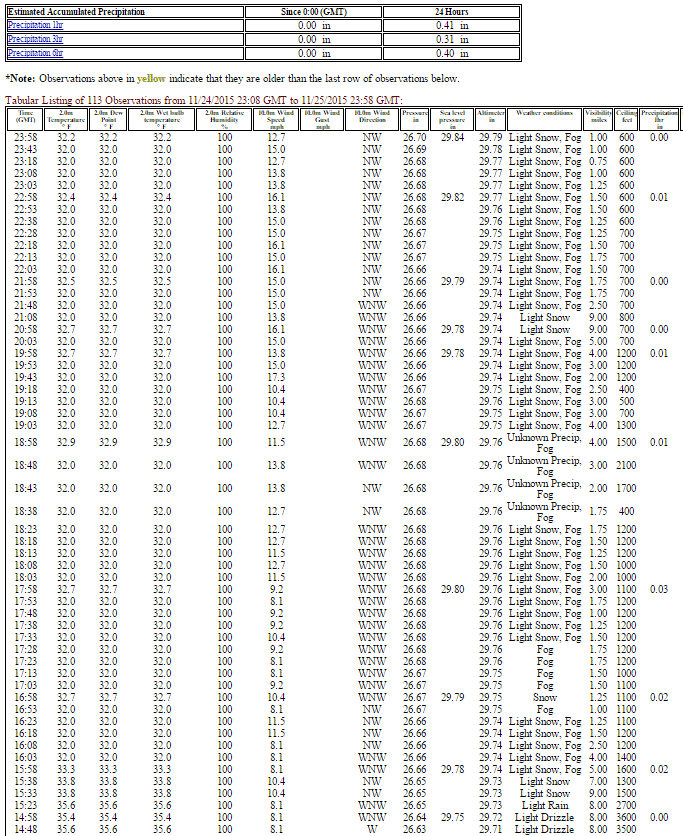
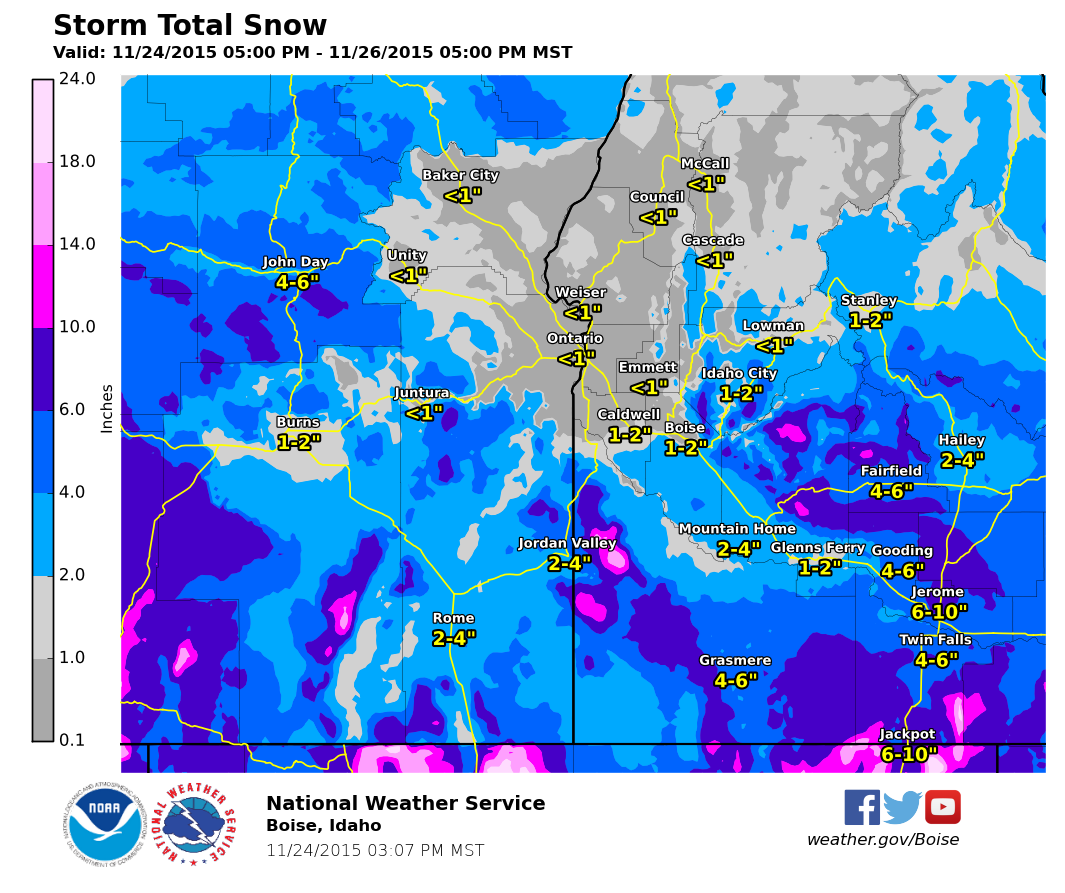
Observations from around Harney County indicate that we forecasted both wind and snow totals very well, as shown by the observations and LSRs below:
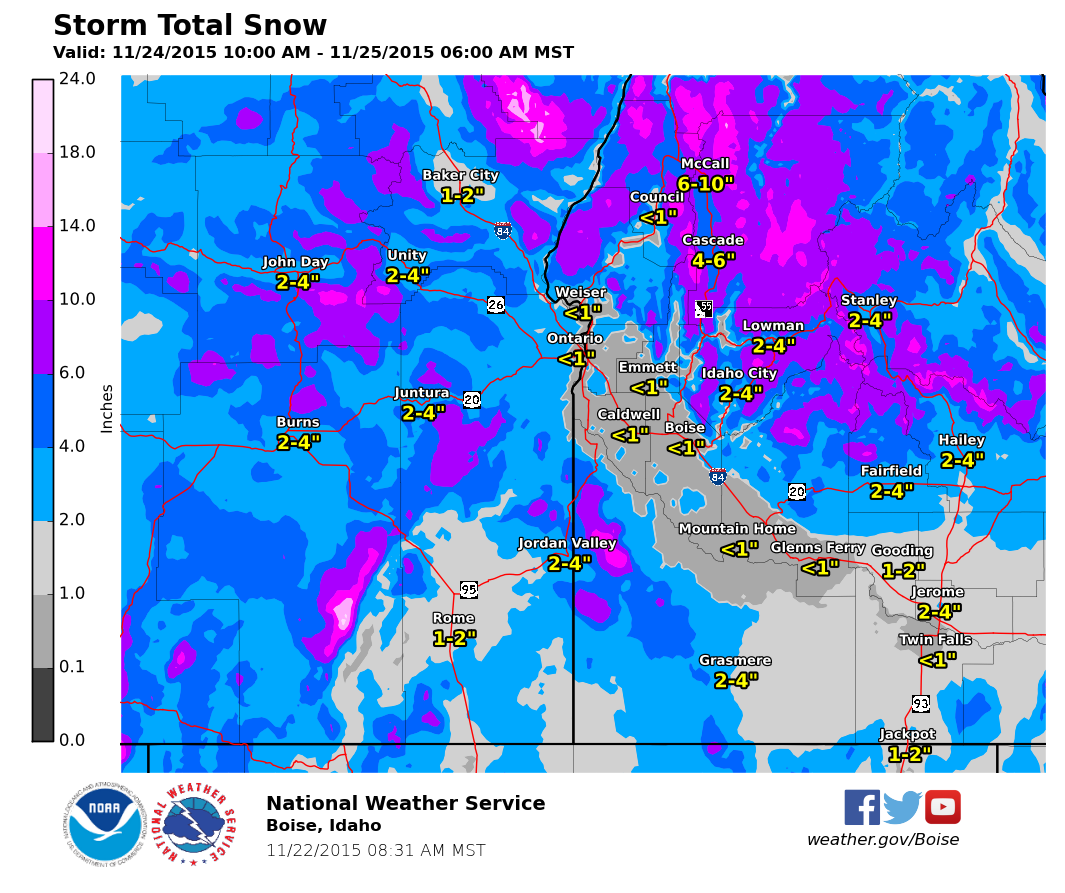
The Magic Valley definitely required a winter storm warning based on the reports we received for snow totals. It seems that we were pretty spot on!
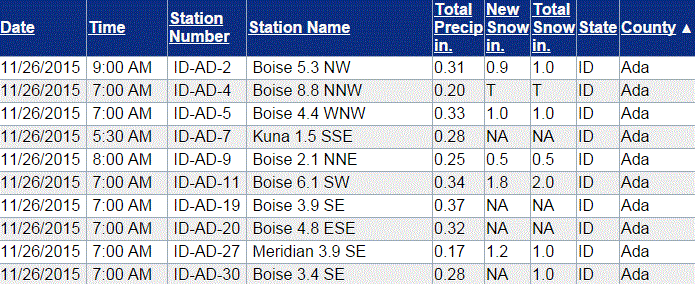
We don’t have any local storm reports logged from the Treasure Valley, though we do have some information from the CoCoRAHS site in Ada County. The Boise 6.1 SW site indicates that the advisory was warranted for that area.
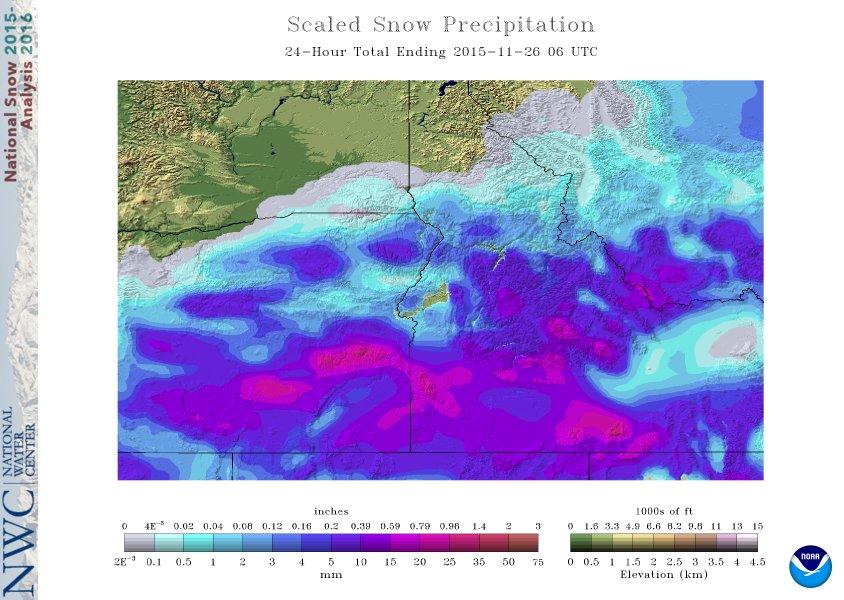
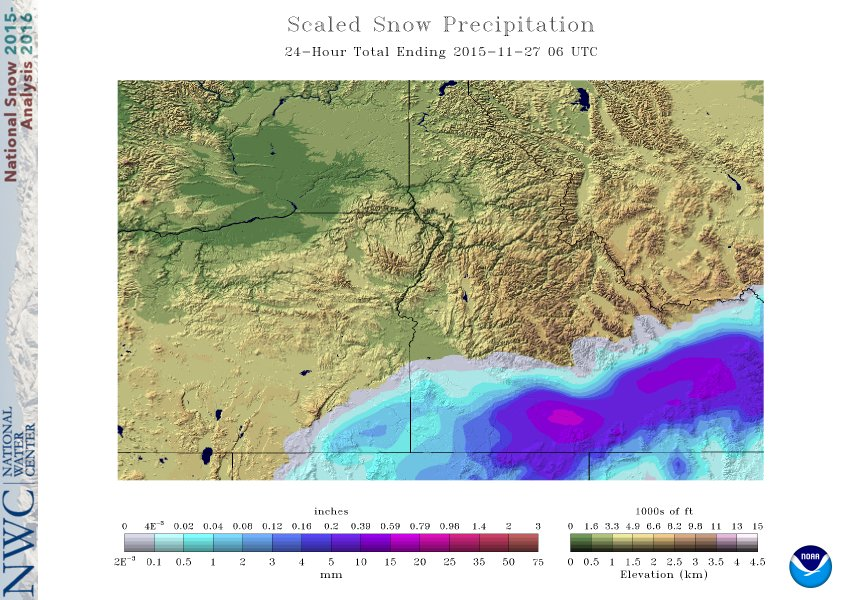
There were no local storm reports logged from Malheur County, or from the Owyhee Mountains either. However, the National Operational Hydrologic Remote Sensing Center provides snow precipitation plots that can give us a nice picture of what occurred that day across the region. The plot details are based off of SNOWTEL and satellite-derived data. We may not be able to use the numbers on these plots at face value, but the general picture is there. Malheur County and the Owyhee Mountains did receive areas of higher snowfall amounts (versus elsewhere). Still, advisories may not have been needed in those areas that day. Nevertheless, there was plenty of concern for these areas in anticipation of Thanksgiving travel.
Conclusions and recommendations:
Long range model forecasts of closed lows can change drastically.
This was a complicated system to forecast for several days out, including the short term (1-2 days). Our office did a great job of relaying the potential hazards in the days prior to Thanksgiving to our partners and to the general public, via phone calls, emails, and social media. This was likely the most valuable thing we did...other than make a good forecast!

