|
2019 will go down in the record books as a fairly normal year hydrology-wise in many respects, with varied rainfall, scattered episodes of river flooding, and periodic flash flood events from localized heavy rainfall. Mixed in the middle of this was also an episode of drought from late summer into the fall season. Overall, rainfall in 2019 averaged between forty five and sixty inches, with localized higher totals. These amounts were generally below normal over the southeast half of Central Alabama and above normal over the northwest sections. This produced a variety of hydrologic events throughout the year in Central Alabama.
The year began on a wet note with above normal rainfall during January and February. January rainfall averaged four to eight inches, with one of the heavier events occurring on the 23 rd when two to four inches of rain fell. This produced some minor flooding on the upper Tombigbee, lower Black Warrior and middle Tallapoosa Rivers, as well as along Village Creek in the Birmingham area.
Rainfall was heavier during February over the northern two-thirds of Central Alabama with average totals between six and twelve inches recorded. The southern third received considerably less rainfall, averaging between one and four inches. Much of the rainfall in the northern sections fell during a prolonged wet spell between the 17th and 24th , with cumulative totals averaging from seven to ten inches over the Upper Tombigbee and Coosa basins, and three to eight inches over the Black Warrior, lower Coosa, Cahaba, Tallapoosa and lower Tombigbee basins. This rainfall produced widespread flooding in these basins. Major flooding occurred around the Bevill Lock and Dam on the upper Tombigbee River, with residential flooding in the area. Widespread flooding occurred around Weiss Lake, with numerous roads, docks, boat houses and residences around the lake flooded. Some water rescues and evacuations occurred as a result of this flooding. Minor flooding also occurred along portions of the Sucarnoochee, Black Warrior and Cahaha Rivers as a result of this rainfall.
March brought a reprieve from the above normal rainfall and flooding in February, with totals averaging between two and four inches across most of the area. However, wetter conditions returned in April as spring storm systems brought near to above normal rainfall back to Central Alabama. April rainfall averaged between four and eight inches. Much of this rainfall occurred from the 7th to the 10th and from the 13th to the 15th , and produced minor flooding along the Tombigbee, Sucarnoochee and Tallapoosa rivers.
May was a transitional month, with rainfall generally below normal, averaging from one to three inches, with isolated totals a little over five inches. The most notable rainfall event occurred on the 11th and 12th , when one to two inches fell over the Tombigbee and lower Tallapoosa basins, and produced minor flooding at the Bevill Lock and Dam.
As Central Alabama moved into the summer season, a typical pattern of scattered convection was observed. June rainfall averaged two to five inches over the western half of Central Alabama, and four to eight inches, with localized eight to ten inches, over the eastern sections. Heavy rainfall from summertime thunderstorms produced flash flooding on the 8th in areas from around Seale to Phenix City in the southeast sections. Several roads in the area became impassable due to this rainfall.
In July, which is normally one of our wettest months, below normal rainfall was observed. Rainfall for the month averaged from two to four inches, with some localized amounts to six inches. The below normal rainfall and typically hot July temperatures aided in the development of Moderate Drought conditions over portions of the area by month’s end. There was one episode of fairly significant flash flooding in July. This occurred on the 19th in downtown Anniston and surrounding areas. Two to four inches of rain, with localized higher totals, flooded several roadways and some residences in the area, with one home flooded to a depth of five feet.
Above normal rainfall returned in August, averaging two to six inches across the area. During the afternoon of the 23rd, two to four inches of rain in one to two hours across southern Jefferson and northern Shelby Counties produced significant flash flooding in areas such as Cahaba Heights, Inverness, Vestavia Hills, Indian Springs Village, Hoover and northern Pelham. Water up to a few feet deep was reported in areas near the Oak Mountain Amphitheatre, Rocky Ridge Elementary School, Hoover High School and Veterans Park. Many roads were inundated in these areas, and several vehicles were submerged.
Dry weather reappeared in September, along with much above normal temperatures as a strong and persistent ridge of high pressure set up across the area. Rainfall averaged less than one inch in most places, although isolated locations in east Alabama received between one and two inches. The Tuscaloosa Airport received only 0.01 inch of rain for the month and the Montgomery Airport only 0.50 inch. The hot, dry weather resulted in declining stream flows and ground moisture across Central Alabama. By month’s end, Moderate to Severe Drought had developed over much of eastern Central Alabama, with localized pockets of Extreme Drought.
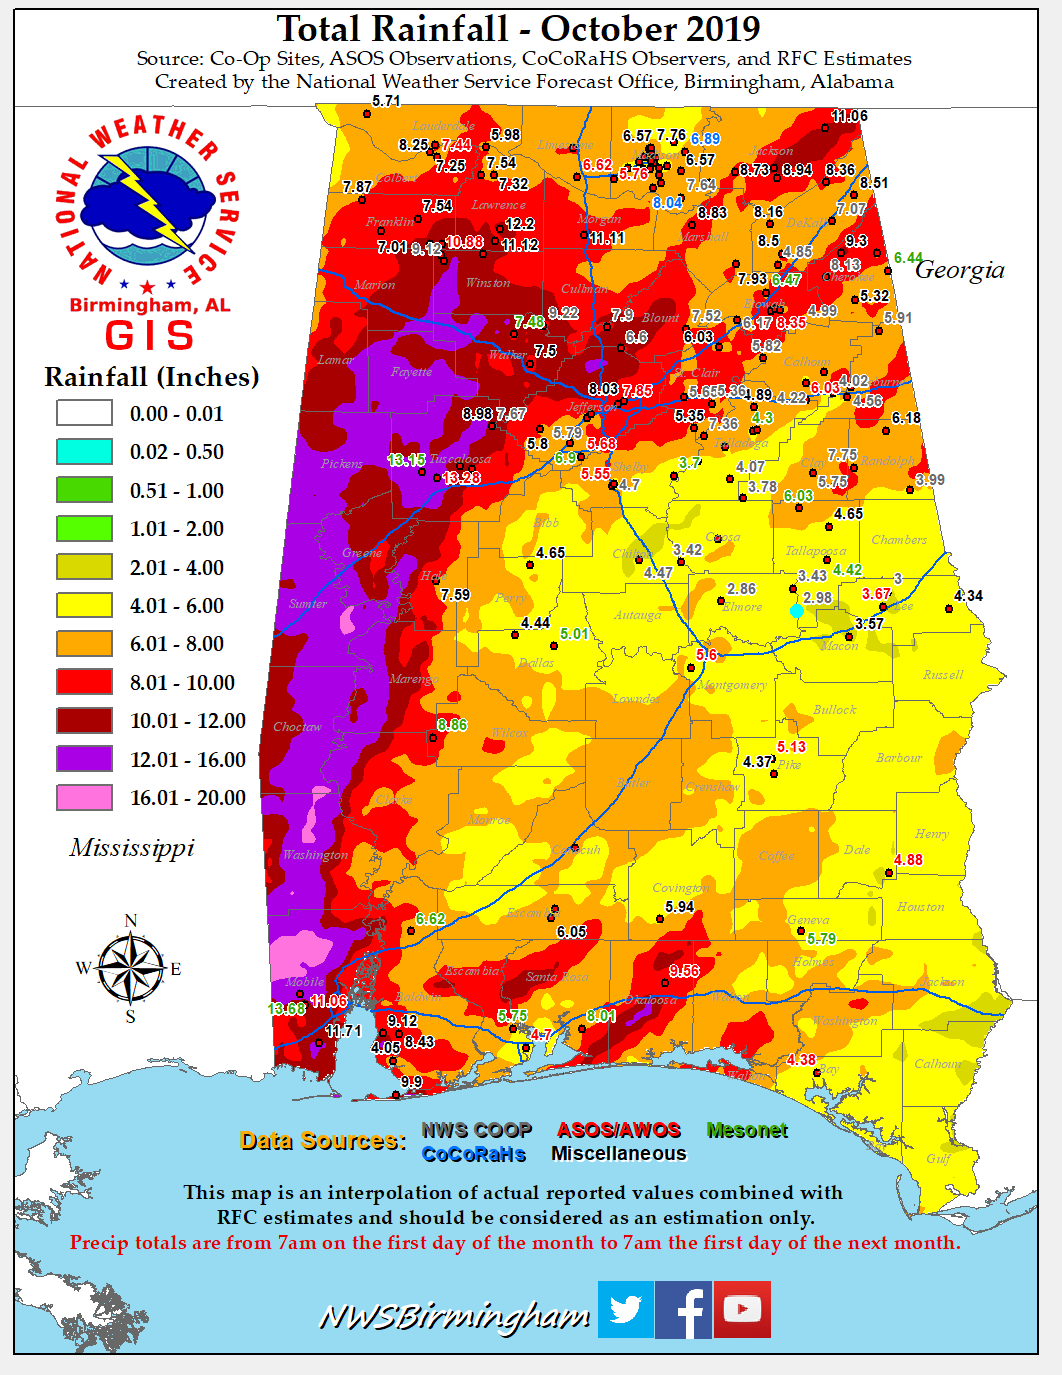
As had been the case throughout the year, the dry weather pattern changed to a wetter one as we moved into October. This helped to greatly alleviate the drought conditions that had plagued the area by month’s end. Monthly rainfall averaged from six to twelve inches across the Tombigbee and upper Black Warrior basins, four to eight inches over the Cahaba, upper Coosa and Tallapoosa basins, and three to six inches elsewhere. Prolonged periods of rain produced four to eight inch totals from the 25th to the 31st across the northern portions of Central Alabama, and resulted in areal flooding in several locations. Flooding of roads and a few homes in the Gadsden area occurred on the 25th following three to five inches of rain over several hours, and some roads were also flooded in the Hokes Bluff area. Daily Maximum Rainfall records were set at the Tuscaloosa Airport on the 25th, 30th and 31st, and at the Birmingham Airport on the 30th. The Tuscaloosa Airport also set a monthly rainfall record for October with a total of 13.28 inches.
November brought a continuation of periodic rainfall, with totals averaging between two and four inches, with localized amounts of five to seven inches. This rainfall helped to further ease lingering drought conditions across the area. Rainfall in December returned to near to somewhat below normal as the year drew to a close.
Rainfall in December was near to above normal as the year drew to a close. A storm system moving north and east from the northern Gulf of America spread heavy rainfall across Central Alabama from the 21 st to the 23rd and dropped from two to four inches across much of the area. Although no flash flooding was reported with this rainfall, moderate rises occurred on several rivers with minor flooding occurring on the Upper Tombigbee River at Bevill Dam and along the lower Black Warrior River at Selden Dam. The Alabama, lower Cahaba, and lower Tallapoosa Rivers also rose above caution stages with minor overflow along them. As December drew to a close, monthly totals averaged generally between four and six inches, with locally heavier amounts.
Below are the Drought Conditions each month in 2019
|