|
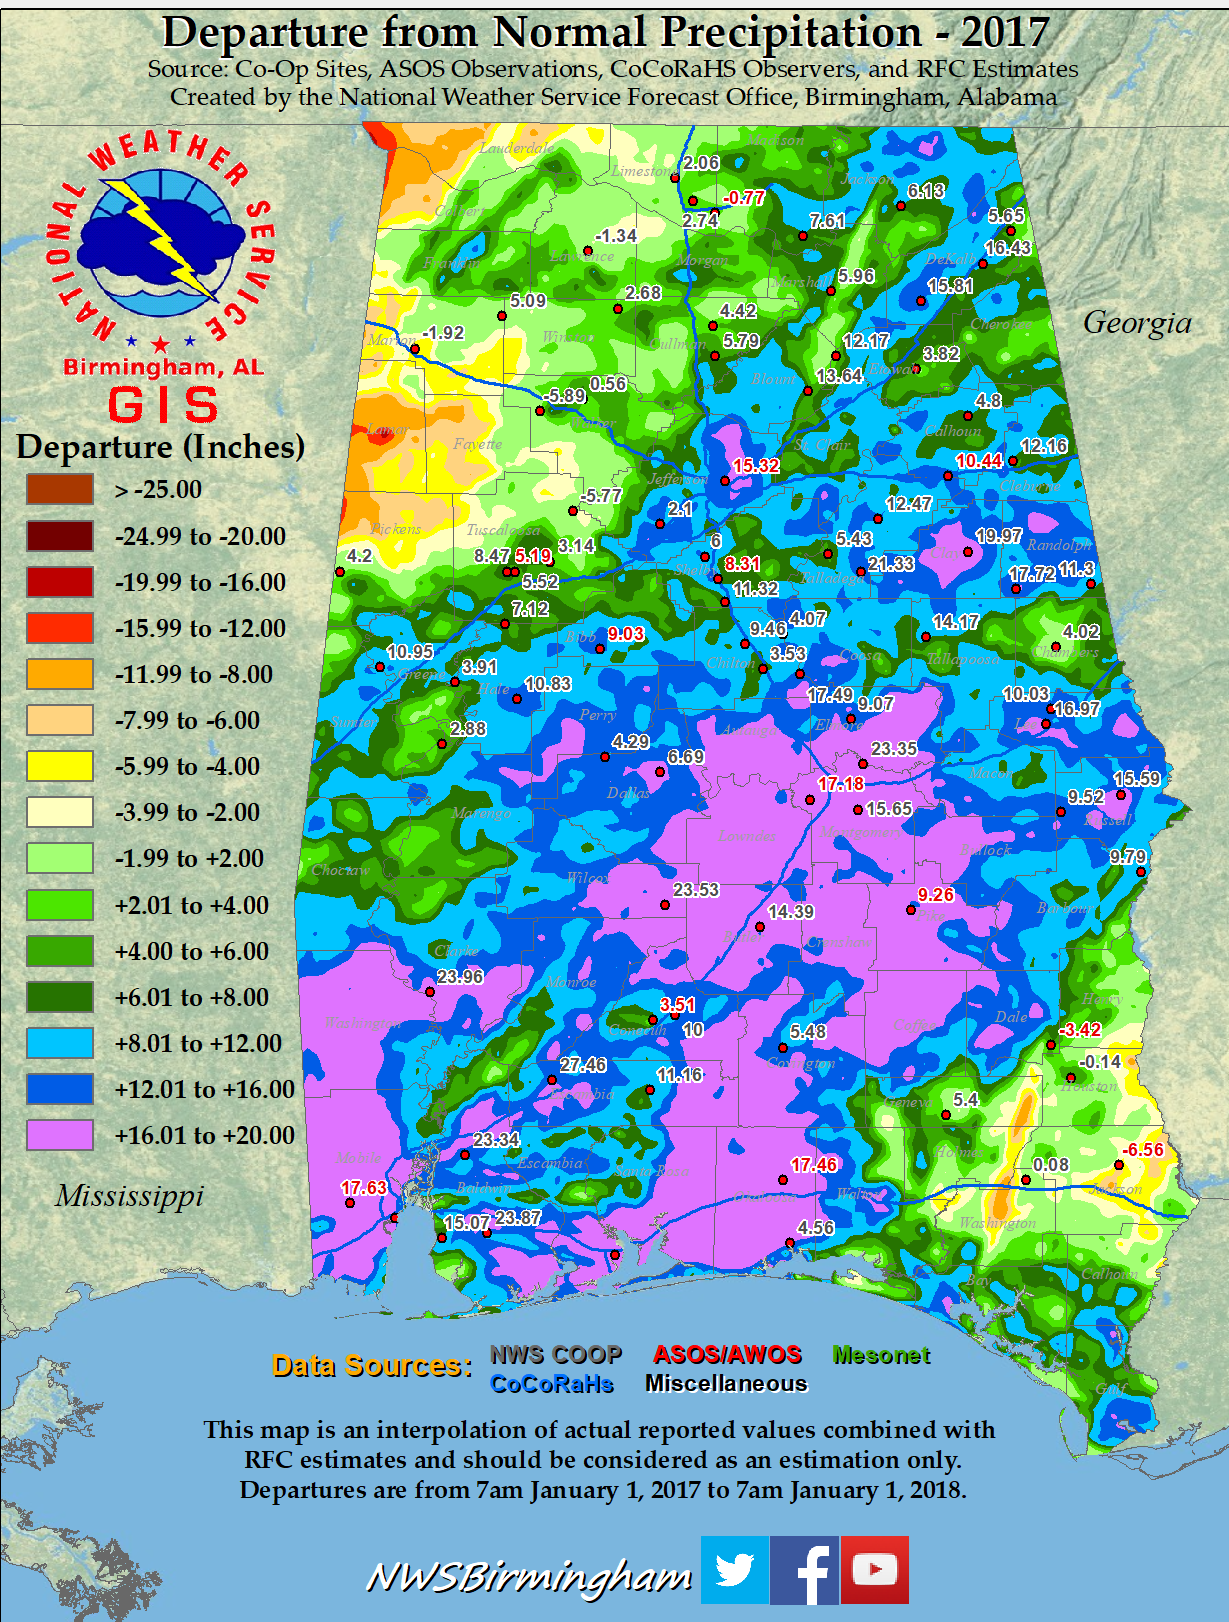
The weather pattern in December 2016 continued to bring periodic rainfall to the area. However, despite the rainfall late in the year, most stream flows across the area in late December were still running below normal, and Extreme to Exceptional Drought persisted across much of Central Alabama into early 2017.
January of 2017 began on a wet note with monthly rainfall averaging from six to thirteen inches, and locally up to fifteen inches, as periodic storm systems impacted Central Alabama. Heavy rainfall of four to eight inches during the first three days January produced some flash flooding of streets and roadways across portions of Elmore, Russell and Cherokee Counties. However, relatively low stream flows lingering from the dry conditions during late 2016 prevented significant flooding from occurring along area rivers and streams. Exceptional Drought conditions were reduced to only a sliver remaining along Interstate 20.
Following the wet start to the New Year, the weather pattern settled down with generally below normal rainfall dominating conditions during February and March. This allowed the Drought conditions further improvement with only Moderate to Severe Drought across north central Alabama.
April brought an abrupt change to a much wetter pattern that persisted through May and June. Frequent storm systems brought occasional bouts of heavy rainfall to Central Alabama during this time, with periodic episodes of flooding. A storm system brought four to eight inches of rain to the northwestern two-thirds of Central Alabama during the first week of April. This produced minor flooding along portions of the Tombigbee, Sucarnoochee and Lower Black Warrior River Basins.
As the periodic heavy rainfall continued in May, more flooding occurred. This was mainly in the form of flash flooding. On the 21st, six to eight inches of rain in Montgomery, Elmore and Lowndes Counties and two to four inches elsewhere over much of east-central Alabama produced significant flash flooding. Widespread flash flooding of streets and roadways occurred over portions of Montgomery, Elmore, Lowndes, Jefferson and Cherokee Counties. In Jefferson County, including the Birmingham metropolitan area, numerous roads were flooded and water rescues were needed. Following this episode of heavy rainfall, another two to three inches of rain occurred on the 23rd and 24th in eastern portions of Central Alabama, producing additional flash flooding.
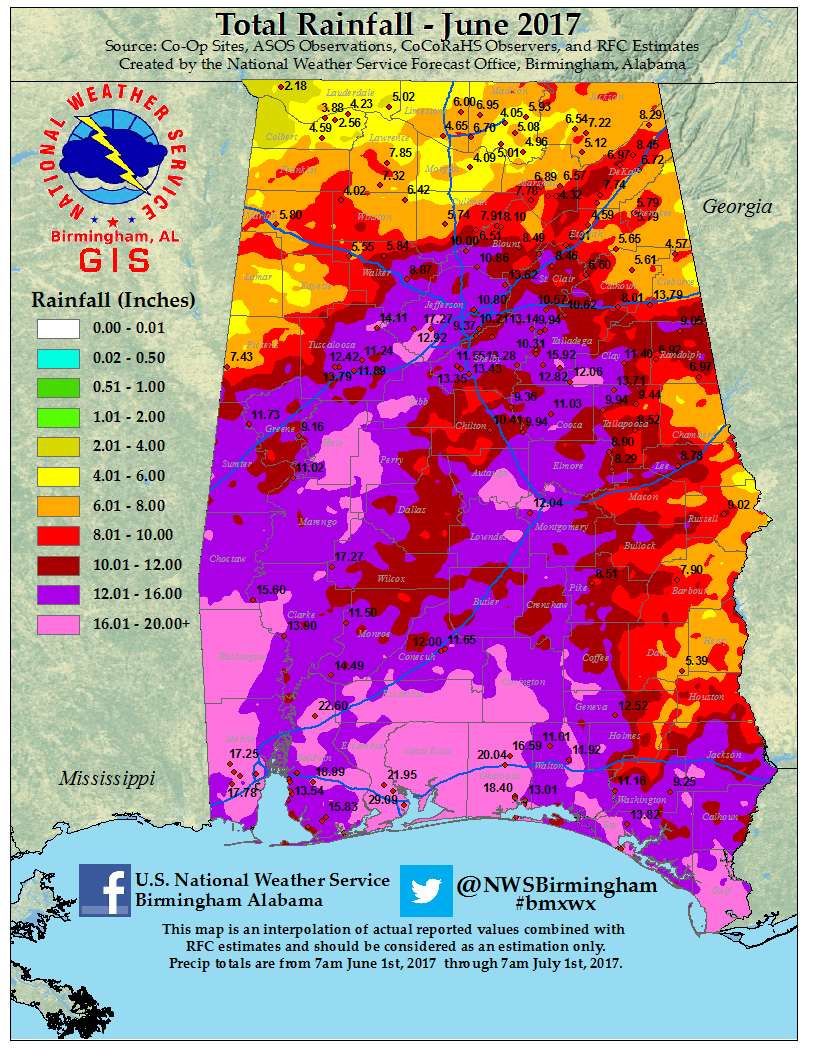
The wetness continued into June. From the 18th through the 24th, four to eight inches of rainfall was measured over portions of the upper Black Warrior and lower Tombigbee basins, as well as the Coosa and Alabama River basins, with six to twelve inches across the Cahaba and lower Black Warrior River Basins. Minor river flooding occurred along portions of these mainstreams. Widespread flash flooding also developed on the 18th in portions of Autauga, Elmore and Montgomery Counties when four to eight inches of rain fell. This produced widespread flooding of streets and roadways in these areas.
Central Alabama finally returned to a more typical summertime pattern in July with localized flash flooding from torrential downpours in thunderstorms being the primary problem. The most significant event occurred on the 26th in the Vestavia Hills area of southern Jefferson County when two inches of rain fell in less than an hour, and two to four inches for the storm total. This produced severe flooding, especially in areas along and near Patton Creek. Flash Flooding also occurred in portions of Jefferson and Shelby Counties on the 15th when four to five inches of rain produced street flooding in the Bessemer, McCalla and Hoover areas, and on the 24th when three to four inches of rain produced widespread street flooding in areas along and near Five Mile Creek and Village Creek in Jefferson County. Multiple water rescues were needed. Drought conditions ended for all of central Alabama by July as the much needed rain soaked in. These conditions would persist through much of November.
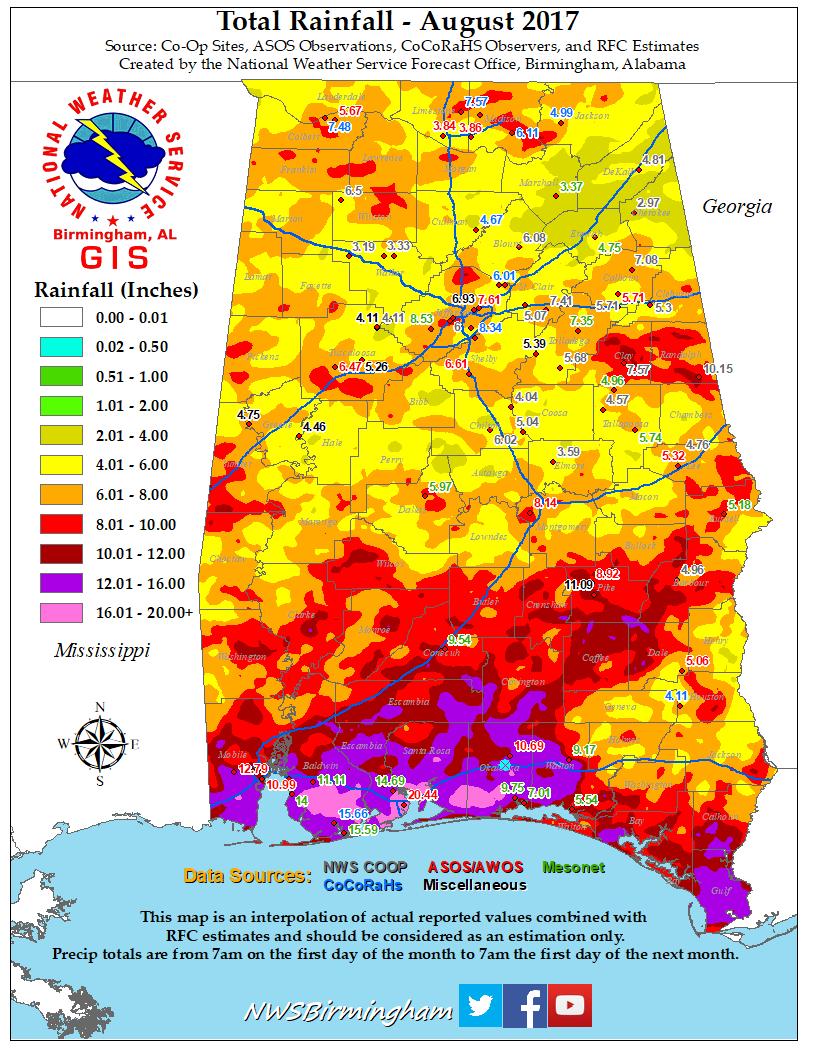
Wet conditions occurred again in August as above normal rainfall was measured over much of the region. The most significant event of the month occurred during the evening of the 10th into the early morning hours of the 11th when four to six inches of rain flooded numerous streets and roadways across portions of Elmore, Montgomery, Pike and Autauga Counties. In Randolph County, four to eight inches of rain produced severe flash flooding, especially in the Roanoke area where numerous roadways were flooded, as well as some residences and businesses. Several water rescues were also necessary.
A change to drier conditions began in September, with below normal rainfall in the western sections of Central Alabama, and near to a little above normal rainfall in the east. Much of the rainfall in the eastern sections occurred on the 11th through the 12th as the remnants of Hurricane Irma moved northward through Georgia. However, there were no significant flooding issues from this rain.
October returned to the persistent wet pattern that had persisted for much of 2017, with above normal rainfall across the area. However, no flooding or major rises occurred on area rivers and streams.
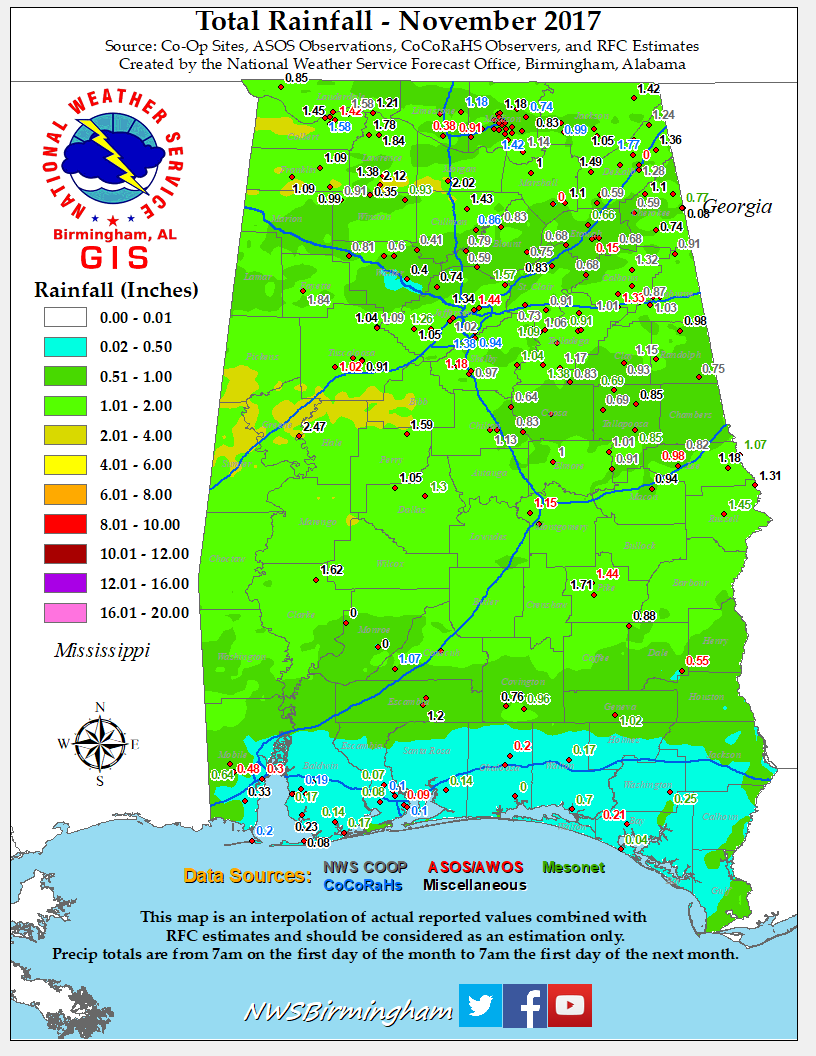
A change to drier conditions began in November, and persisted through December with below normal rainfall. The western sections of Central Alabama were beginning to feel the effects of this drier pattern as the year drew to an end, with moderate drought developing over those portions of Central Alabama.
Below are the Drought Conditions each month in 2017
|