THE SOUTH GEORGIA AND NORTH FLORIDA WINTER STORM OF JANUARY 3 2018
Early in the morning of January 3rd, portions of north Florida and south Georgia had a mix of wintry precipitation (Figure 1). The precipitation was primarily freezing rain around Cross City, Madison, and Mayo, Florida. In the areas around Tallahassee, Florida, and Valdosta, Georgia, the precipitation was initially freezing rain and sleet, but changed to snow. The heaviest accumulations of snow were in south Georgia were amounts ranged from 0.50 to 2 inches. Snow accumulations in north Florida were mostly less than half an inch, with only 0.1 inches measured officially in Tallahassee. Ice accumulations in the Suwannee River Valley were enough to cause several power outages. For this region it was the first winter storm since December 1989. Additionally, this is the first recorded measurable snowfall in Tallahassee during the month of January based on records dating back to April 1885.
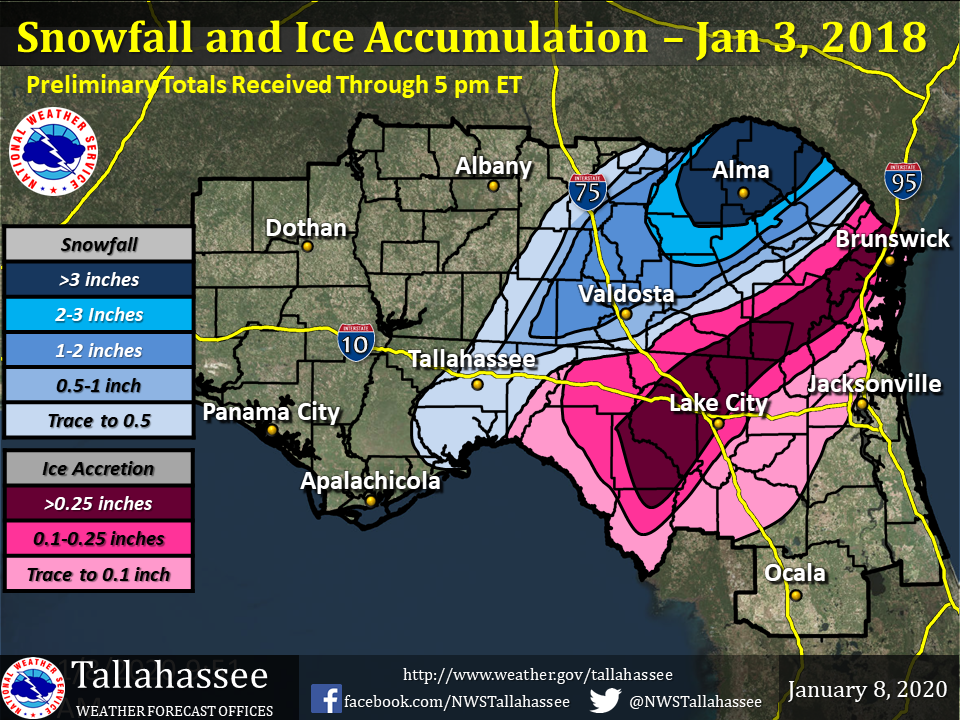
Figure 1. Snow and ice totals based on official and unofficial measurements.
During the early morning hours of Wednesday, January 3rd, light precipitation began to develop across north Florida and south Georgia (Figure 2). This was in response to ascending moist air ahead of a powerful upper-level trough approaching from the northwest. (Figure 3).
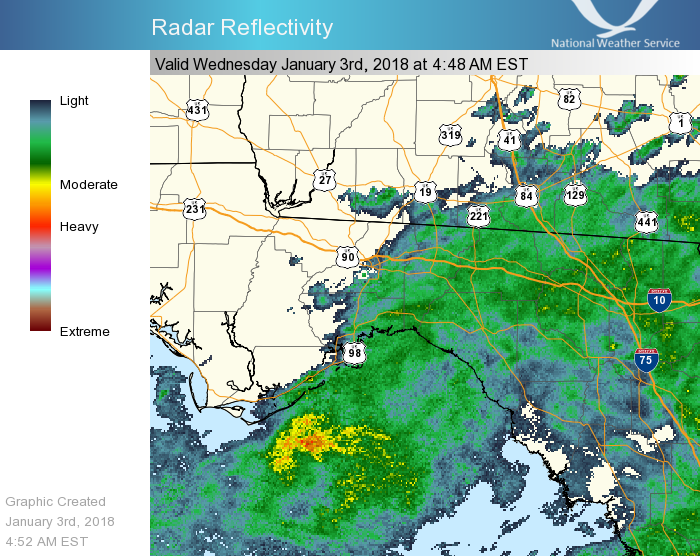
Figure 2. Radar reflectivity showing mostly light rain and/or freezing rain beginning, The yellow and orange off the St George Island coast indicates a zone of snow and ice coated with liquid water within the melting layer.
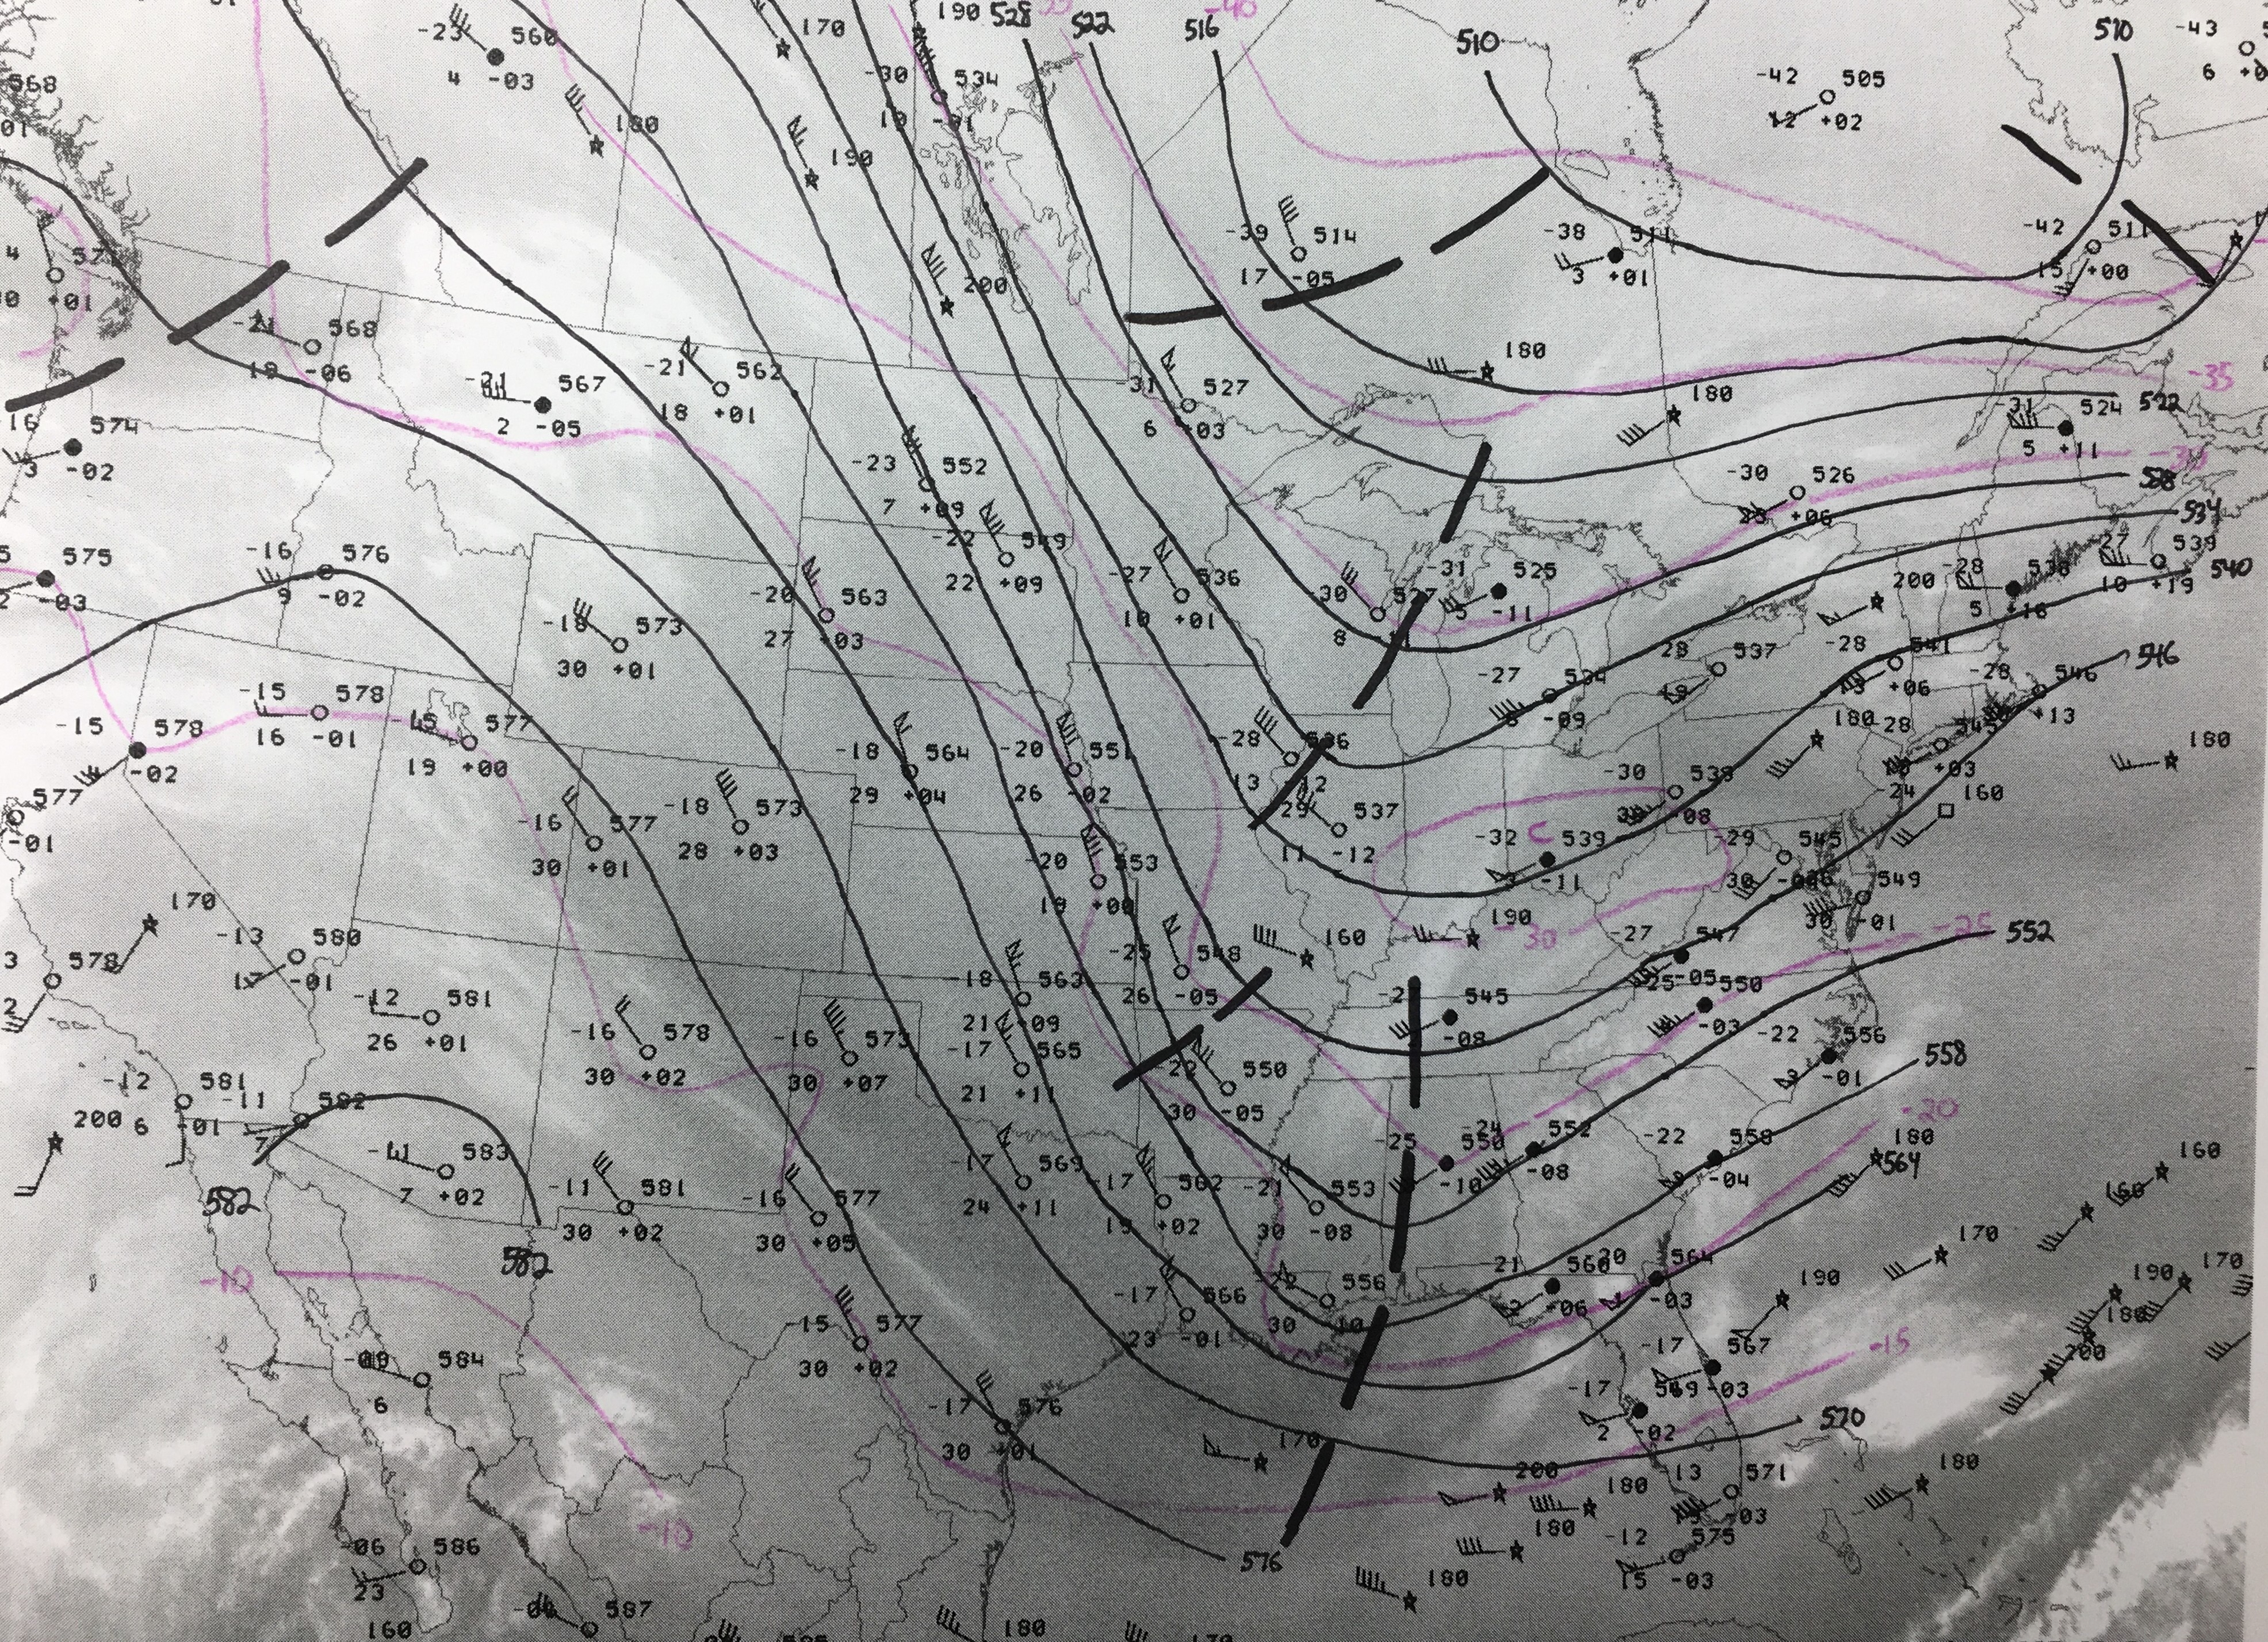
Figure 3. Lines of constant height of the 500 mb pressure surface (solid black lines); the wind generally follows these contours from west to east, with the strongest winds occurring where the lines are closest together. Background image is water vapor from 0700 EST; dark gray indicates very dry air and white indicates significant moisture. “Disturbances” (troughs) indicated by thick, dashed black lines; rising motion, clouds, and precipitation often occur ahead of these features.
At the surface much of the nation was unusually cold, with freezing temperatures reaching the Gulf Coast and the Southeast Coast (Figure 4). North winds were bringing this cold, dry air into the region, offsetting the warming which normally occurs when there is cloud cover and precipitation in our region this time of year. Note the weak wave of low pressure beginning to develop off the east coast of central Florida. This system would go on to explode into a powerful storm as it interacted with the upper-level trough and the extreme temperature difference between the air over the warm Gulf Stream waters and the bitterly cold air over the eastern U.S. This powerful cyclone would bring heavy snow, high winds and tides, and brutally cold wind chills to much of the U.S. east coast through the following day as it raced northeastward.
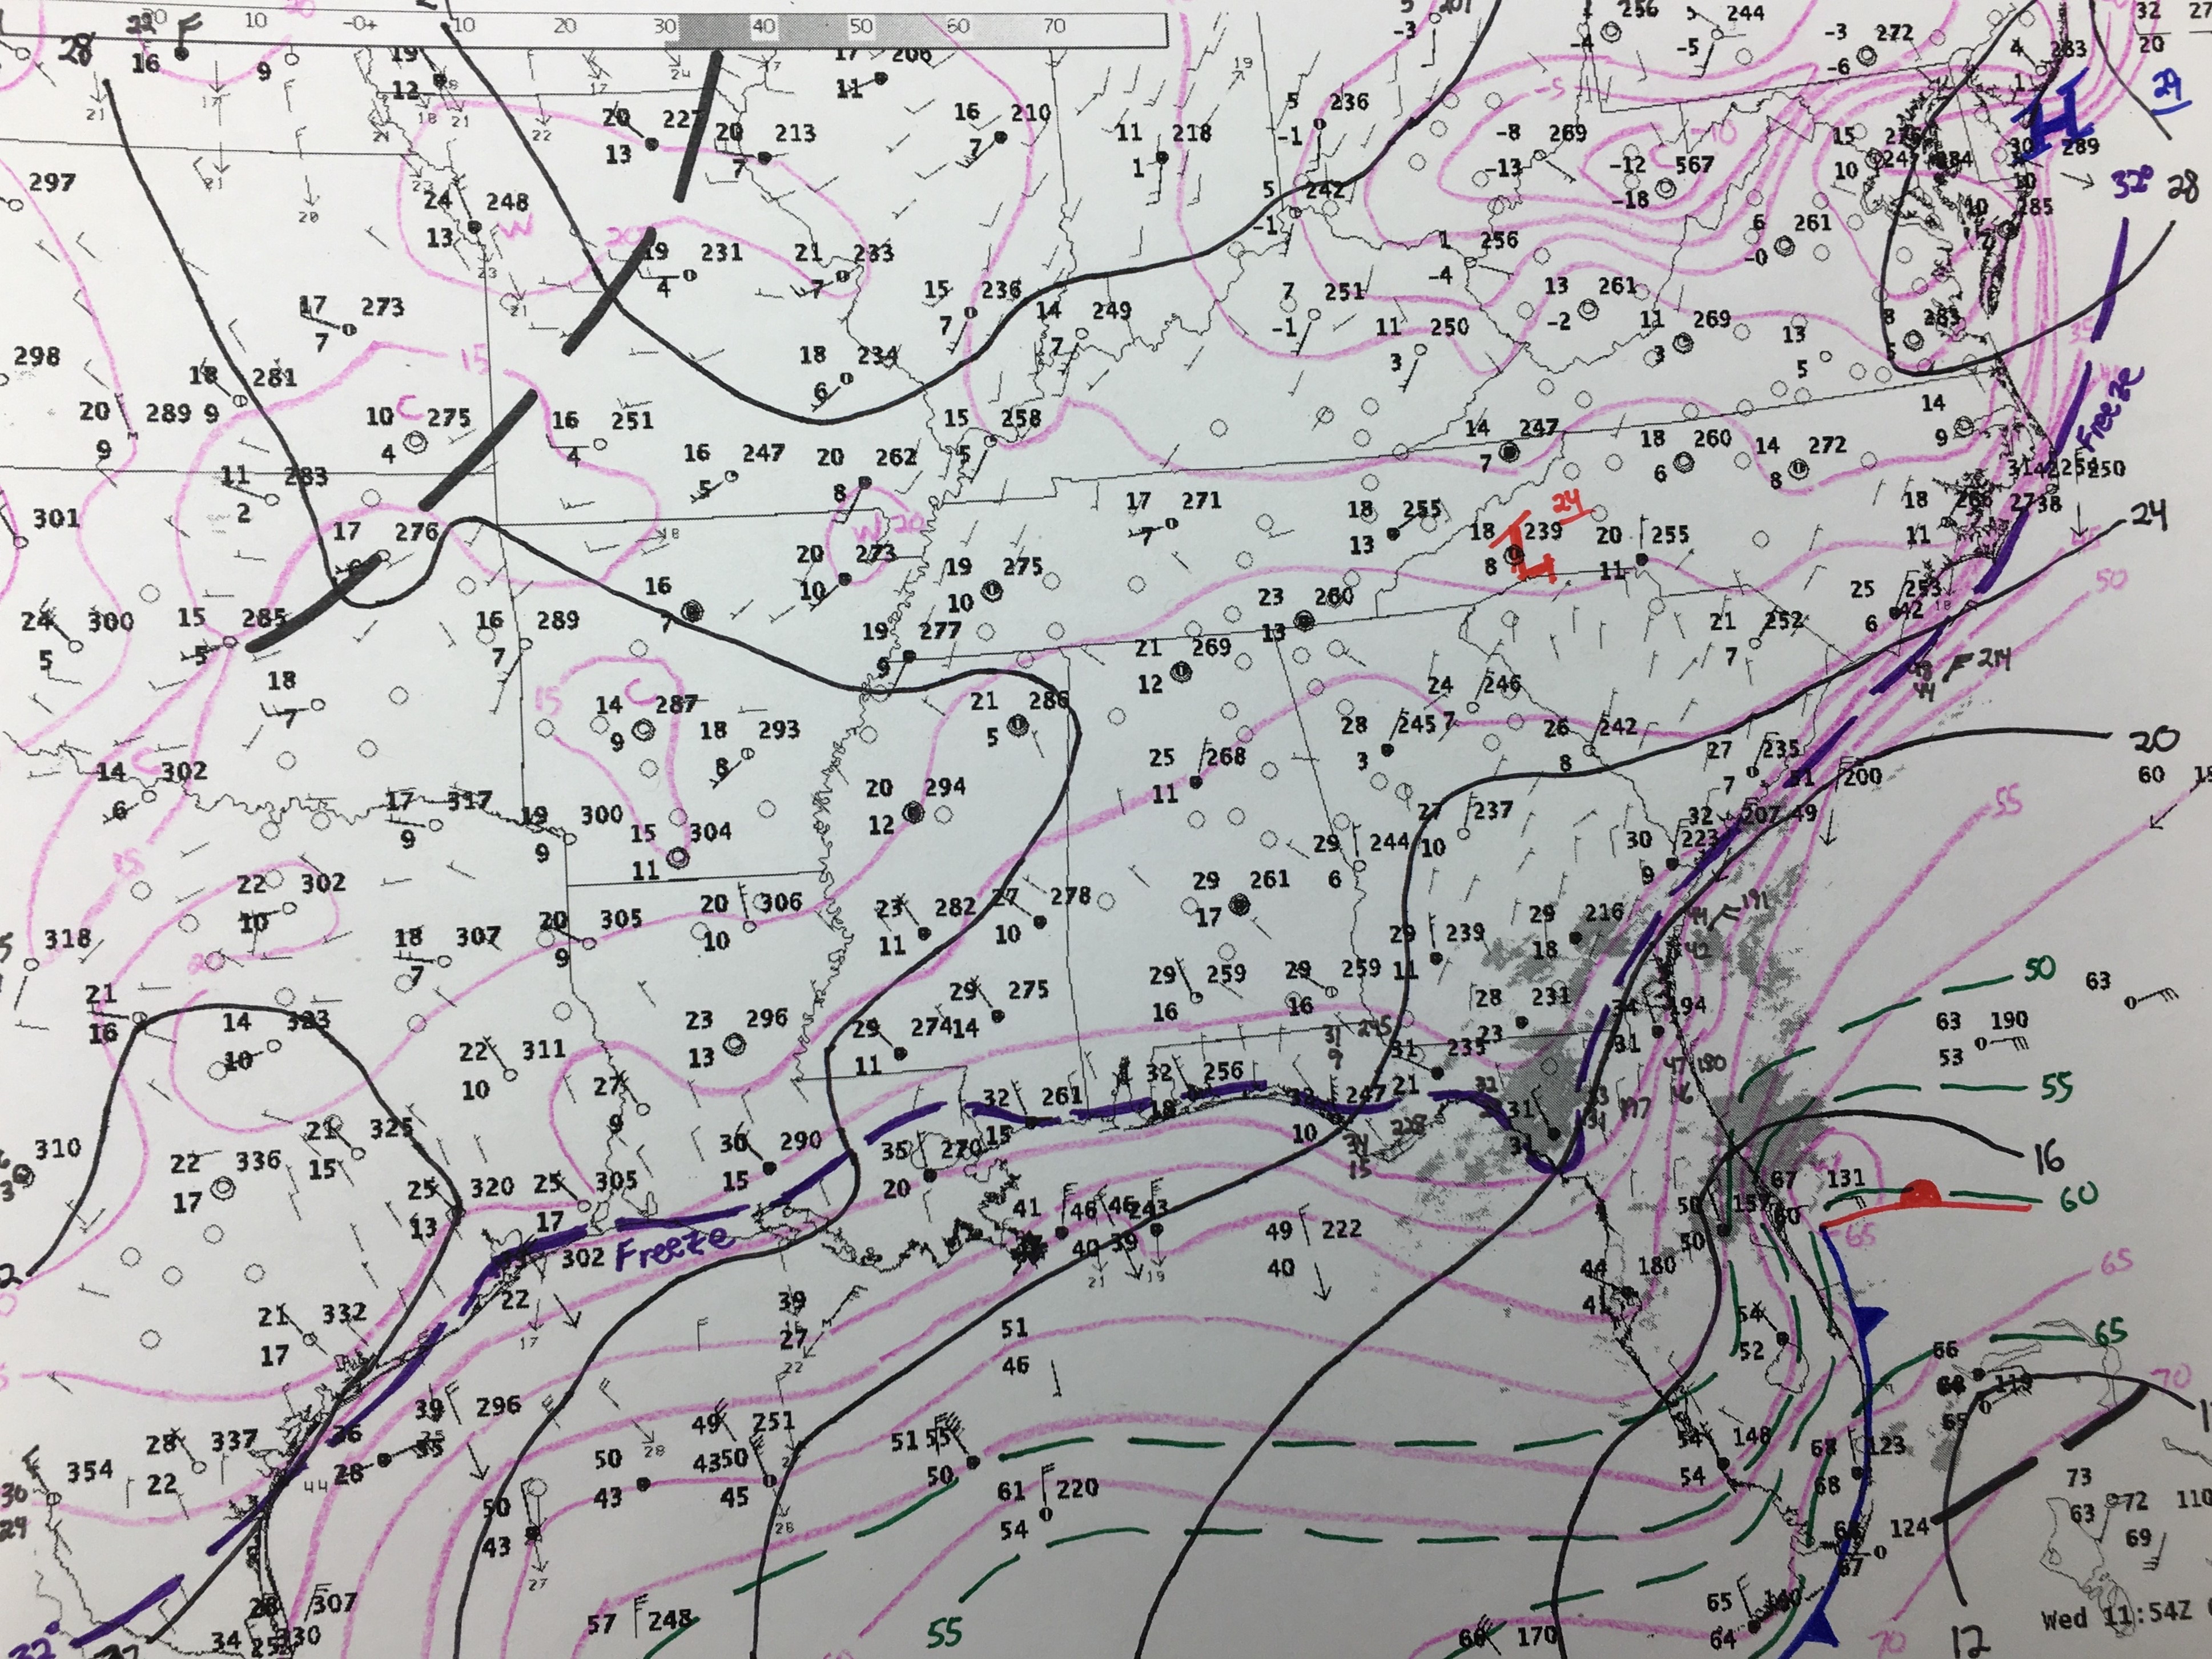
Figure 4. Mean Sea Level Pressure contours (solid black lines), temperature in degrees Farenheit (solid magenta lines), and the surface freezing line (dashed purple line). Background image is radar composite at 0700 EST. Standard front and trough notation.
Why was there such a mix of precipitation, especially since there were freezing temperatures all the way down to the coast? Meteorologists often use the term “cold dome of high pressure” when referring to the cold airmasses behind cold fronts. When viewing cold airmasses in three dimensions, and using a particular weather parameter (potential temperature), one can actually see a dome shape to the cold air. Thus the edges of these “cold domes” are quite shallow, and the coldest air is located near the ground.
Figure 5 shows the vertical temperature profile of the atmosphere in Tallahassee around 7 am EST, and clearly shows the arctic air only extends up to about 1600 feet AGL. Above this layer there is a 3,000 feet layer of above-freezing temperatures in the lower portions of the clouds, where the air was being “warmed” by strong south to southwest winds ahead of the approaching upper-level disturbance. This layer is just deep and warm enough to melt most of the snow falling through it, even though the upper portions of the clouds contain snow. Farther to the south and east of Tallahassee this melting layer is even deeper and warmer, resulting in mainly freezing rain (as the completely melted snow freezes on impact with the surface). In Tallahassee, however, some of the liquid water drops are able to re-freeze into ice pellets (sleet) while falling through the cold, dry air between the clouds and the ground, where temperatures are in the 20s.

Figure 5. Precipitation type based on RAOB data and surface observations at Tallahassee, Florida, at 7 am EST. At around this time there were reports of light freezing rain, sleet, and snow in the Tallahassee area.
Between 7 and 8 am EST the upper-level winds were deforming the area of clouds and precipitation so that a distinct back edge was developing just west of Tallahassee. Air was ascending rapidly within the narrow zone ahead of this drying (Figure 6), increasing the size and number of snowflakes in the upper portions of the clouds. The increase in precipitation, indicated by the higher reflectivity values on radar, allowed most of the snow to reach the surface. It is in this narrow band that the precipitation finally changed to all snow, with large, wet flakes that accumulated quickly on grass and other cold surfaces.
In most of north Florida this changeover was short lived, lasting less than half an hour, and accounting for the very low accumulation totals. Interestingly, as the heaviest precipitation passed to the east of Tallahassee, the precipitation changed to light sleet before ending. (It’s common to see this back-and-forth change in precipitation type in regions where temperature profiles are marginally cold enough for snow, and the precipitation intensity changes). In south Georgia the snow band moved a little slower, allowing for greater accumulations around Valdosta and the surrounding regions. Farther east across north Florida, the precipitation continued mostly as light freezing rain, though a few snow flurries were reported as the precipitation ended during the morning.

Figure 6. Radar composite of reflectivity at 0755 EST, at the time snow is occurring across most of Leon County. Note the darker greens and yellows (highlighted) indicating a greater amount of hydrometeors and/or wet snow (both of which yield greater reflectivity values).
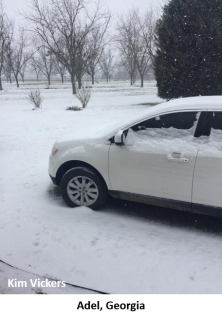
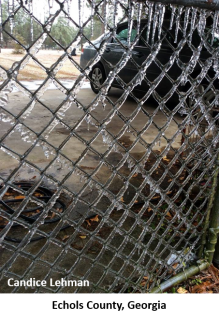
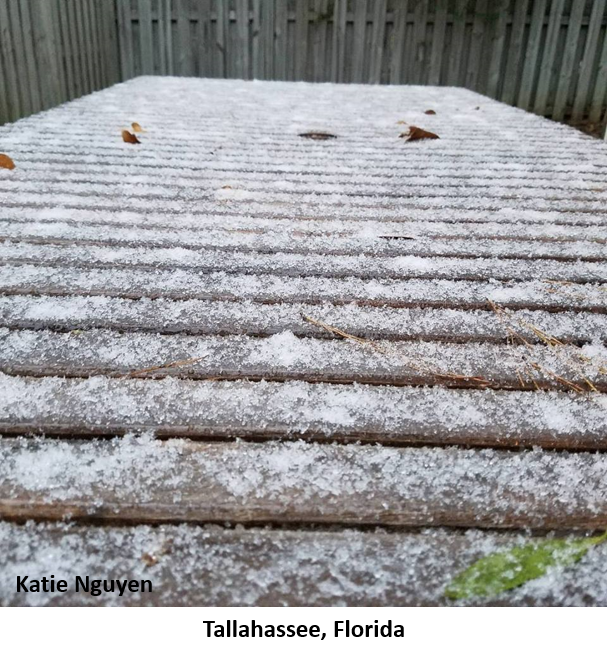
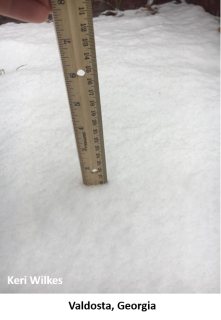
Event Photos


Event write-up by Jeff Fournier with web page created by Justin Pullin and Mark Wool.

