| Click anywhere on the map for the forecast for that location. Turn "on and off" the various weather parameters using the display options. Hover over a highlighted area to see the hazard. | Map Display Options | • SPOT Forecast • | ||||||||||||||
|
2024 Operating Plans: IA MN WI
|
|
|
||||||||||||||
| Fire Weather Planning Forecast | Discussions/Outlooks | Point Forecasts |
|
NEW! Tabular Forecast (give feedback) |
*NOTE: point forecasts are only updated during the fire weather season, typically spring through late fall
|
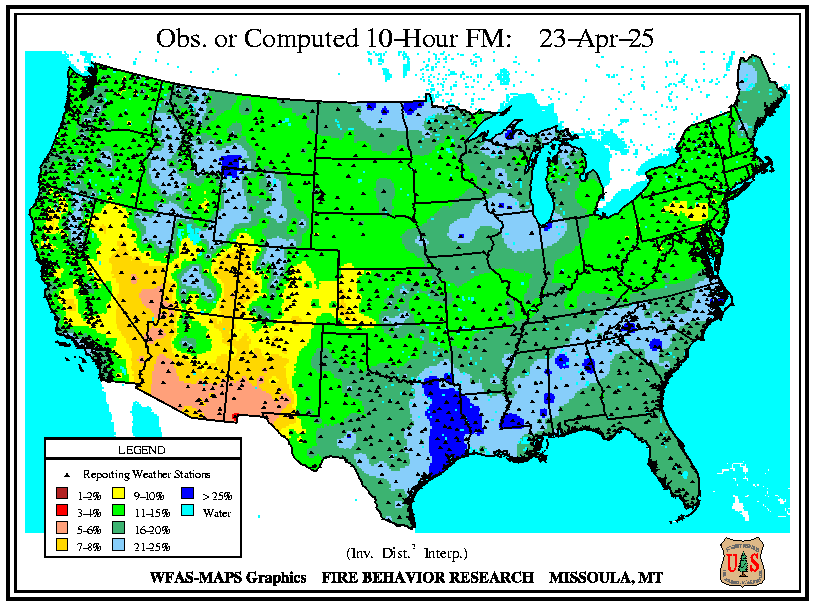 10 hr fuel moisture |
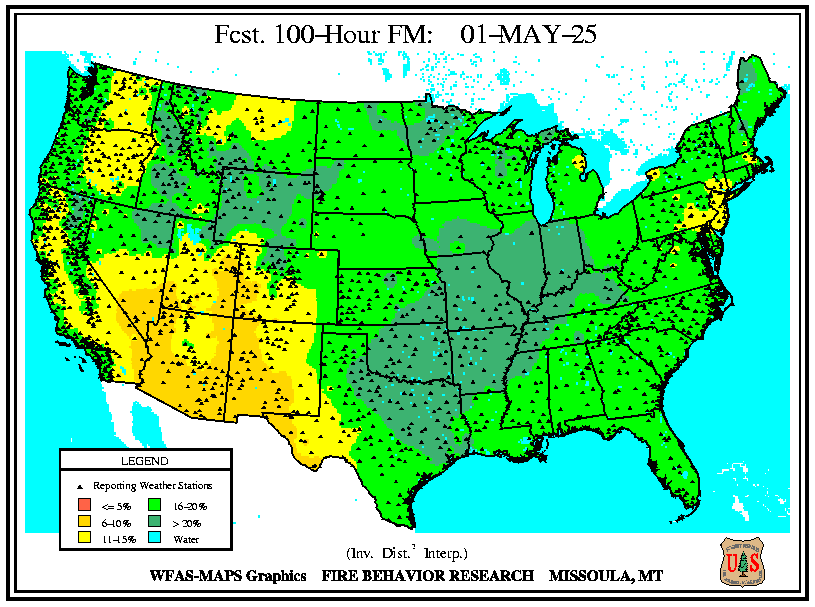 100 hr fuel moisture |
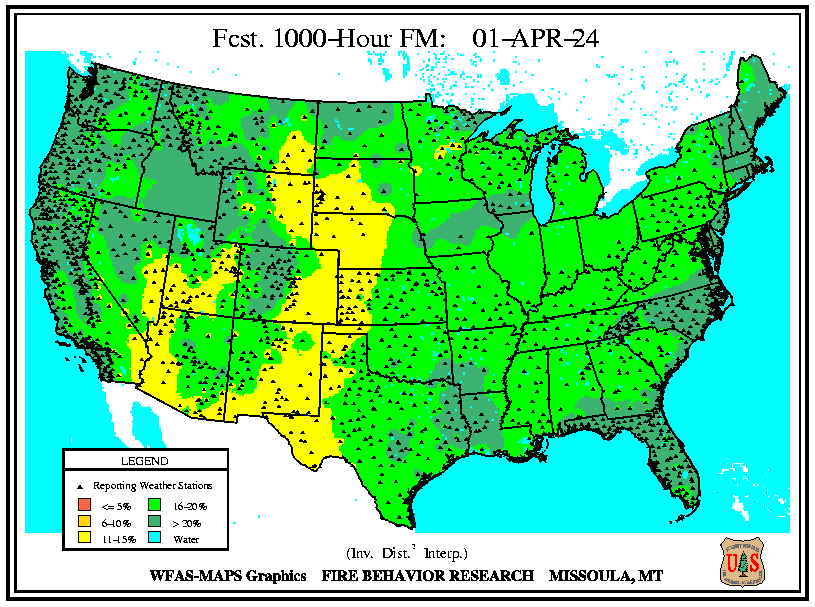 1000 hr fuel moisture |
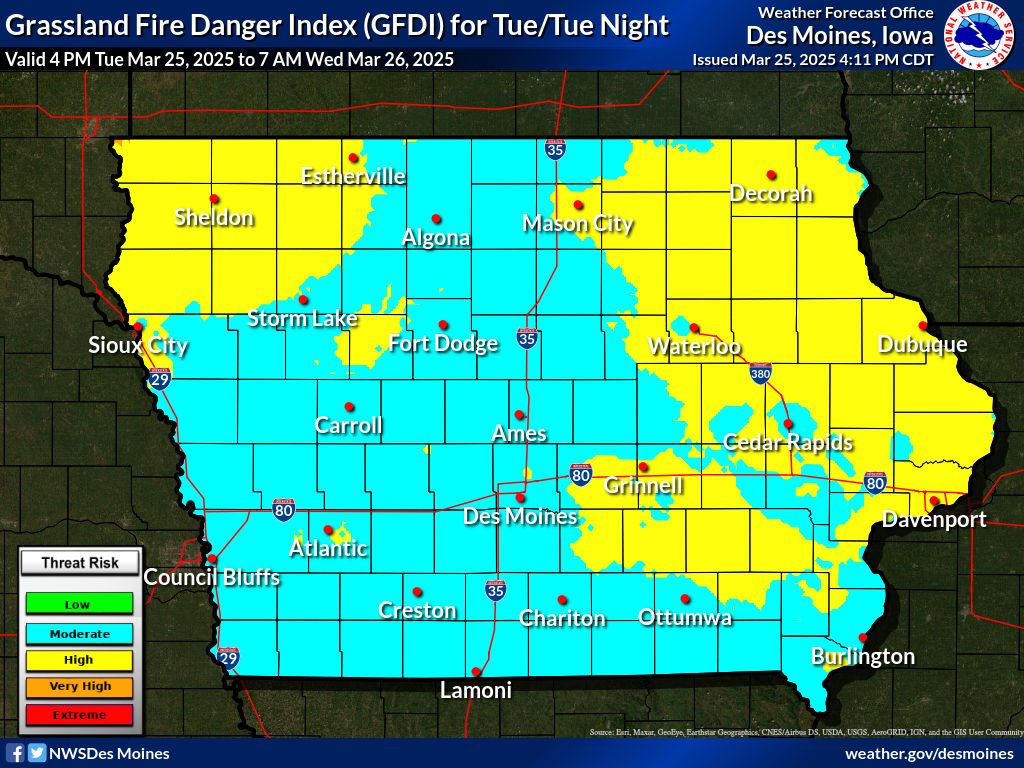
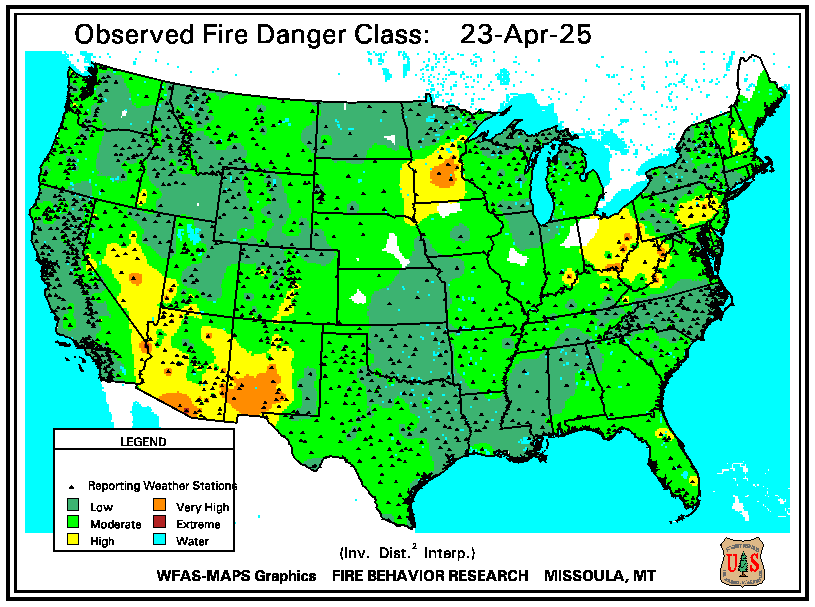 Fire Danger |
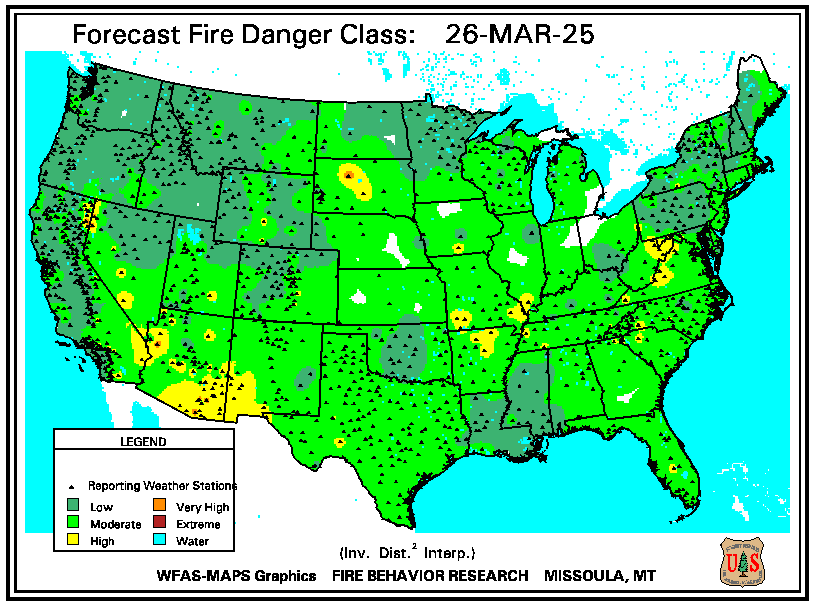 Forecast Fire Danger |
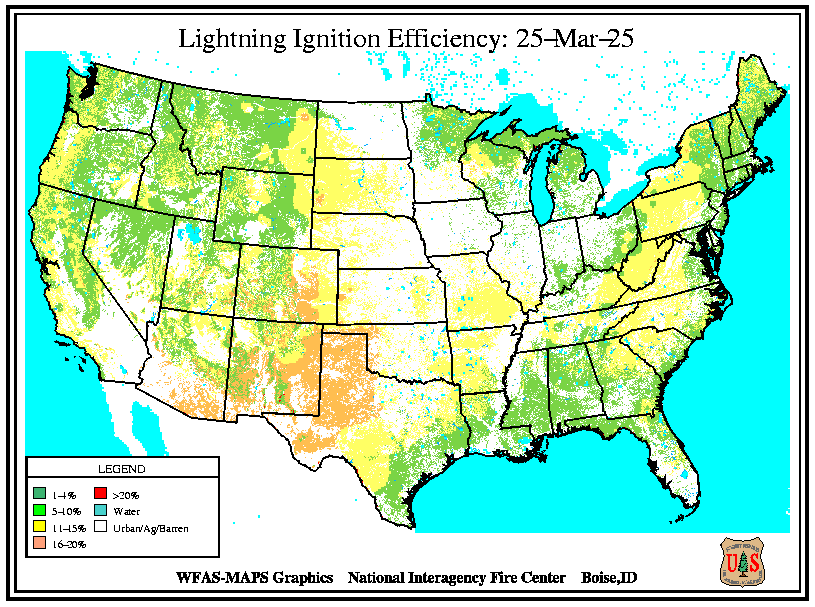 Prob of Ignition |
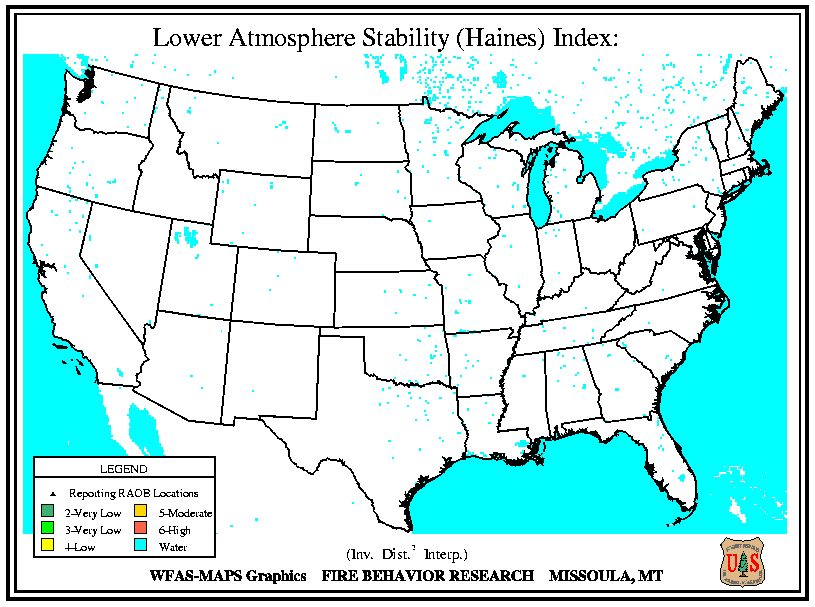 U.S. Haines Index |
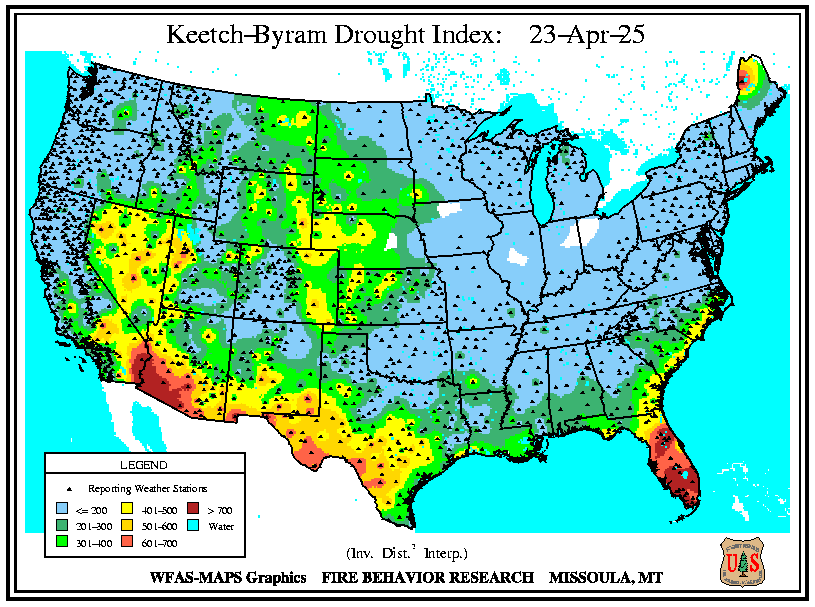 Keetch-Byram Drought Index |
 Palmer Drought Index |
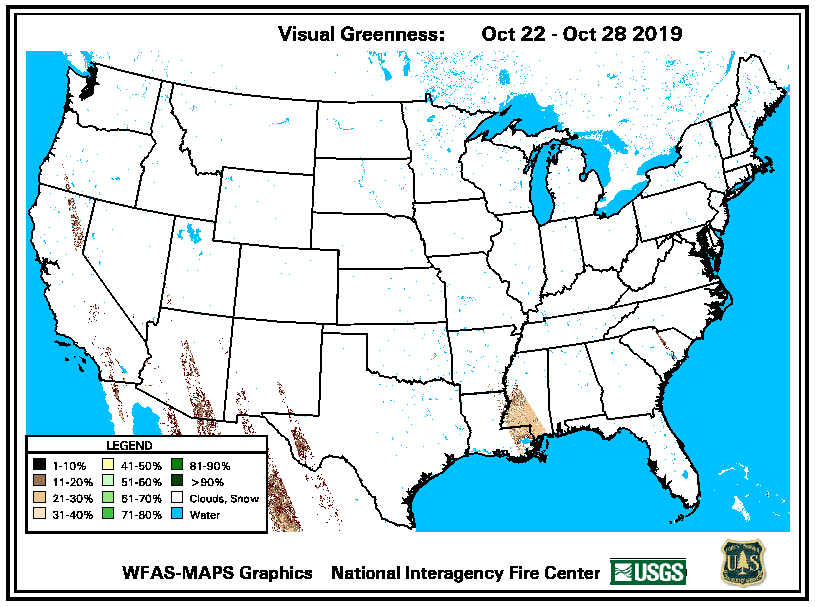 Visual Greenness |
| Iowa | Minnesota | Wisconsin | ||
|
|
|
|||||||||||||||||||||||||||||||||
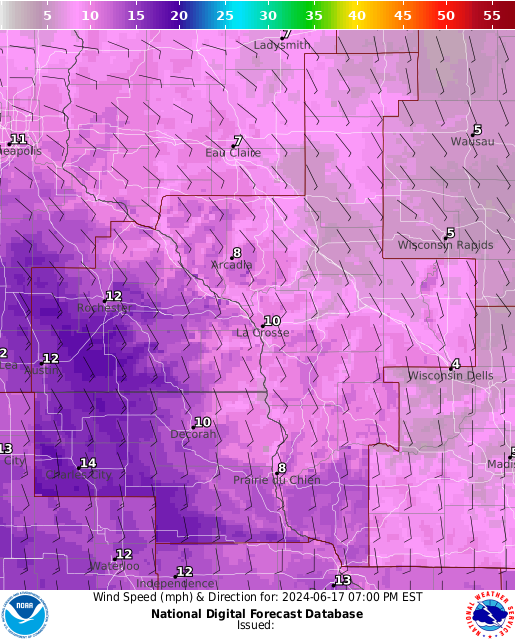
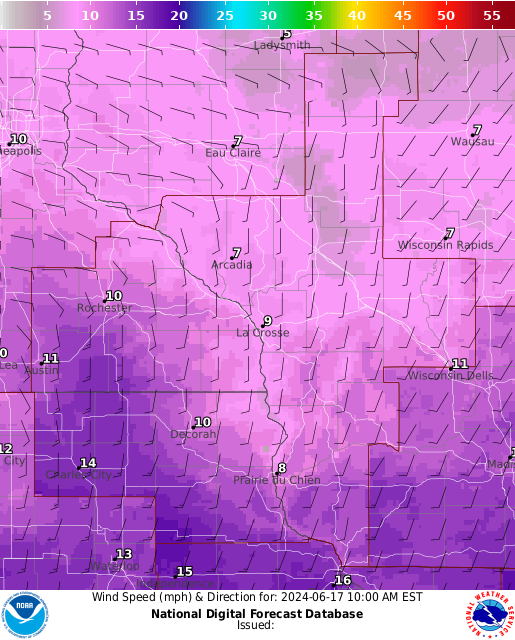
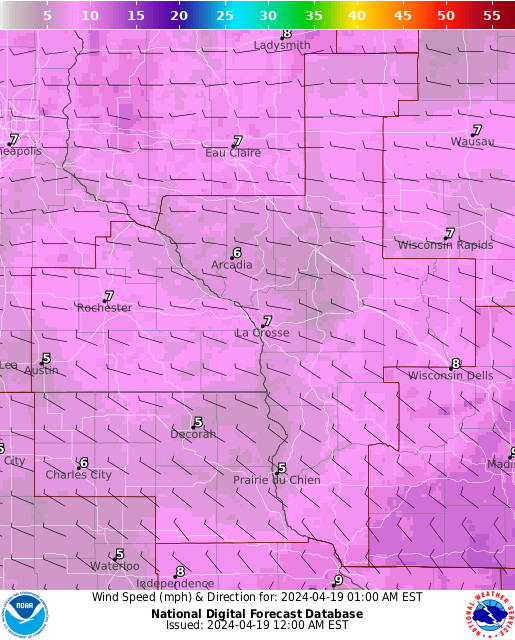
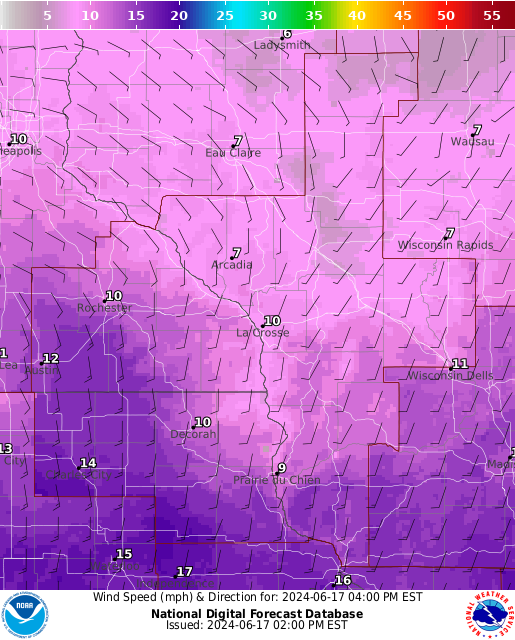
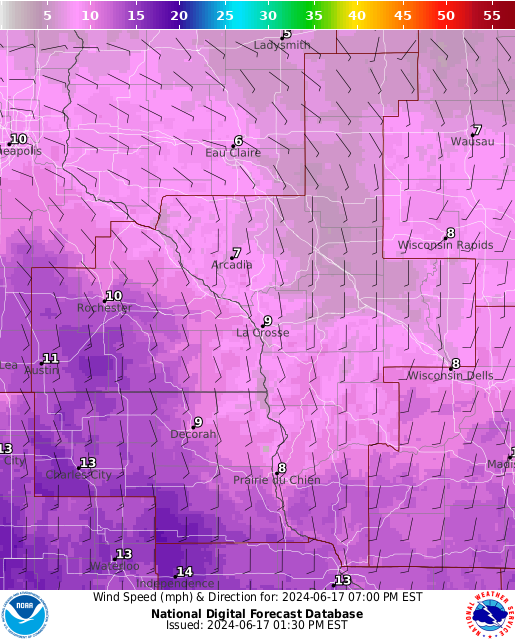
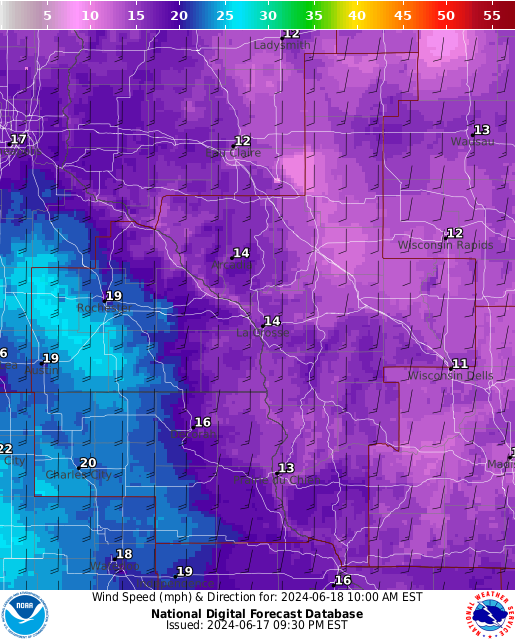
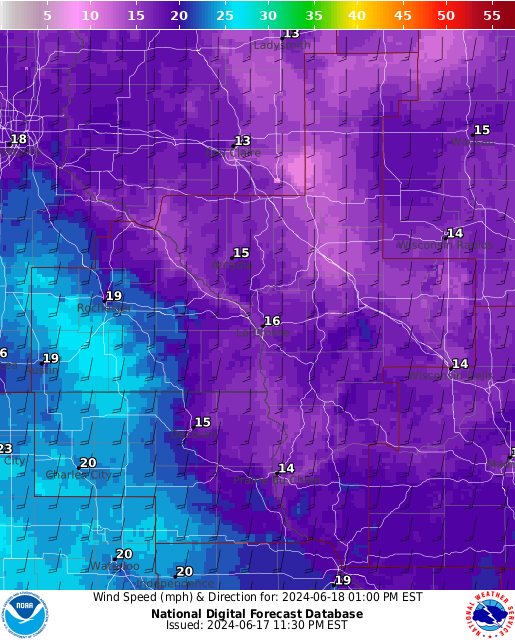
| Forecast Winds | |||||||
| The graphics below are for wind speeds/direction, from the most current time to 24 hours. | |||||||
 |
 |
 |
 |
 |
 |
 |
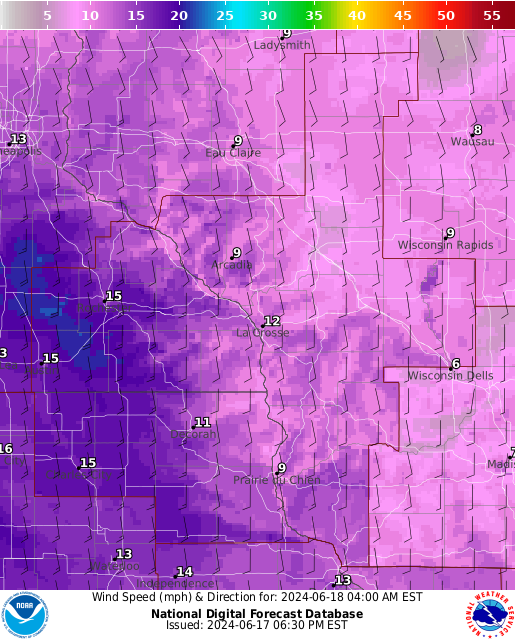 |
| Most Current | 24 hours | ||||||
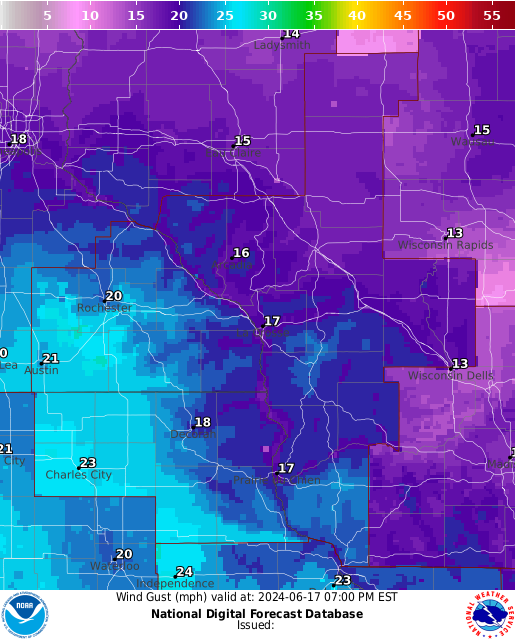
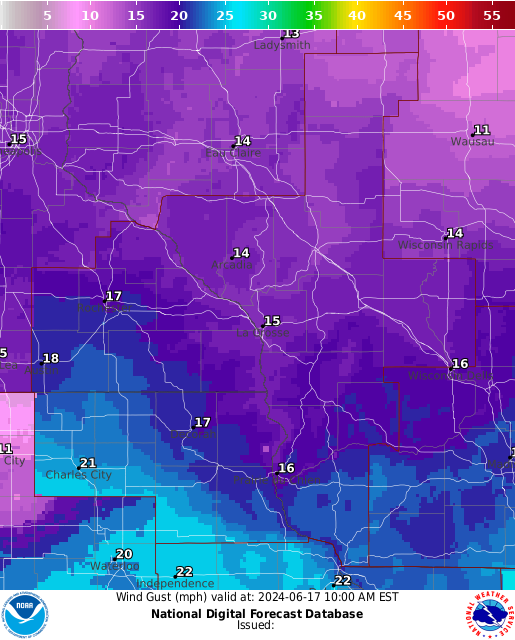
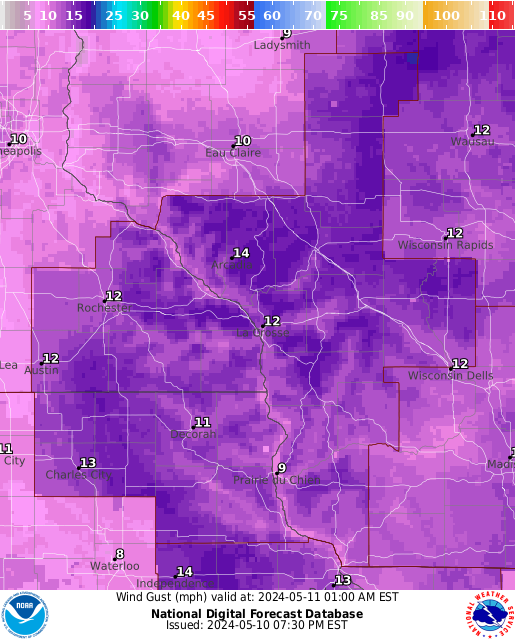
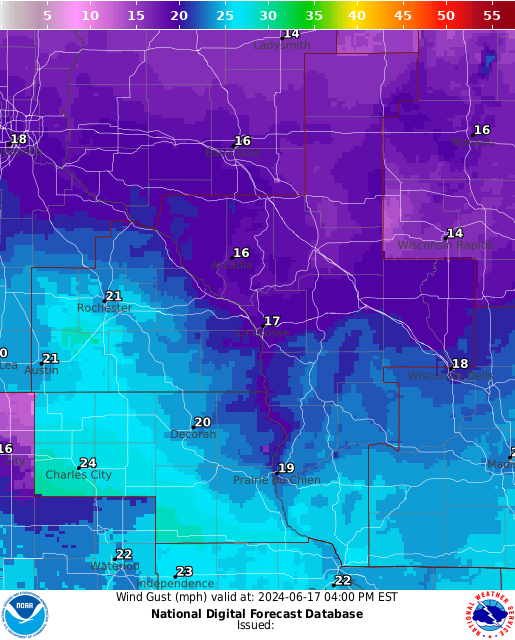
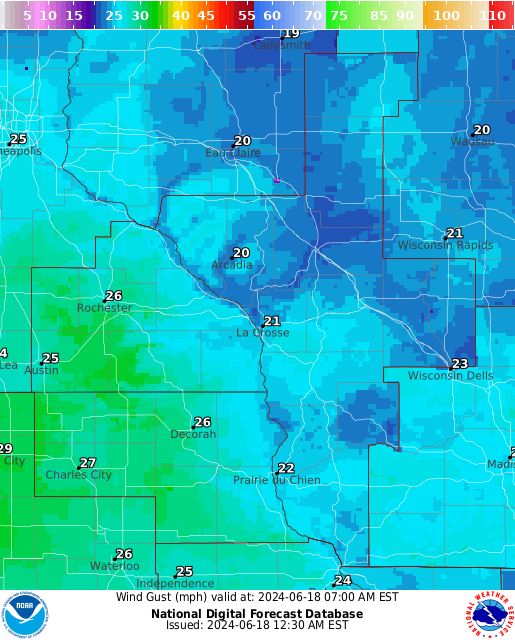
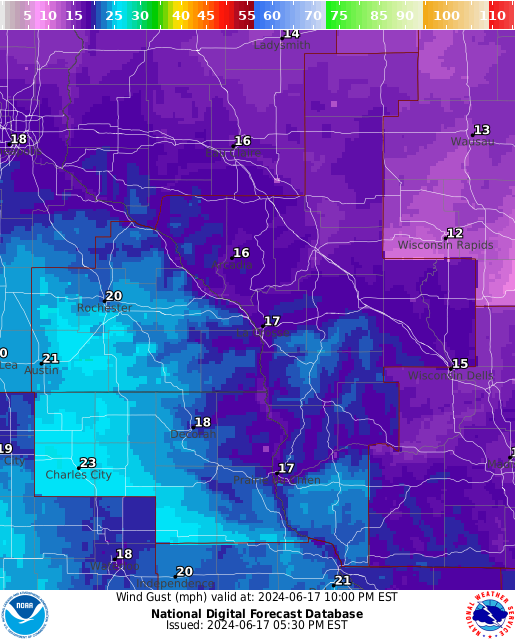
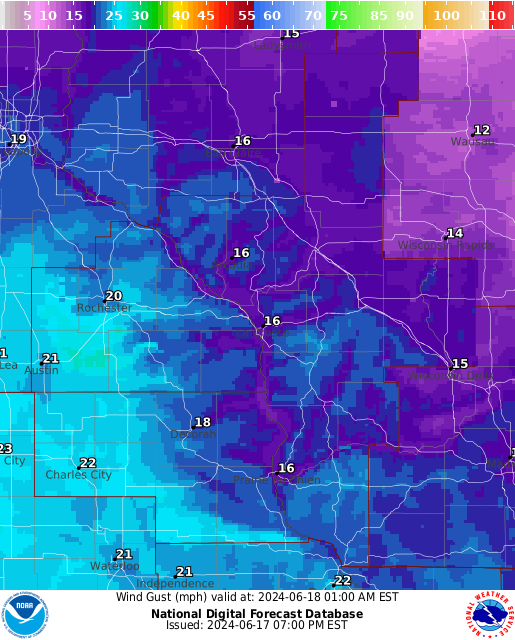
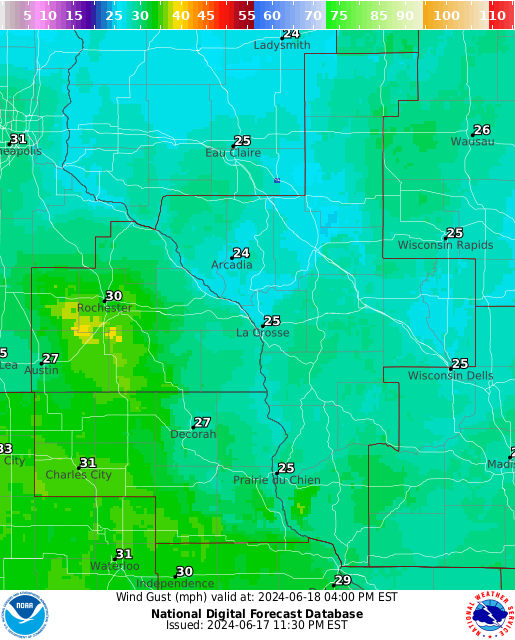
| Forecast Wind Gusts | |||||||
| The graphics below are for wind gusts, from the most current time to 24 hours. | |||||||
 |
 |
 |
 |
 |
 |
 |
 |
| Most Current | 24 hours | ||||||
| Forecast Haines Index | |||||||
| The graphics below are for the haines index, from the most current time to 24 hours. | |||||||
 |
 |
 |
 |
 |
 |
 |
 |
| Most Current | 24 hours | ||||||
| Forecast Mixing Heights | |||||||
| The graphics below are for mixing height, from the most current time to 24 hours. | |||||||
 |
 |
 |
 |
 |
 |
 |
 |
| Most Current | 24 hours | ||||||
| Forecast Transport Winds | |||||||
| The graphics below are for transport winds, from the most current time to 24 hours. | |||||||
| Most Current | 24 hours | ||||||
| Forecast Ventilation Rates | |||||||
| The graphics below are for ventilation rates, from the most current time to 24 hours. | |||||||
 |
 |
 |
 |
 |
 |
 |
 |
| Most Current | 24 hours | ||||||


 Follow us on YouTube