| Arctic Oscillation Impacts on West Central and Southwest Florida |
| Most images on this page can be magnified by clicking, and resized back to original size with a second click. |
| Overview: | ||||||
The Arctic Oscillation (AO), has been shown to have a big influence on temperatures across the eastern two-thirds of the United States during the winter months. The AO is a rather short term change usually on the order of a few days to a few weeks, compared to El Niño/La Niña which last for months, sometimes years when it comes to La Niña. It is known that there is a teleconnection, or strong statistical relationship between the weather in the Arctic and weather in the mid-latitudes, especially during the winter months. When the AO is in the negative phase there is higher-than-normal pressure over the polar region and lower-than-normal pressure at about 45 degrees north latitude. The negative phase allows cold air to plunge into the Midwestern/Eastern United States and Western Europe, and storms bring rain to the Mediterranean. The positive phase brings the opposite conditions, steering ocean storms farther north and bringing wetter weather to Alaska, Scotland, and Scandinavia and drier conditions to areas such as California, Spain and the Middle East. |
||||||
|
||||||
| Monitoring: |
On a daily basis the AO is calculated and model ensemble forecasts are made out 14 days by the Climate Prediction Center. These observations and forecasts are plotted with the first panel below showing the observed AO index (black line) plus forecasted AO indices from each of the 11 GFS ensemble members starting from the last day of the observations (red lines). Then the ensemble mean forecasts of the AO index are obtained by averaging the 11 GFS ensemble members (blue lines), and the observed AO index (black line) is superimposed on each panel for comparison. For the forecasted indices (lower 3 panels), the yellow shading shows the ensemble mean plus and minus one standard deviation among the ensemble members, while the upper and lower red lines show the range of the forecasted indices, respectively. As can be seen in the image below the forecastability of the AO index decreases as you go out in time with the 7 day forecast usually pretty close while the 14 day can be way off the mark. |
 |
| AO/ENSO Correlation: |
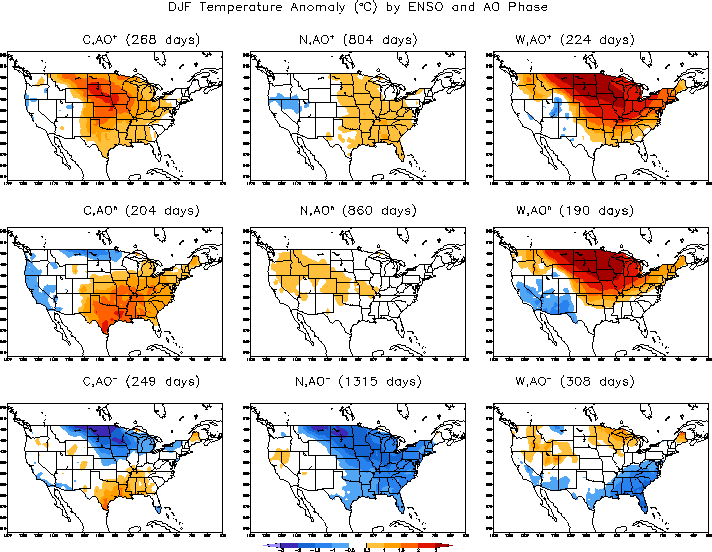
There is also a correlation between the AO and ENSO phase as seen in the images below. Temperature anomalies indicate that across West Central and Southwest Florida we tend to see a better chance of cold during winters when the ENSO is Neutral or Positive (El Niño). The code above each map refers to “ENSO phase, AO phase” (i.e. top left image C,AO⺠means La Niña and positive AO). |
 |
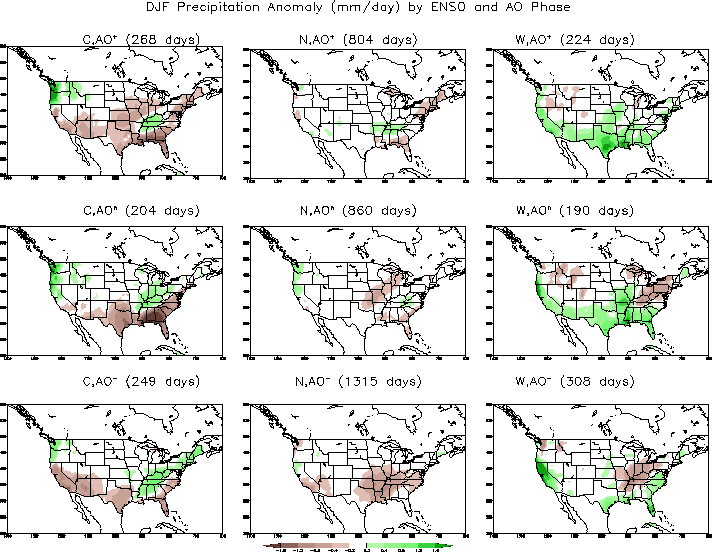
When we look at the precipitation anomalies across West Central and Southwest Florida we see that they lean more toward the ENSO phase with the AO having less impact. |
 |
| Local Impact Examples: | |||
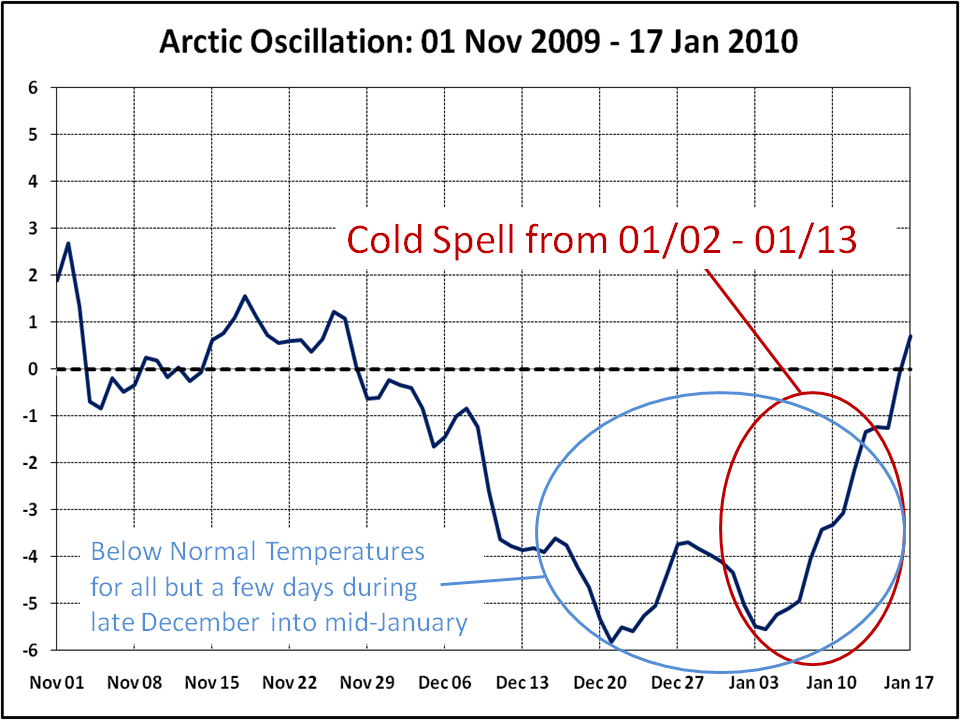
In the graphics below are some examples from past years when the AO was negative. The first from the Winter of 2009-10 during a moderate El Niño shows that during mid-December 2009 into mid-January 2010 the AO dropped well into the negative phase and stayed there for over four weeks with widespread freezing temperatures across West Central and Southwest Florida on several days. |
|||
 |
|||
There have also been two previous record long cold spells during weak La Niña ENSO conditions, December 29, 2000 to January 5, 2001 and December 21 to 28, 1995. In the graphs below we see that the AO index during these time periods was well into the negative range for a few weeks. |
|||
|
|||
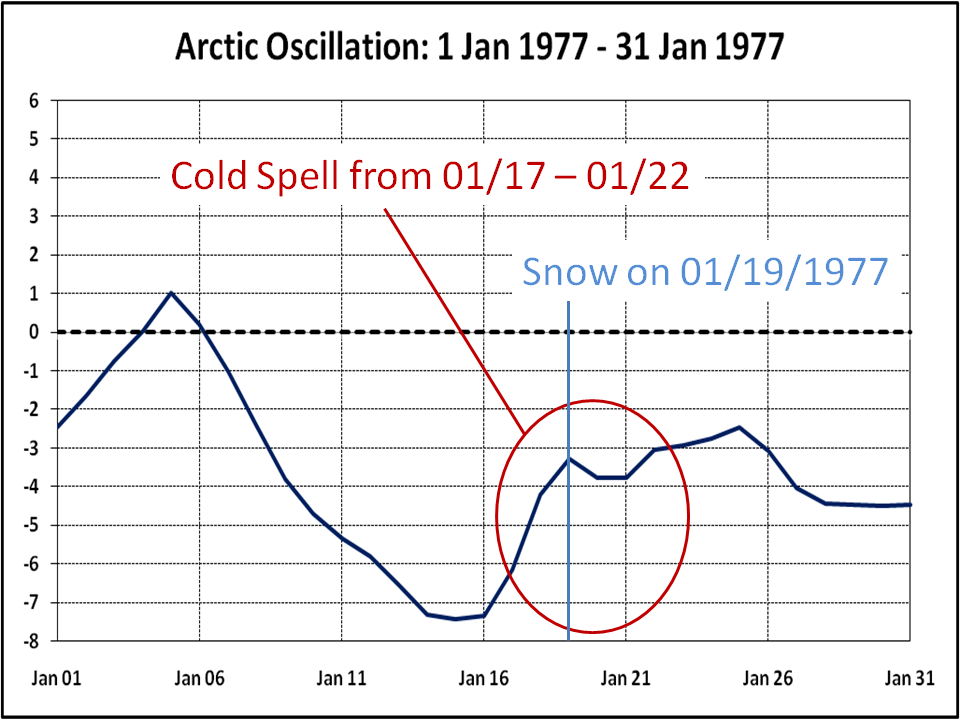
And of course anyone who has lived in West Central and Southwest Florida for any length of time has heard about the infamous day it snowed across much of the Florida peninsula, January 19, 1977. During this winter there was a weak El Niño and if we take a look back at the AO during this time period we see that the index had dropped well below zero, in fact to its lowest daily reading then and now of -7.433 on January 15, 1977. Along with the snow there were also five days in a row, January 18 to 22, where temperatures dipped below freezing in the Tampa area, the most consecutive number of days since records began in 1890. |
|||
 |
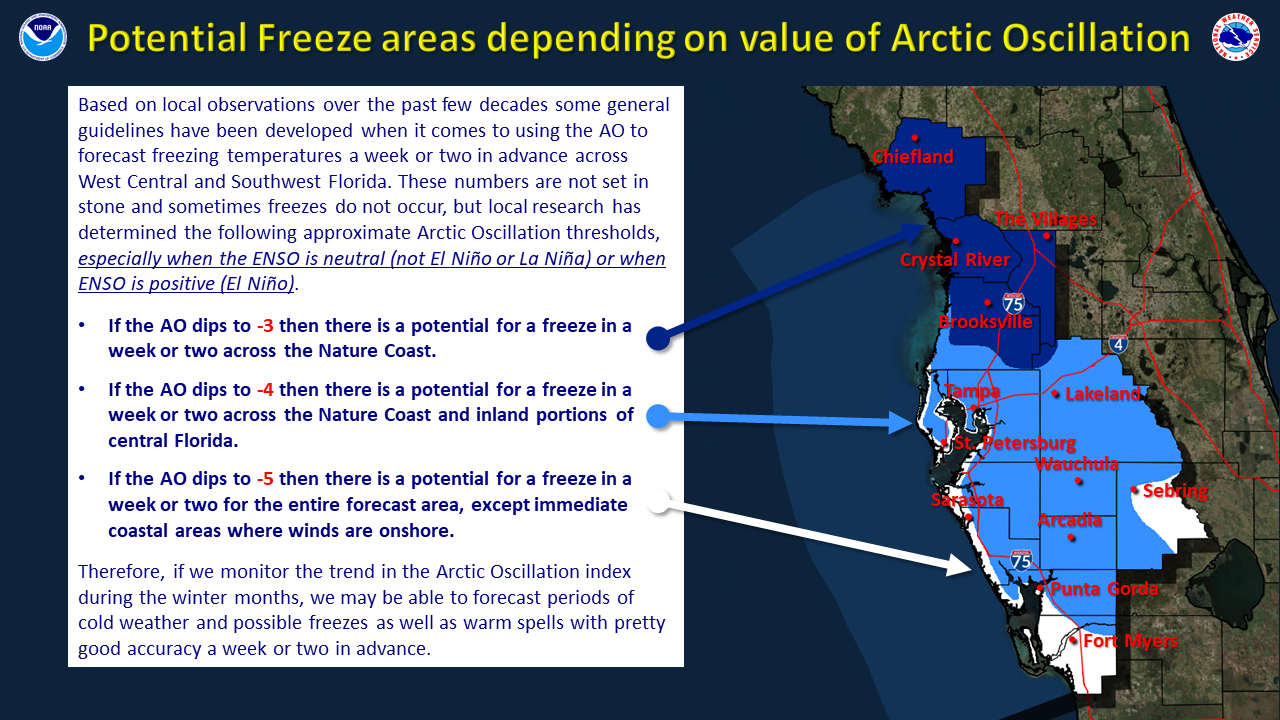
| Local Utilization: |
 |
| Other Web Sites: |
NOAA Climate.gov Arctic Oscillation Page https://www.climate.gov/news-features/understanding-climate/climate-variability-arctic-oscillation Climate Prediction Center AO Page http://www.cpc.ncep.noaa.gov/products/precip/CWlink/daily_ao_index/ao.shtml January 2010 Cold Snap NWS Tampa Bay 2009-2010 Winter Newsletter NOAA Climate.gov ENSO Page https://www.climate.gov/enso Climate Prediction Center ENSO Page http://www.cpc.ncep.noaa.gov/products/precip/CWlink/MJO/enso.shtml |