National Weather Service United States Department of Commerce


Every ten years the National Center for Environmental Information (NCEI - formerly the National Climatic Data Center) calculates a new set of U.S. 30-year normals. So just what are "Normals"? In the strictest sense, a "normal" of a particular variable (e.g., temperature) is defined as the 30-year average. For example, the minimum temperature normal in January for a station in Tampa, Florida, would be computed by taking the average of the 30 January values of monthly averaged minimum temperatures from 1991 to 2020. Each of the 30 monthly values was in turn derived from averaging the daily observations of minimum temperature for the station. In practice, however, much more goes into NCEI's Climate Normals product than simple 30-year averages. Procedures are put in place to deal with missing and suspect data values. In addition, Climate Normals include quantities other than averages such as degree days, probabilities, standard deviations, etc. Climate Normals are a large suite of data products that provide users with many tools to understand typical climate conditions for thousands of locations across the United States.

  Key Takeaways:

  Conventional 30-Year Normals and New Supplemental 15-Year Normals:
  • The first normals were develop in the mid-1930s, when most countries had collected only about 30 years of climate data: 1901-1930.
  • World Meteorological Organization (WMO) requires member states to produce 30-year climate normals every 10 years and provides more guidelines within the WMO Guidelines on the Calculation of Climate Normals (WMO No. 1203).
  • Shorter-period normals, such as the new 15-year normals, are required by some sectors, such as energy, construction, etc., for applications that use normals to predict conditions in the near future.
  • The U.S. is replacing the 1981-2010 normals with the 1991-2020 normals and supplementing with a full set of new 2006-2020 normals.

 What do the New Normals Say?
  • Warming from 1981-2010 to 1991-2020 is widespread, but not found everywhere across the continental U.S., either in geographic space or time of year, with recent cooling in the north central U.S.

  • Precipitation changes from 1981-2010 to 1991-2020 also vary considerably on a month-to-month basis, but are generally wetter in the central and eastern U.S.
All images on this page can be magnified by clicking, and resized back to original size with a second click.
 
Annual Mean Temperature Change for CONUS   Annual Precipitation Change for CONUS


Taking a look at how the temperatures and precipitation normals have changed compared to the 20th-Century (1901-2000) we see in the images below that there has been some variability over the decades, but most recently we see warming across most of the continental U.S. with wetter conditions over the central and northeast U.S. and drying in the southwest states.

CONUS Annual Temperature Compared to 20th-Century Average
 

CONUS Annual Precipitation Compared to 20th-Century Average


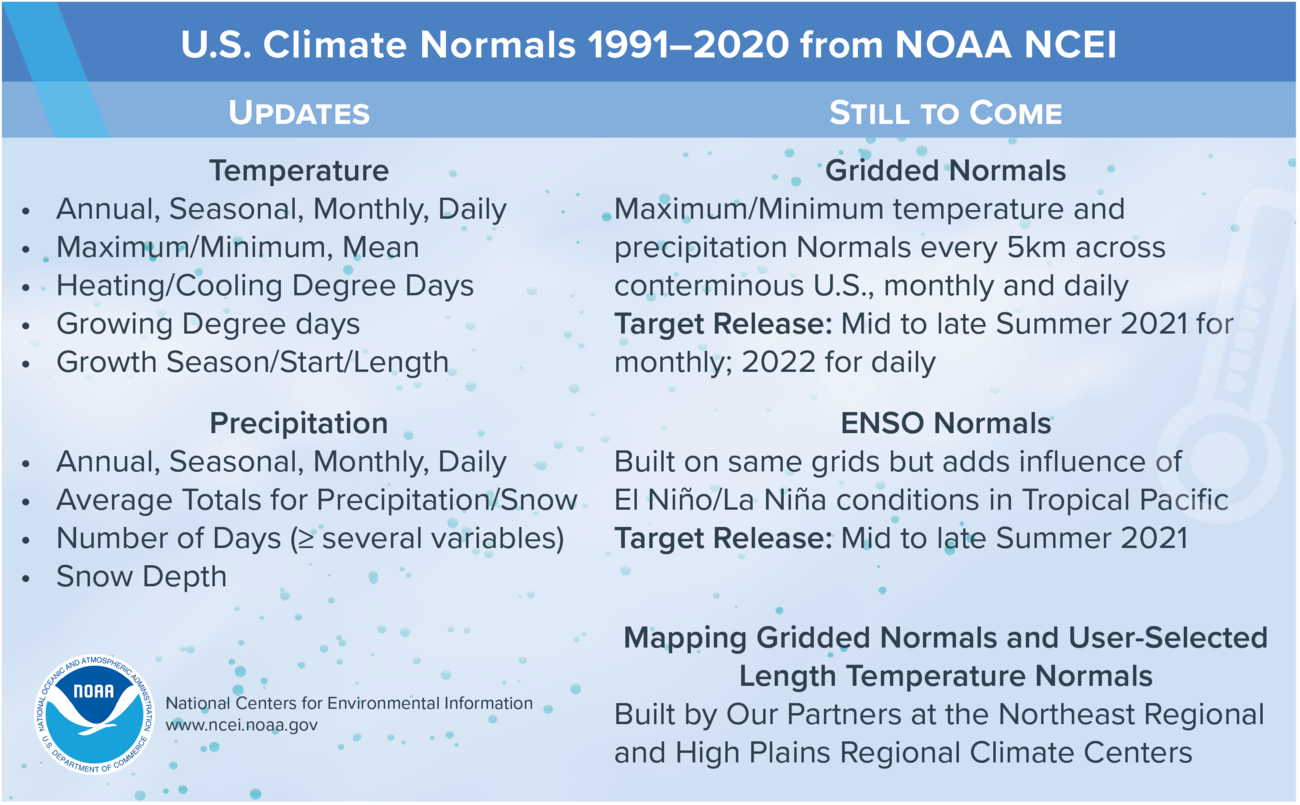
 What’s included in the Normals?
  • Overview:
    • Annual, seasonal, monthly, daily, and hourly statistics
    • Averages, frequencies, terciles, quartiles, and quintiles
    • Temperature, precipitation, snow, dew point, sea level pressure, clouds, and wind


  • Some examples of normals at a weather station:
    • Average January high temperature
    • Average annual precipitation
    • Third quartile of February rainfall (75% of Februaries are below this amount)
    • Average number of July days with a high temperature at or above 90°F
    • Average low temperature on April 28

(Back to Top)