| Dew Point Statistics for West Central and Southwest Florida |
||
If you really want to know just how "dry" or "humid" it will feel outside, look at the dew point instead of the relative humidity. The higher the dew point the greater the amount of moisture in the air, and therefore the muggier it will feel. Across West Central and Southwest Florida we experience a range of dew points throughout the year from those cool winter days with dew points below 30°F to those sweltering summer days when dew points are above 80°F. When the dew points reach these levels in the summer it can lead to heat indices reaching dangerously high levels which can compound the risk for heat-related illnesses. Please visit the NWS Heat Safety Tips and Resources web page for more heat safety information and for local details about heat index and some statistics from across West Central and Southwest Florida visit our Heat Tools and Statistics web page. You can also visit the NWS Experimental Heat Risk page to visualize heat impacts in a new way. This index is supplementary to official NWS heat products and is meant to provide risk guidance for those decision makers and heat-sensitive populations who need to take actions at levels that may be below current NWS heat product levels. |
 |
|
| Most images on this page can be magnified by clicking, and resized back to original size with a second click. |
||
What is the Dew Point? |
||
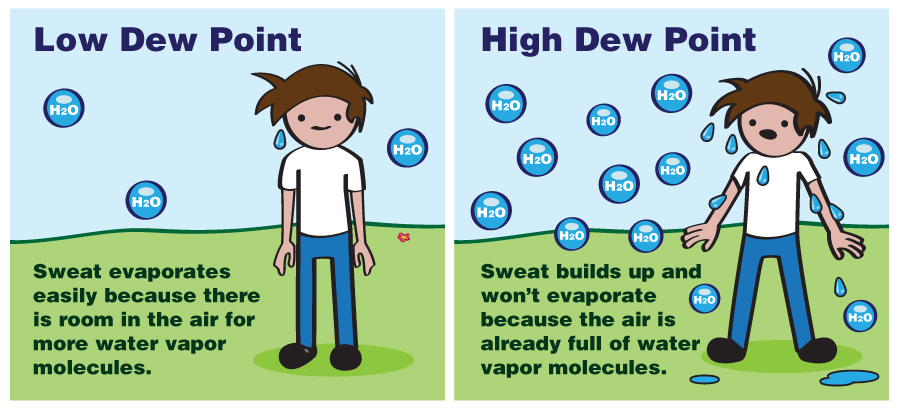
| The dew point marks the temperature at which water vapor will turn into liquid water droplets. This process is called condensation. Condensation is what causes clouds to form, which can then lead to precipitation such as rain, snow, and hail. The dew point will always be the same or lower than the actual outside temperature. The higher the dew point, the greater the amount of moisture in the air. This affects how "comfortable" it will feel outside. When your body gets too hot, it begins to perspire or sweat to cool itself off. If the perspiration is not able to evaporate, the body cannot regulate its temperature. Evaporation is a cooling process. When perspiration is evaporated off the body, it effectively reduces the body's temperature. When the atmospheric moisture content is high, the rate of evaporation from the body decreases. In other words, the human body feels warmer in humid conditions. The opposite is true when moisture decreases because the rate of perspiration increases. The body actually feels cooler in arid conditions. |
||
 |
||
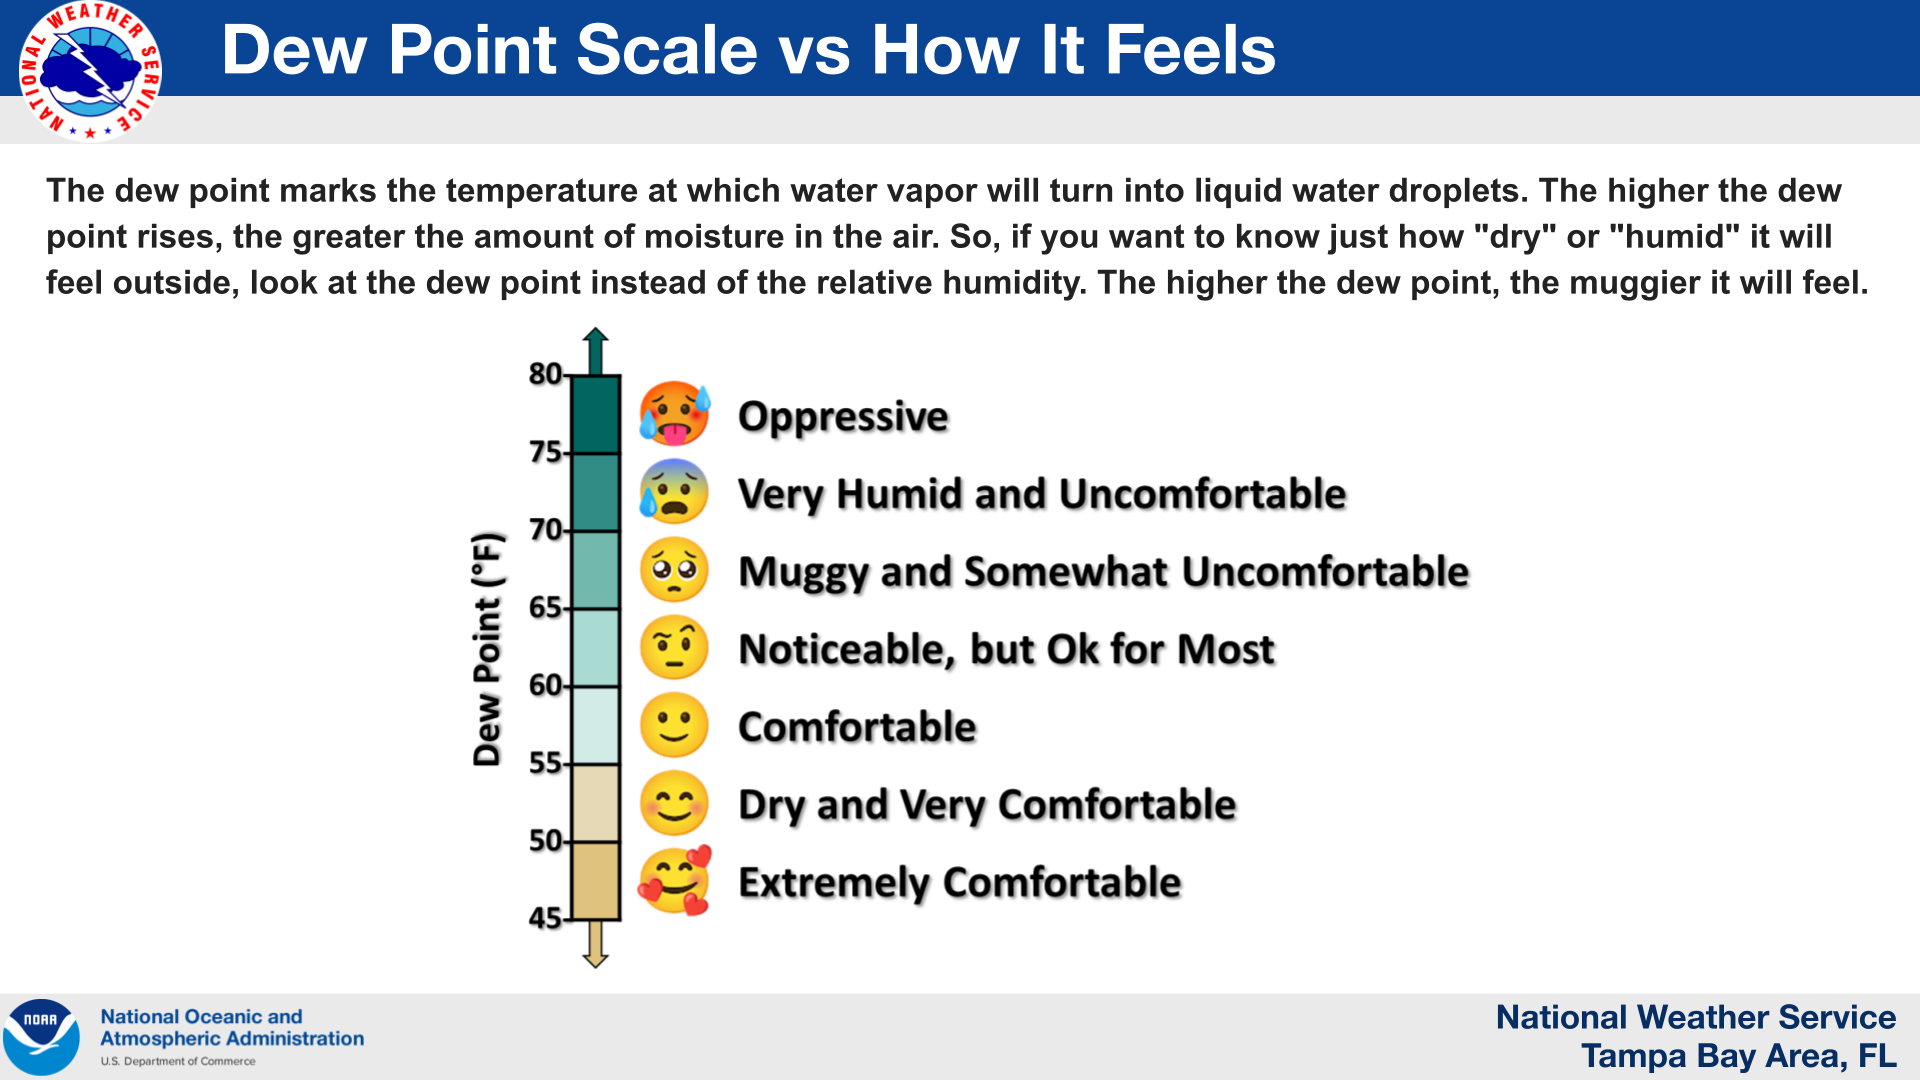
Therefore, if you want to know just how "dry" or "humid" it will feel outside, look at the dew point instead of the relative humidity. The higher the dew point, the muggier it will feel. Below is a general breakdown of how comfortable (or uncomfortable) it feels based on different dew point values. |
||
 |
||
Relative Humidity versus Dew Point |
||
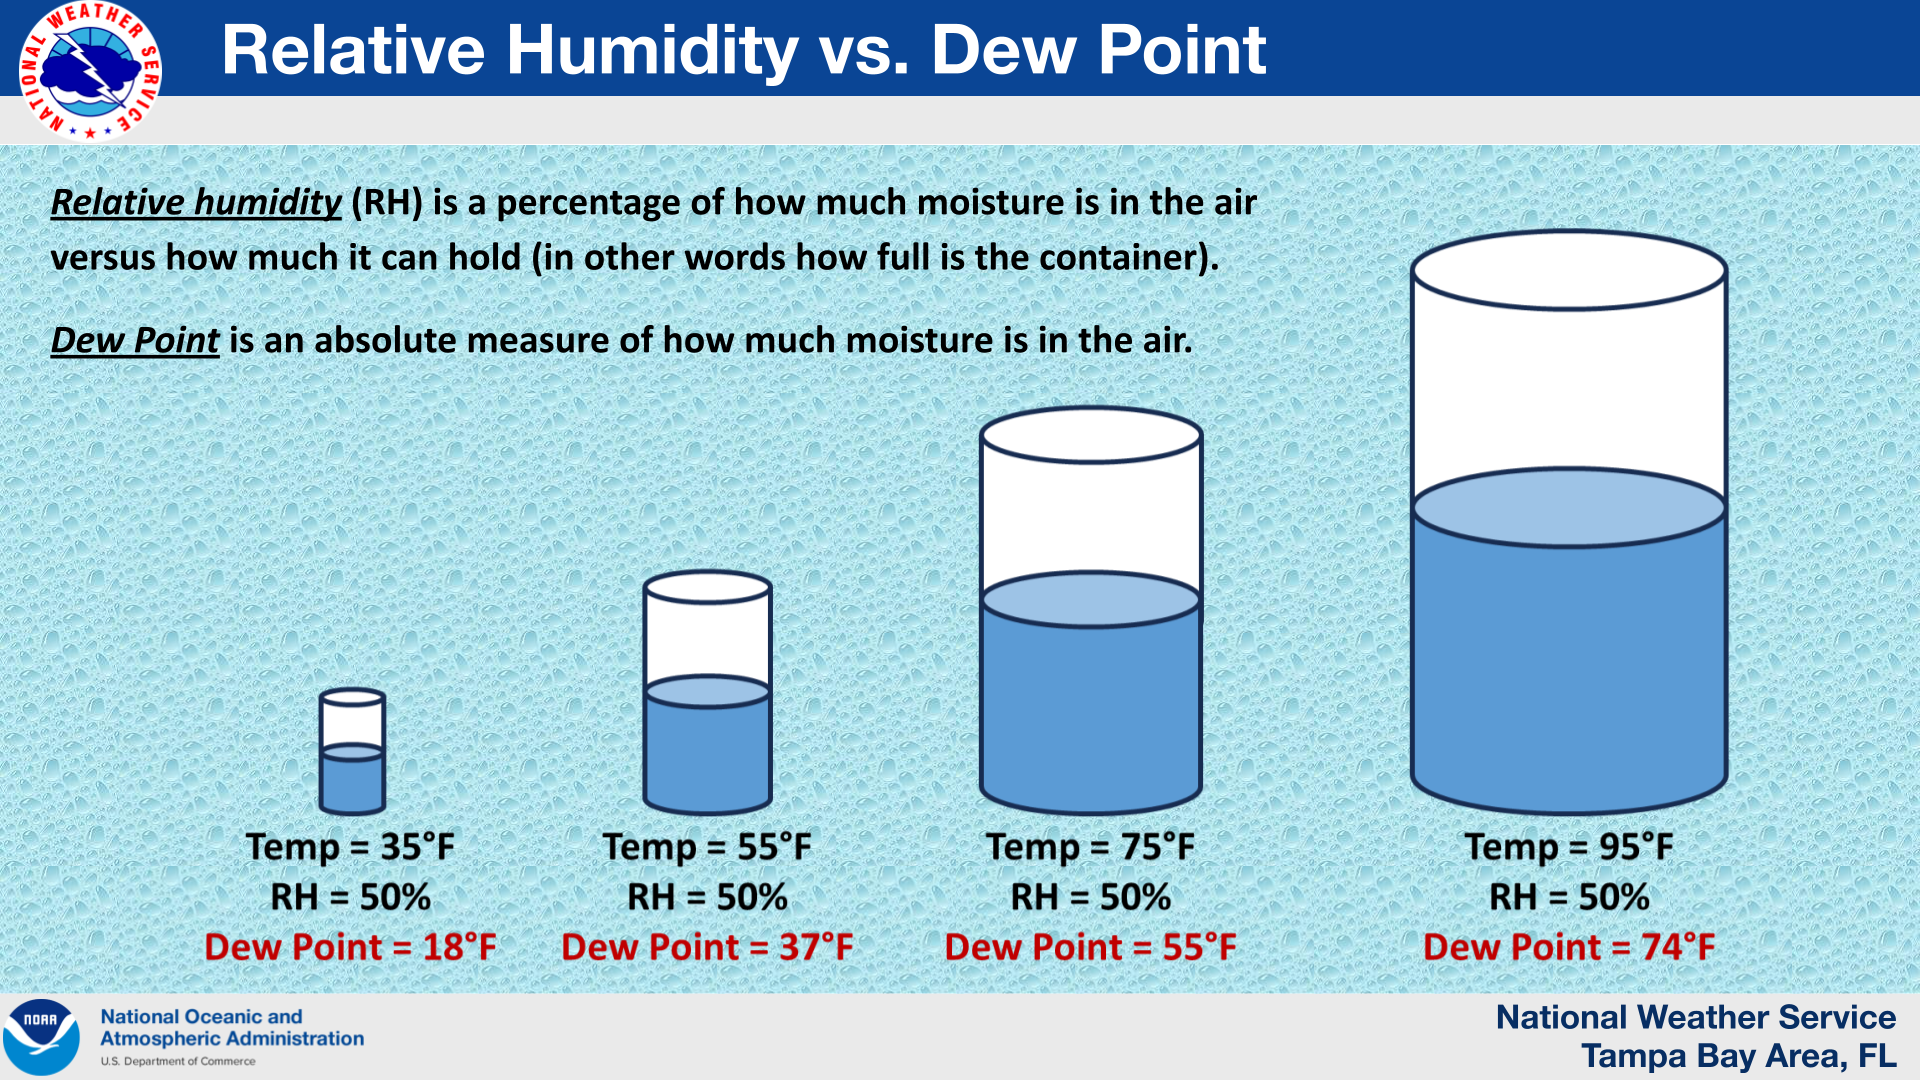
| Relative humidity measures water vapor in the air, but it is compared to the maximum amount of water vapor that can exist in the air at its current temperature. It is written as a percent. Warm air can hold more water vapor, or moisture, than cold air. Therefore, with the same amount of moisture, cold air will have a higher relative humidity and warm air will have a lower relative humidity. The relative humidity is 100% when the air is completely full of water vapor. As mentioned, warm air can hold more moisture and therefore allow the dew point to rise, as demonstrated in the graphic below. This directly affects how "comfortable" it will feel outside. Many times, relative humidity can be misleading. For example, a temperature of 50°F and a dew point of 50°F will give you a relative humidity of 100%, but a temperature of 90°F and a dew point of 69°F produces a relative humidity of 50%. It would feel much more "humid" on the 90-degree day with 50% relative humidity than on the 50-degree day with a 100% relative humidity. This is because of the higher dew point. |
||
 |
||
Tampa Dew Point Statistics: |
||
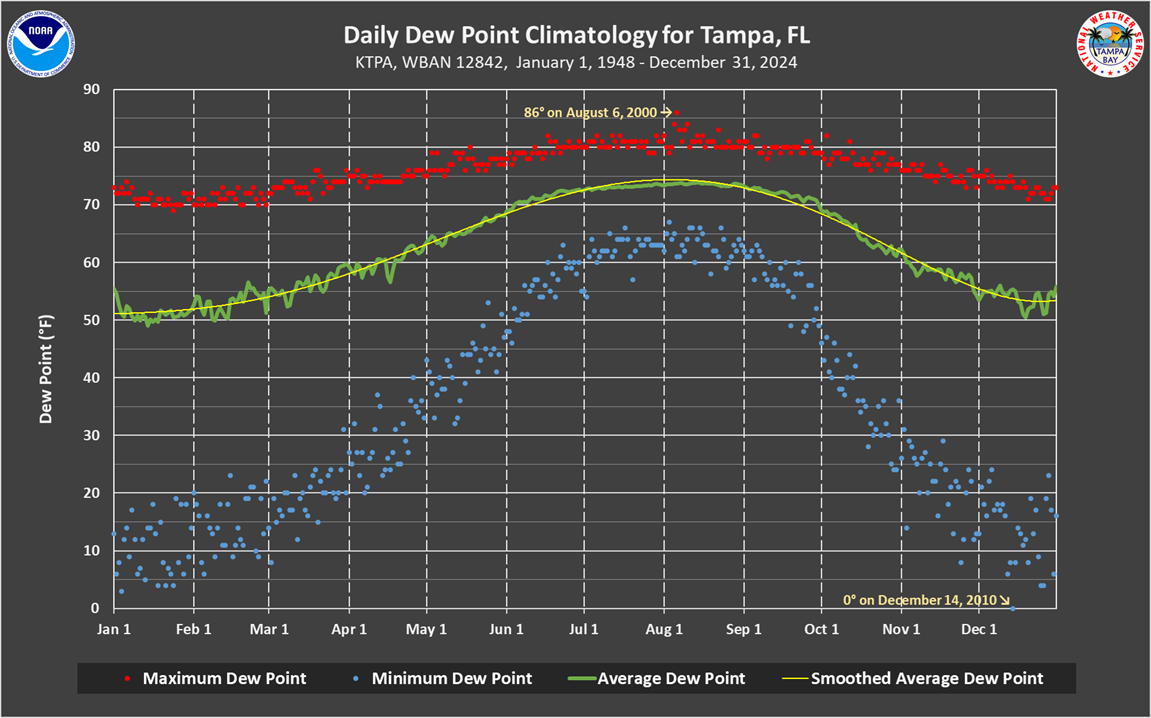
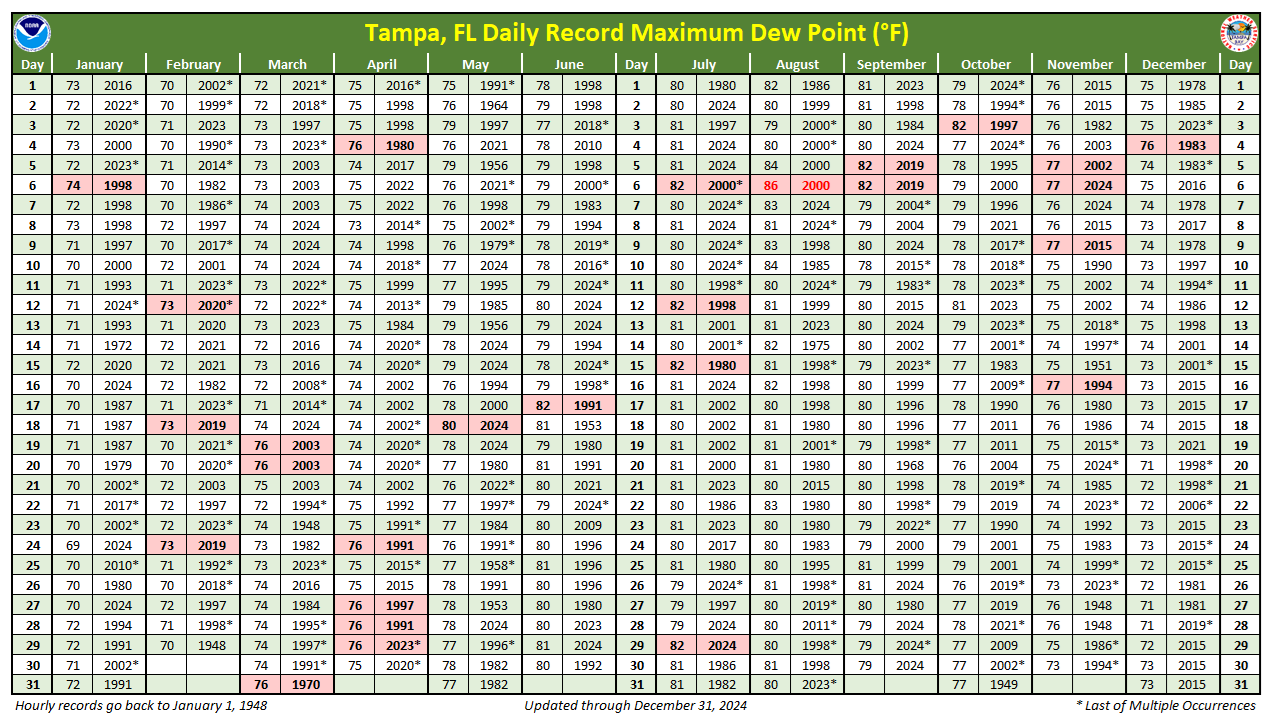
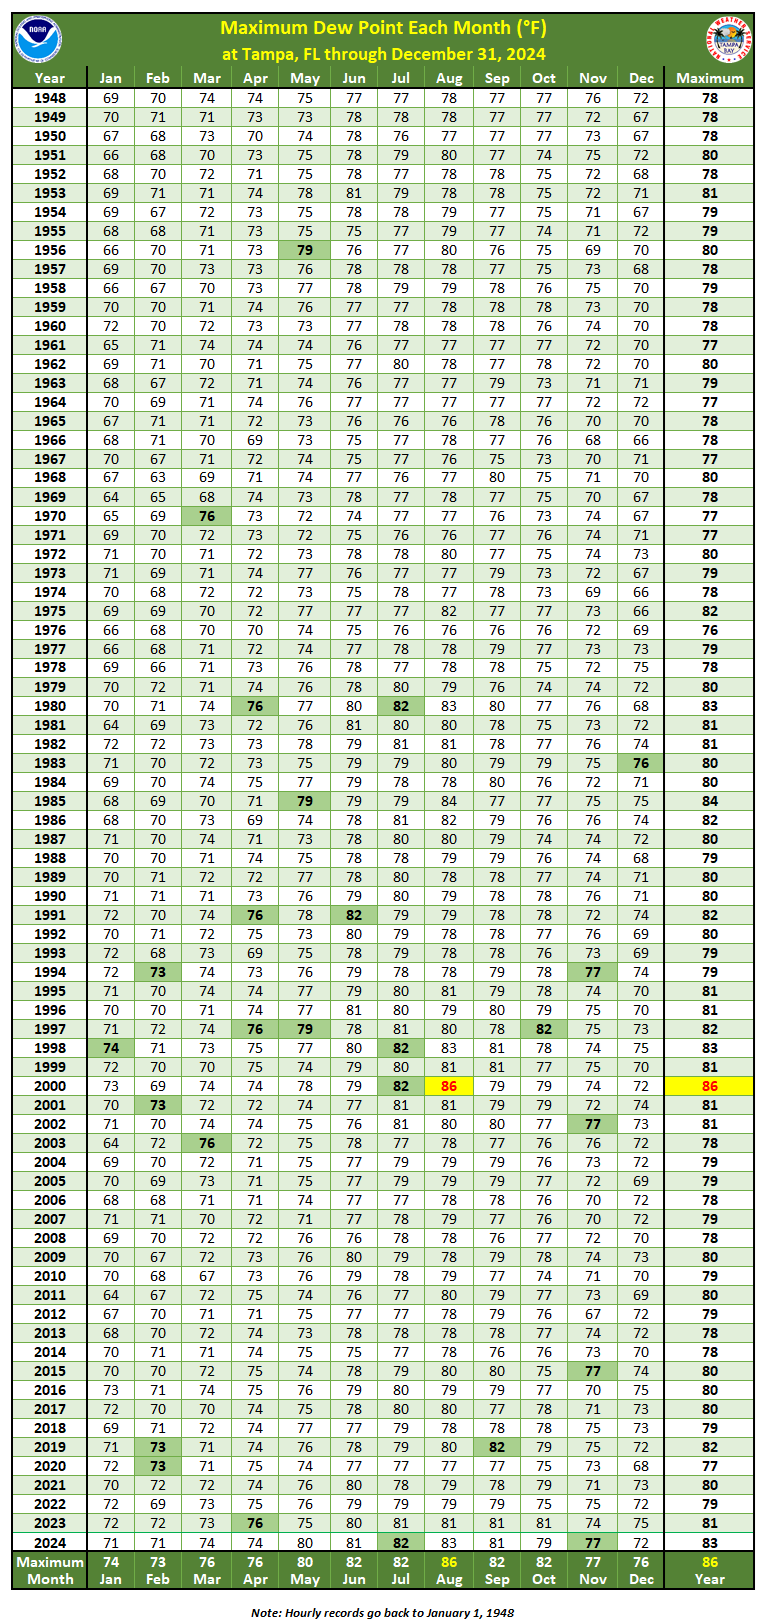
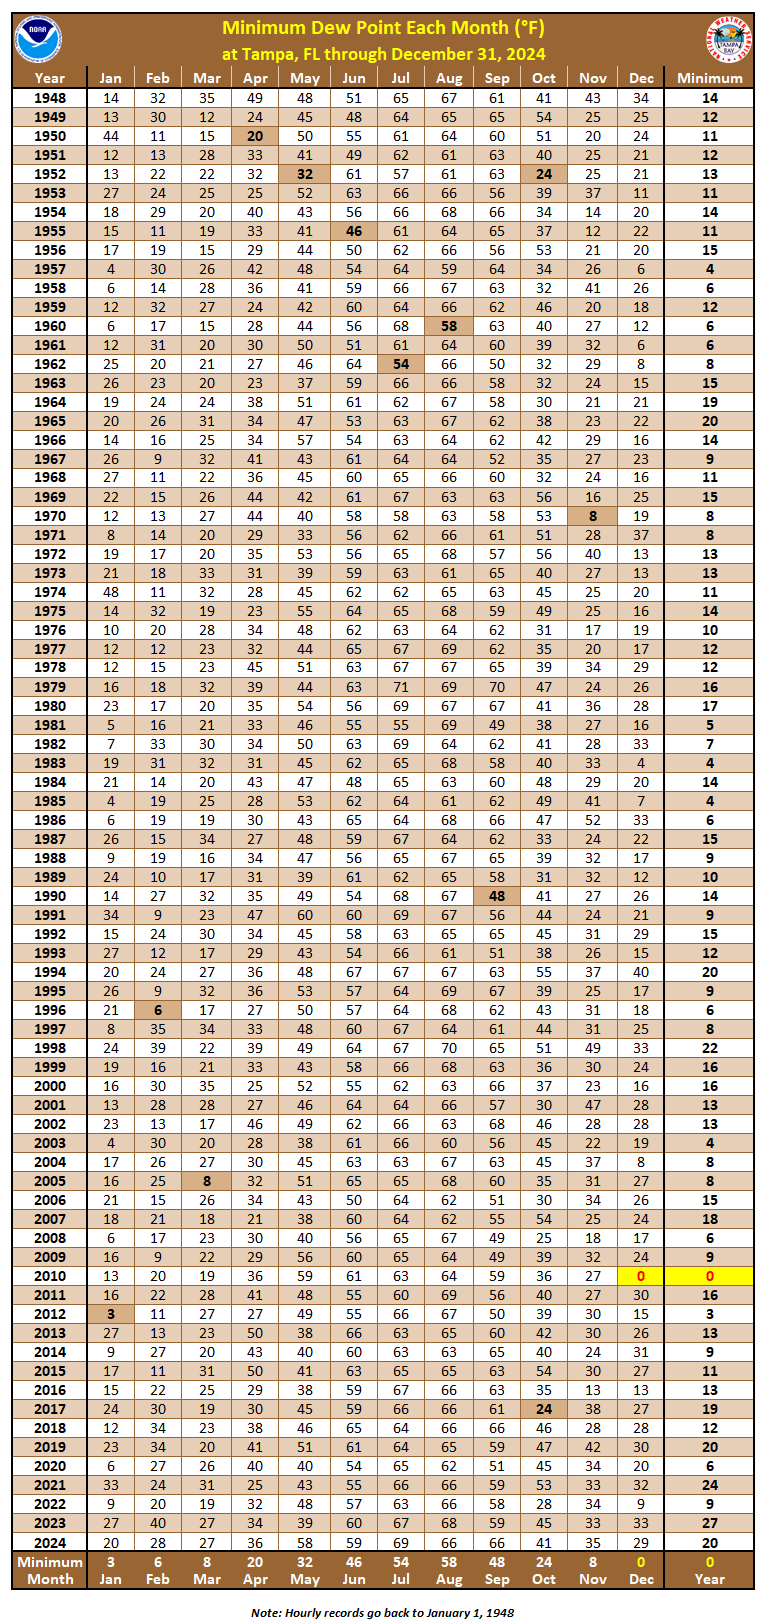
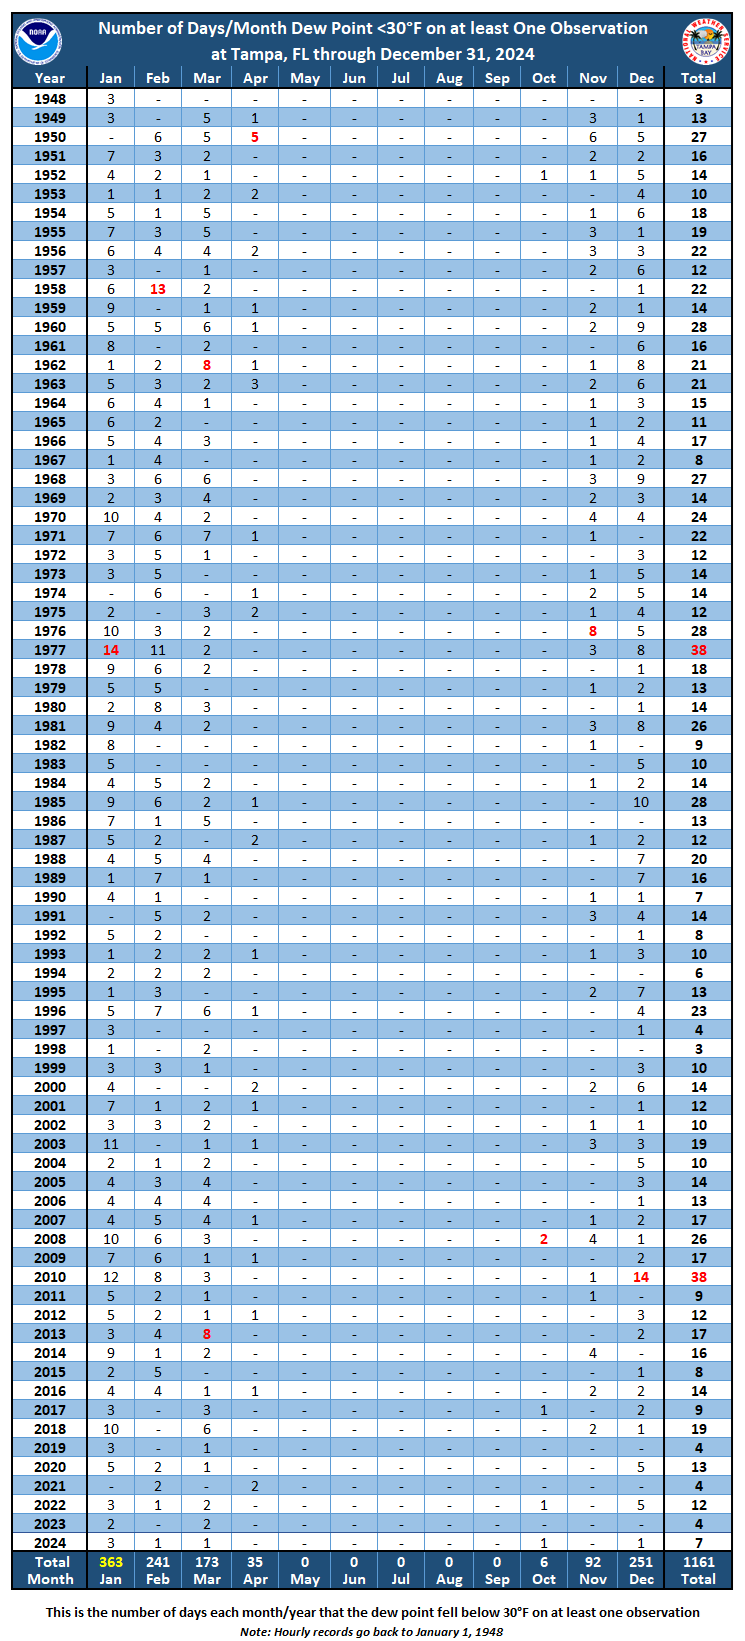
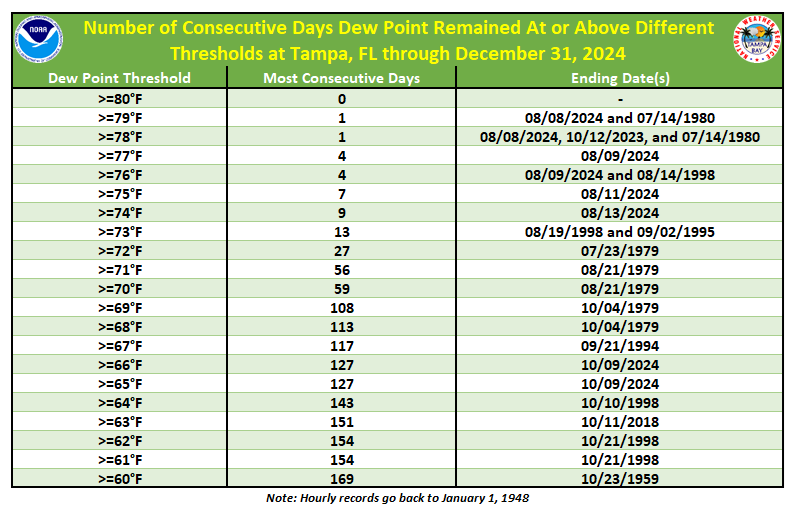
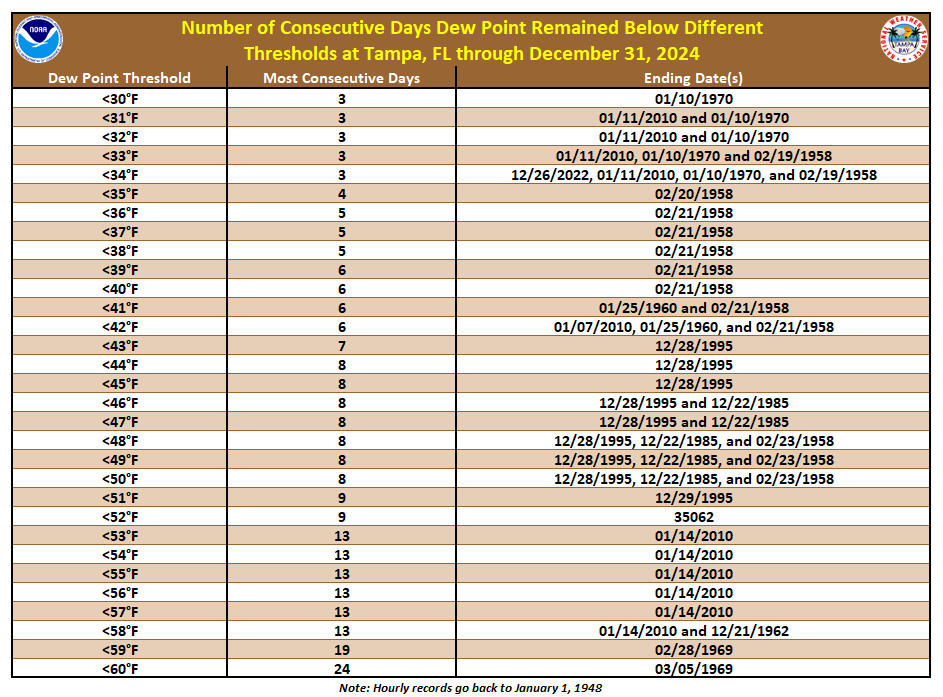
Hourly observations at Tampa back to 1948 were examined and the reported dew point temperature values were analyzed. Quality control was performed on the data, but errors could still exist. Highlights:
|
||
 |
||
 |
||
 |
||
 |
||
 |
||
Dew Point >=80°F |
Dew Point >=75°F |
Dew Point >=70°F |
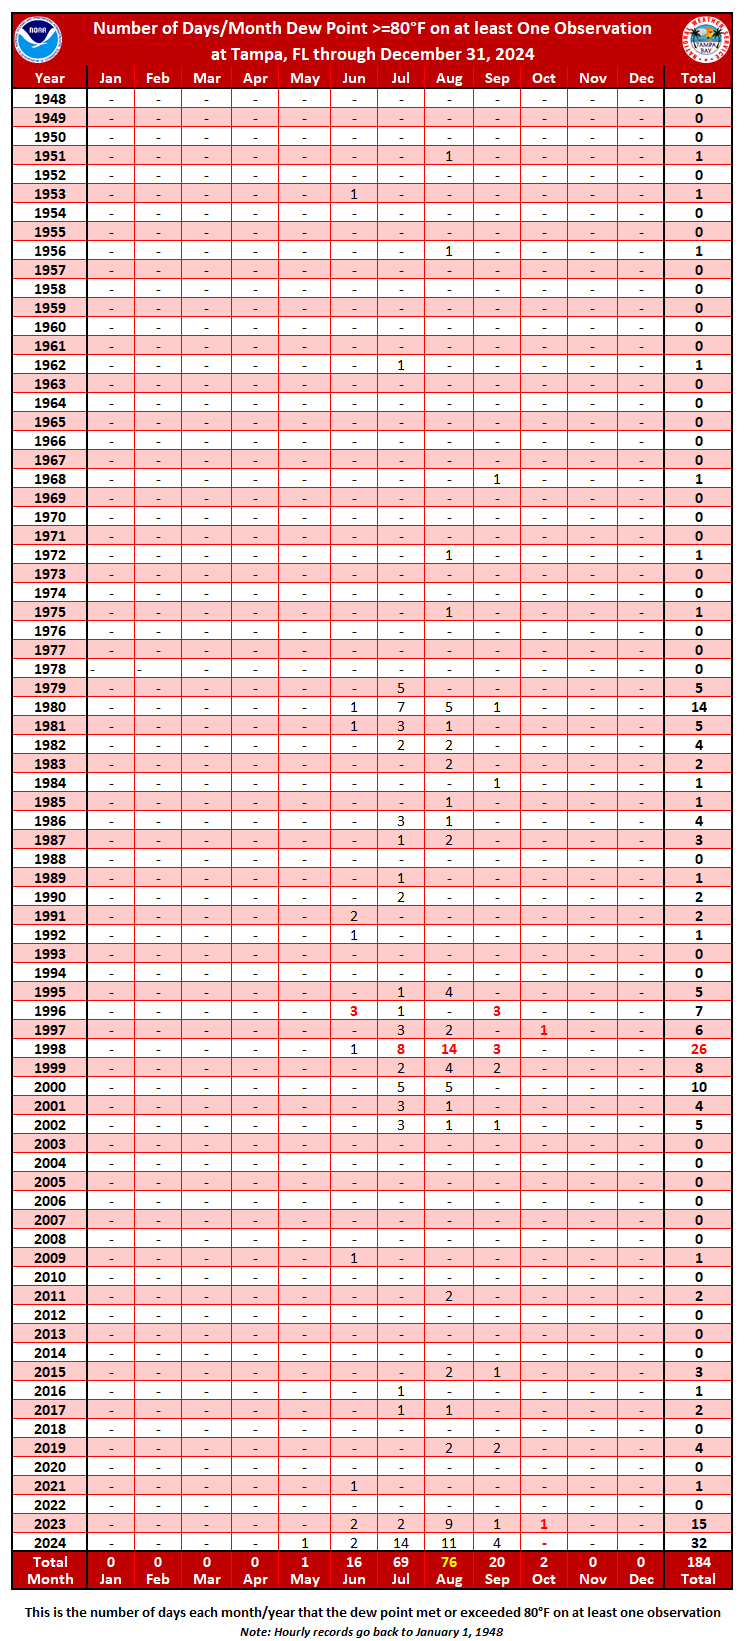 Link to >=80°F Table |
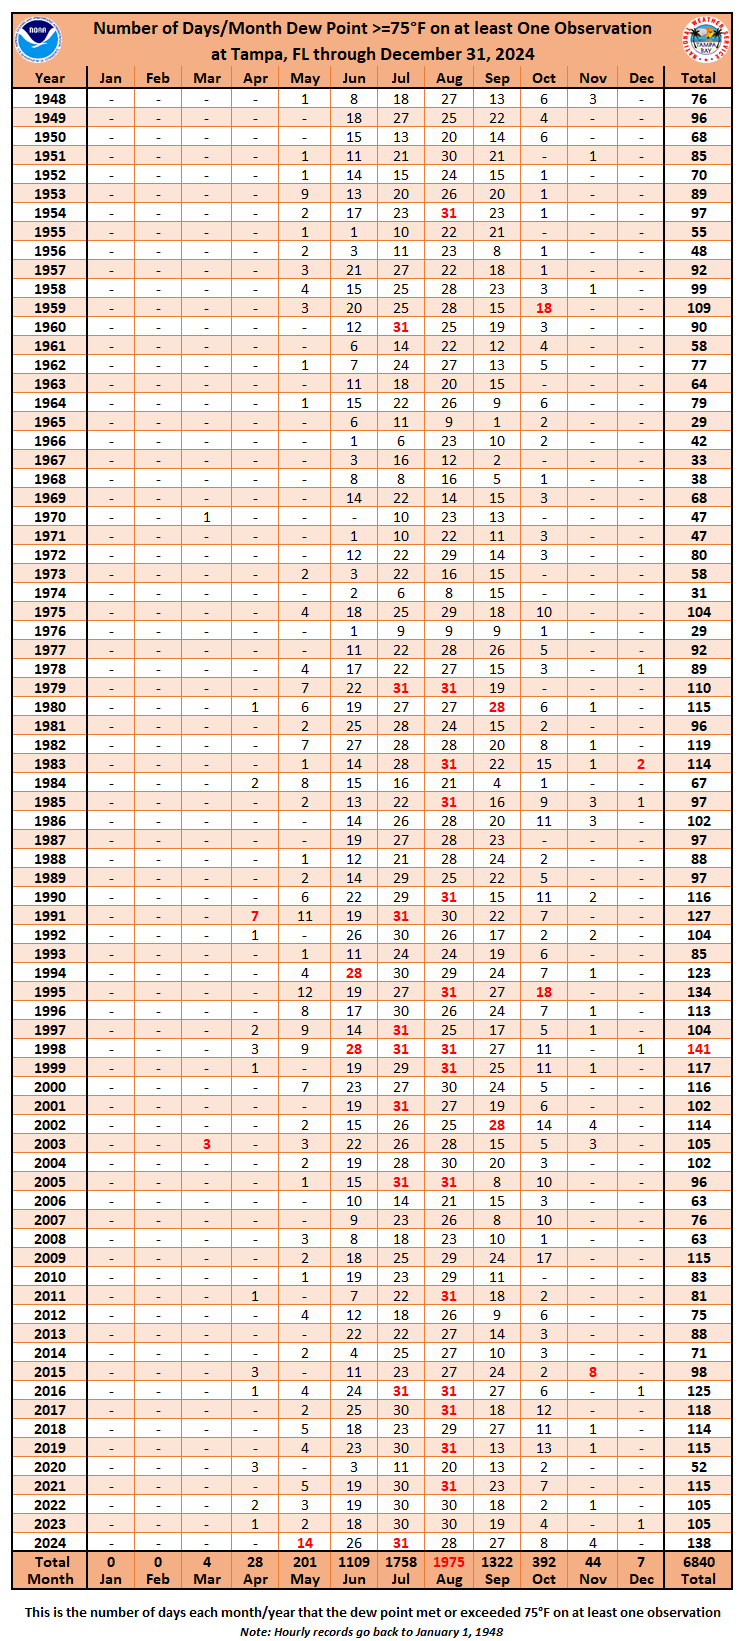 Link to >=75°F Table |
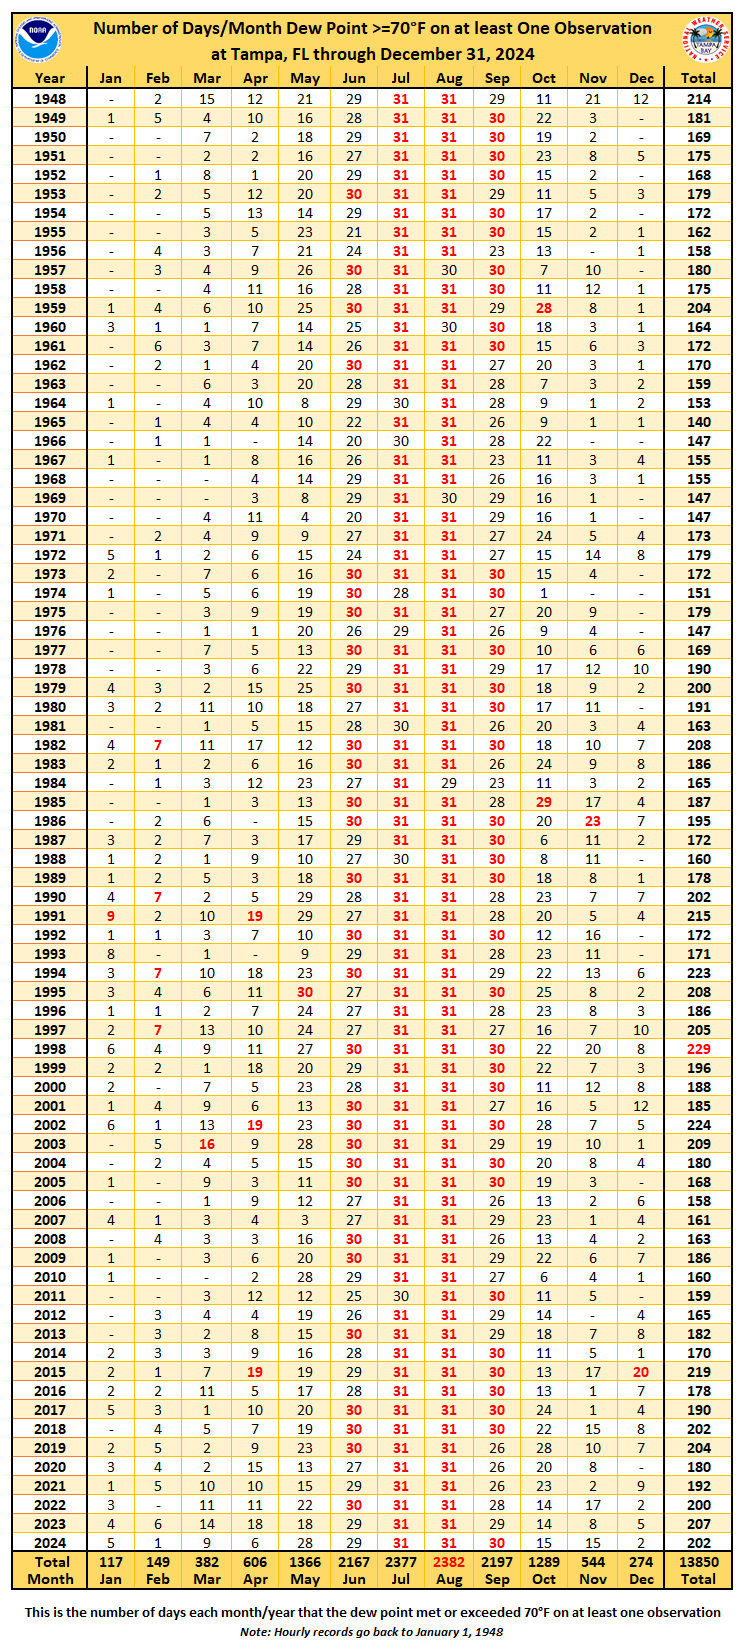 Link to >=70°F Table |
Dew Point <50°F |
Dew Point <40°F |
Dew Point <30°F |
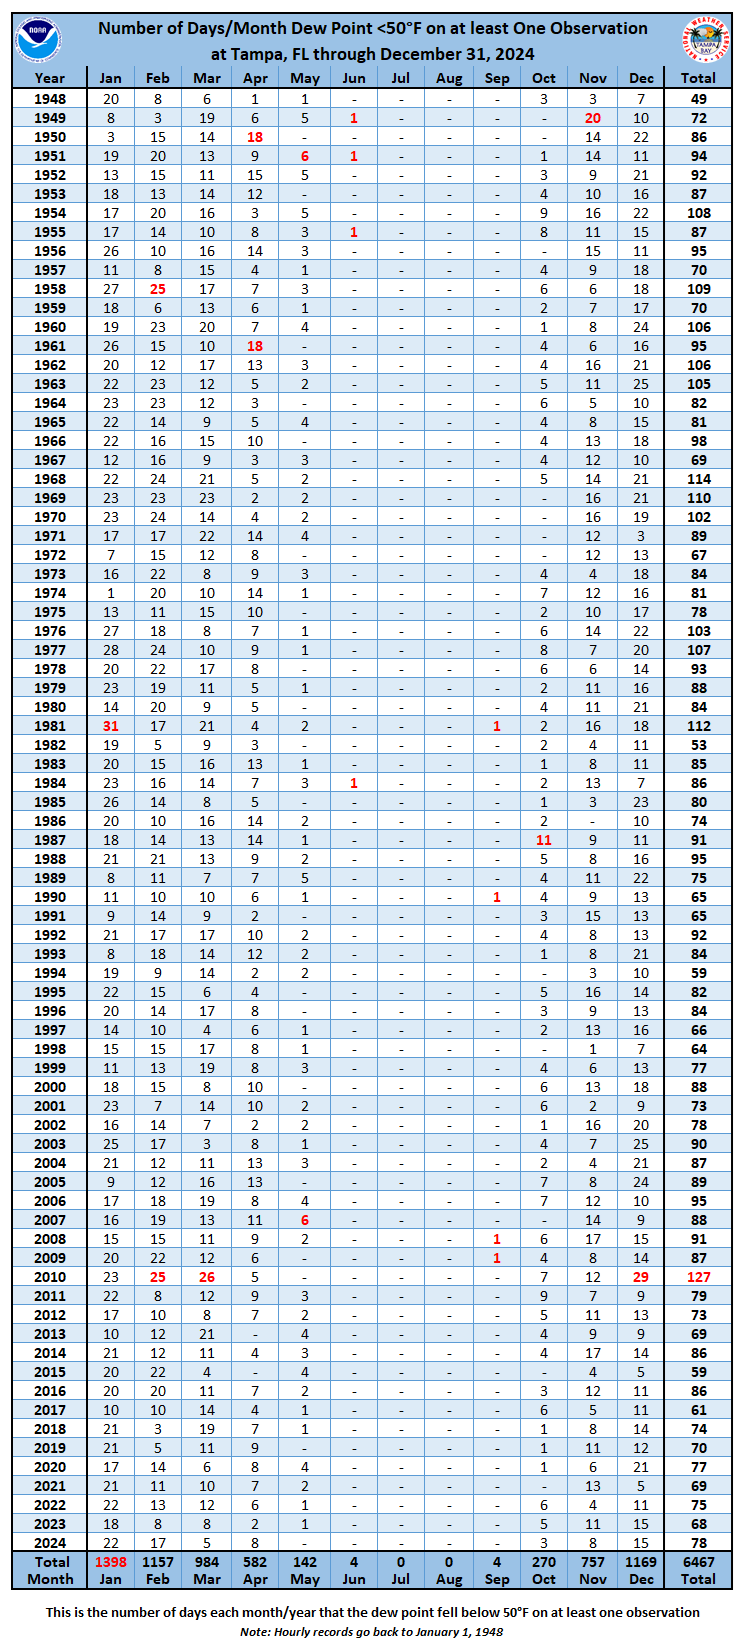 Link to <50°F Table |
 Link to <40°F Table |
 Link to <30°F Table |
 |
||
 |
||
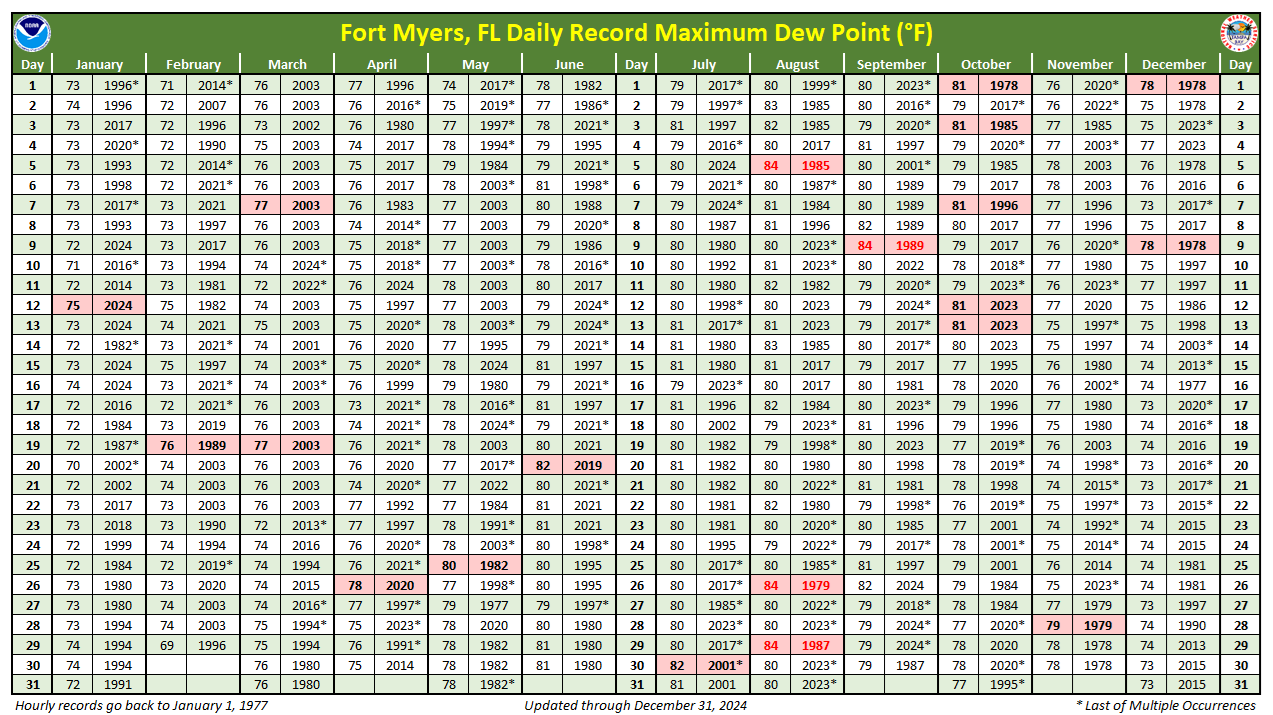
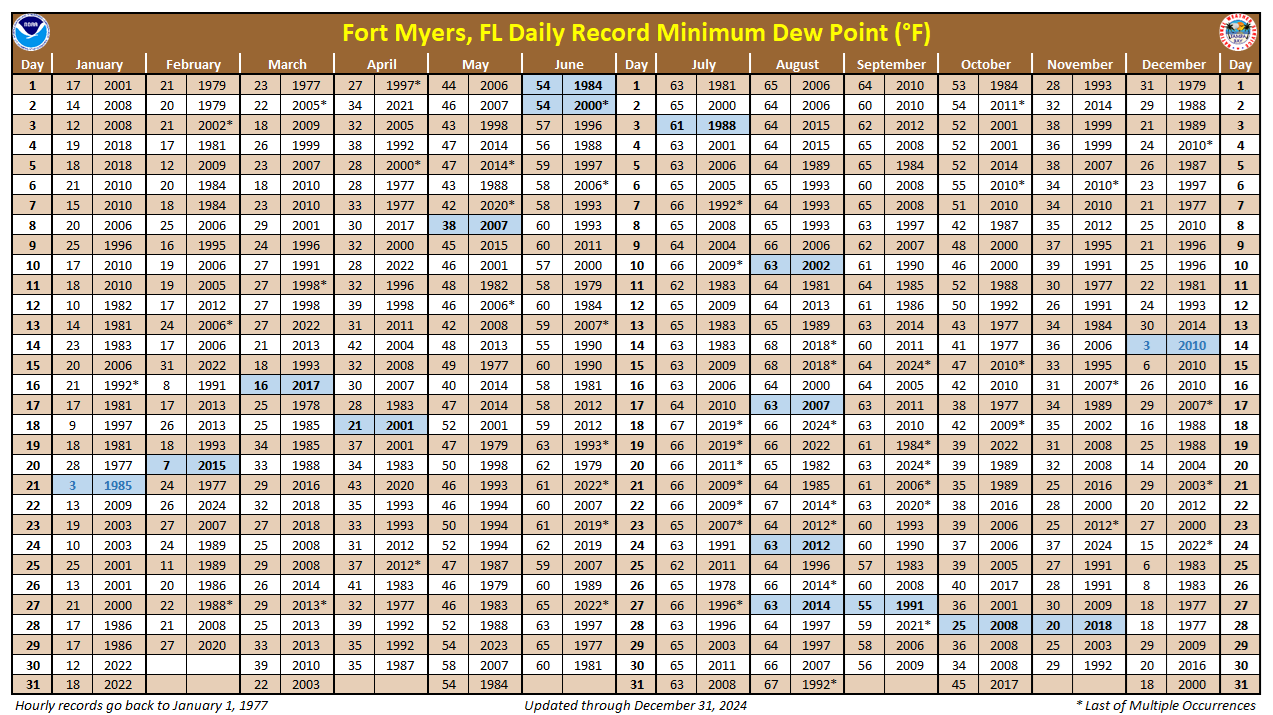
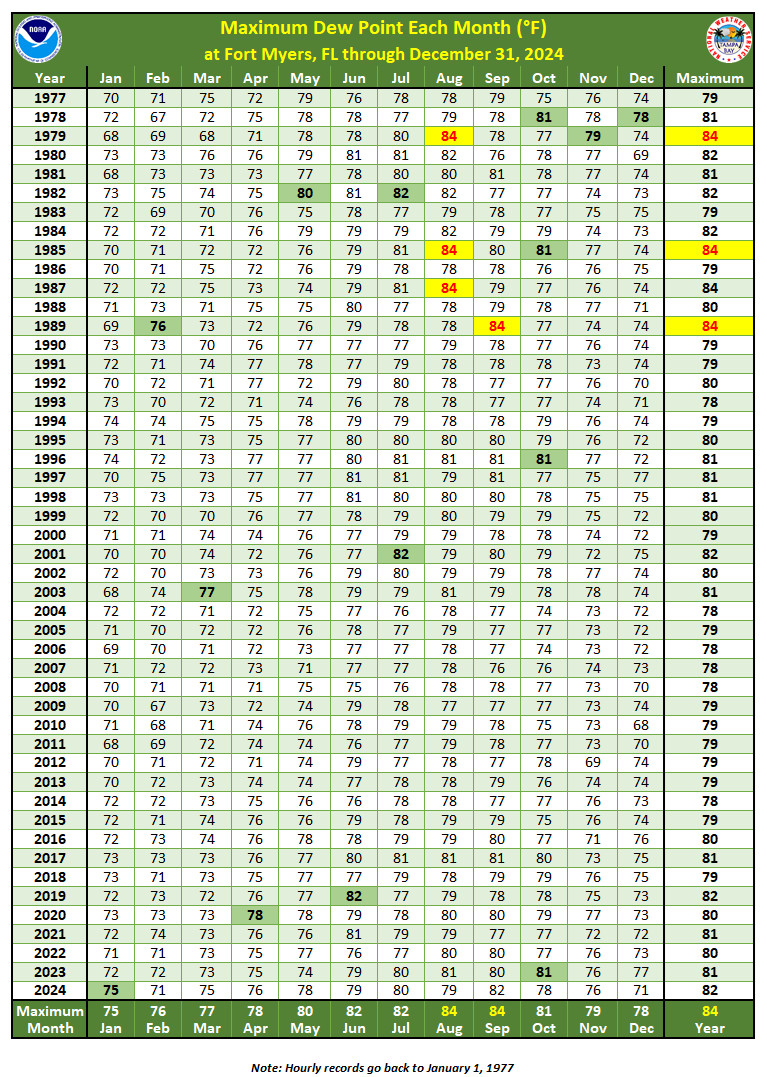
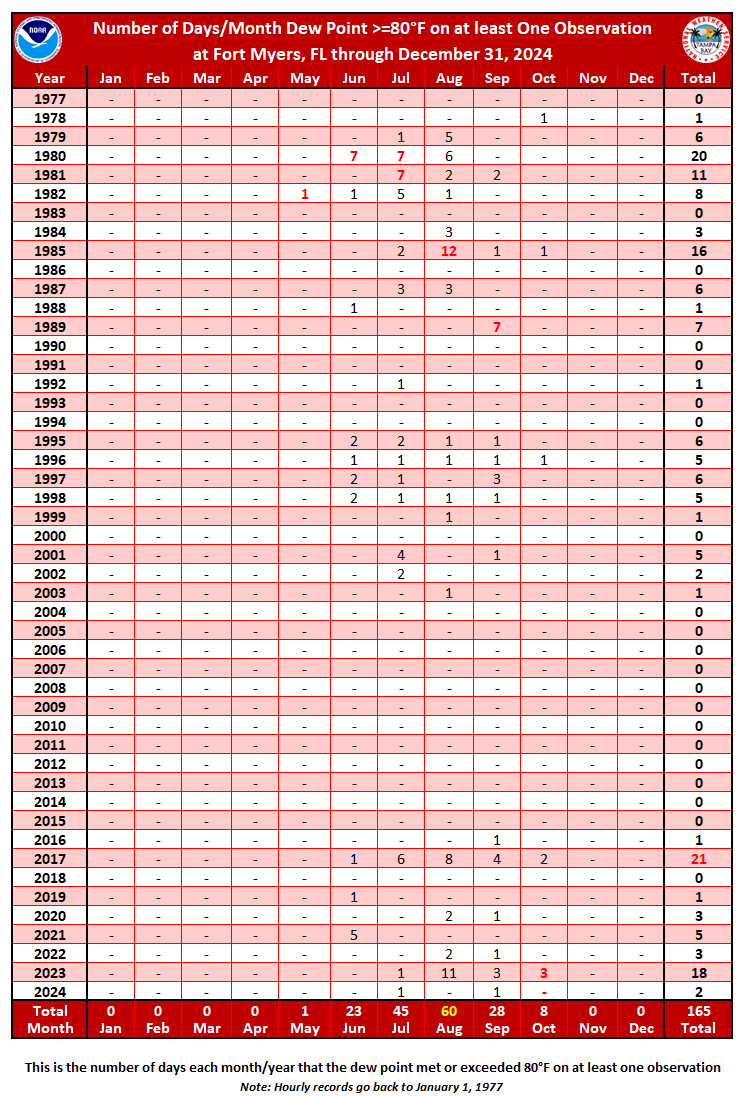
Fort Myers Dew Point Statistics: |
||
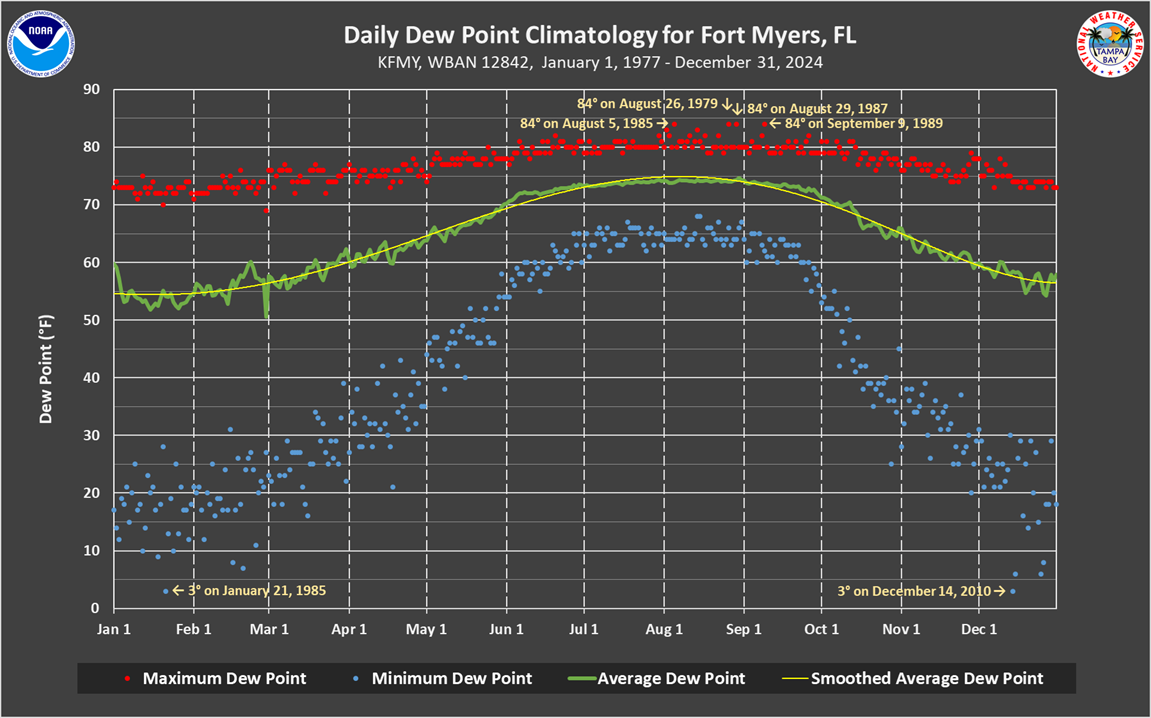
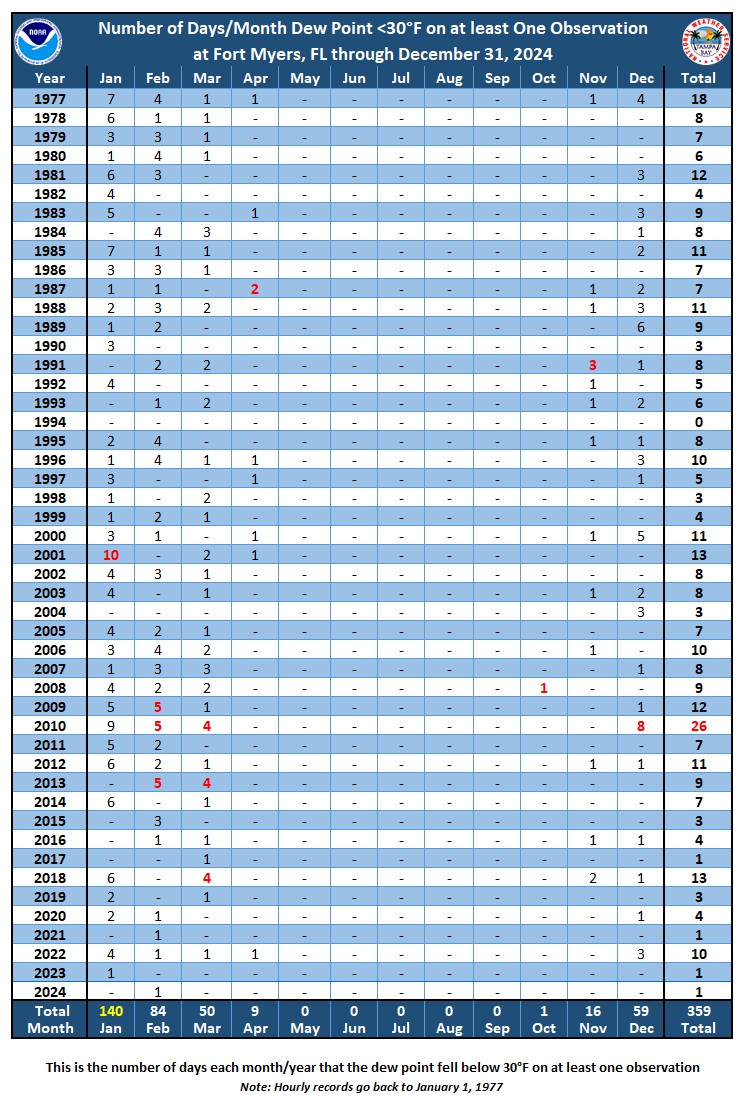
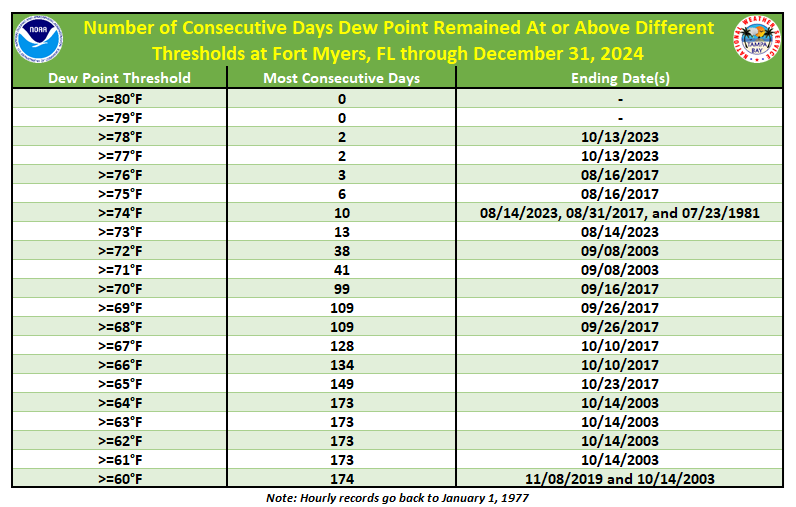
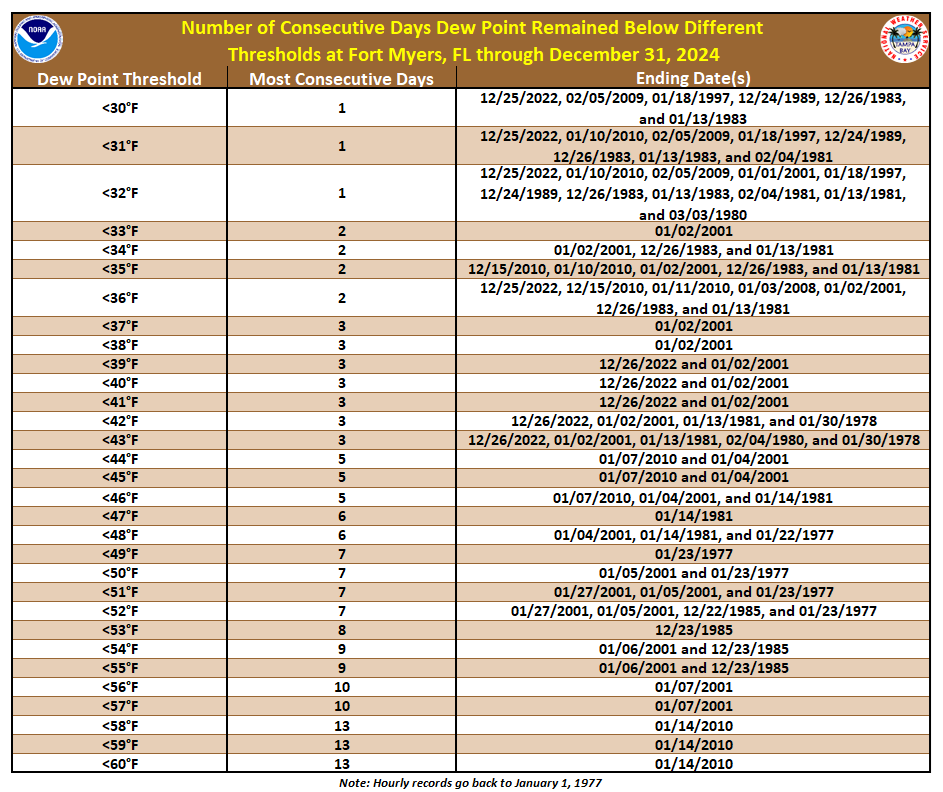
Hourly observations at Fort Myers back to 1977 were examined and the reported dew point temperature values were analyzed. Quality control was performed on the data, but errors could still exist. Highlights:
|
||
 |
||
 |
||
 |
||
 |
||
 |
||
Dew Point >=80°F |
Dew Point >=75°F |
Dew Point >=70°F |
 Link to >=80°F Table |
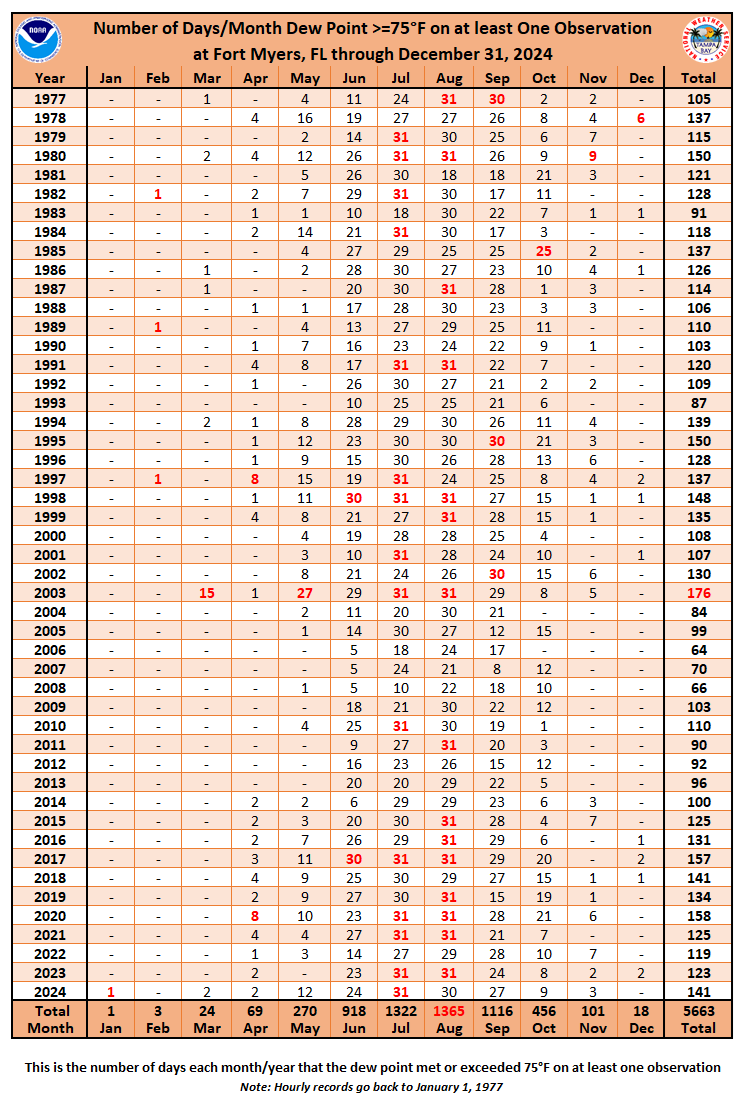 Link to >=75°F Table |
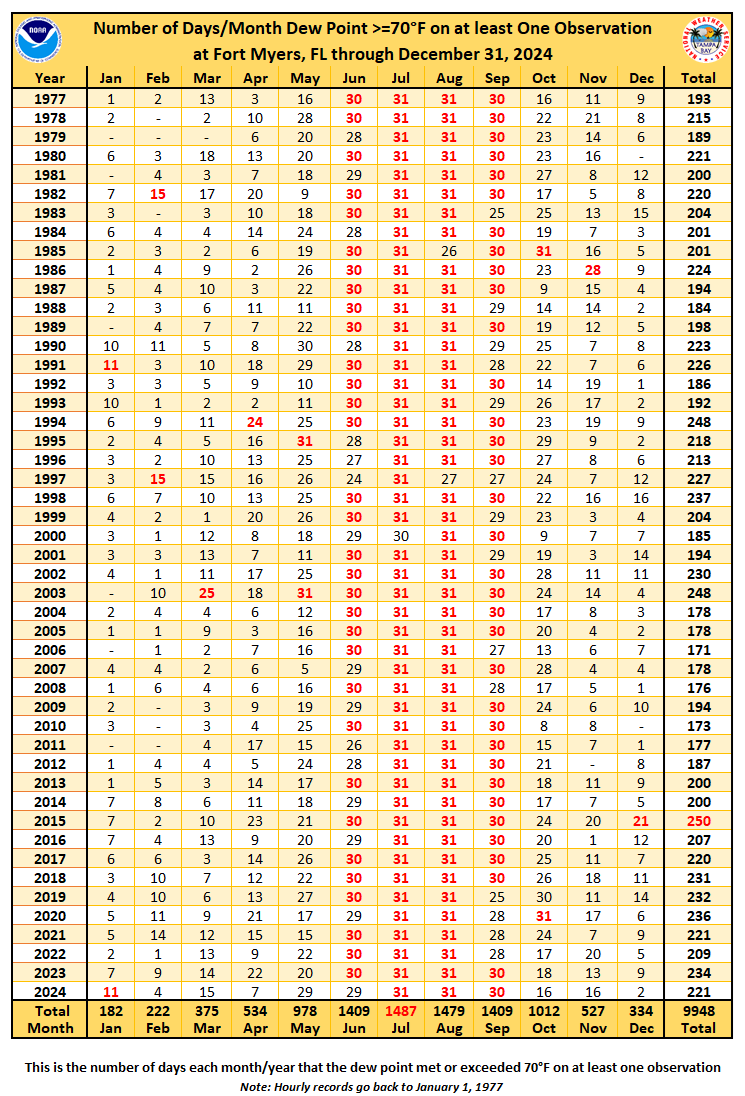 Link to >=70°F Table |
Dew Point <50°F |
Dew Point <40°F |
Dew Point <30°F |
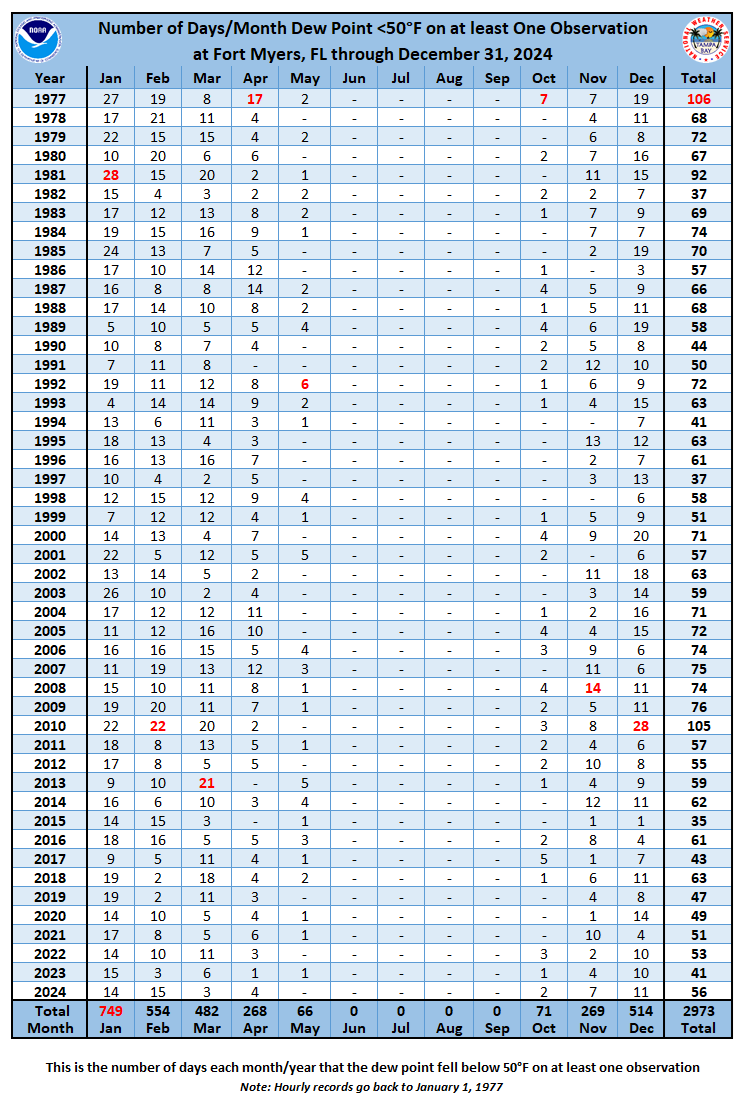 Link to <50°F Table |
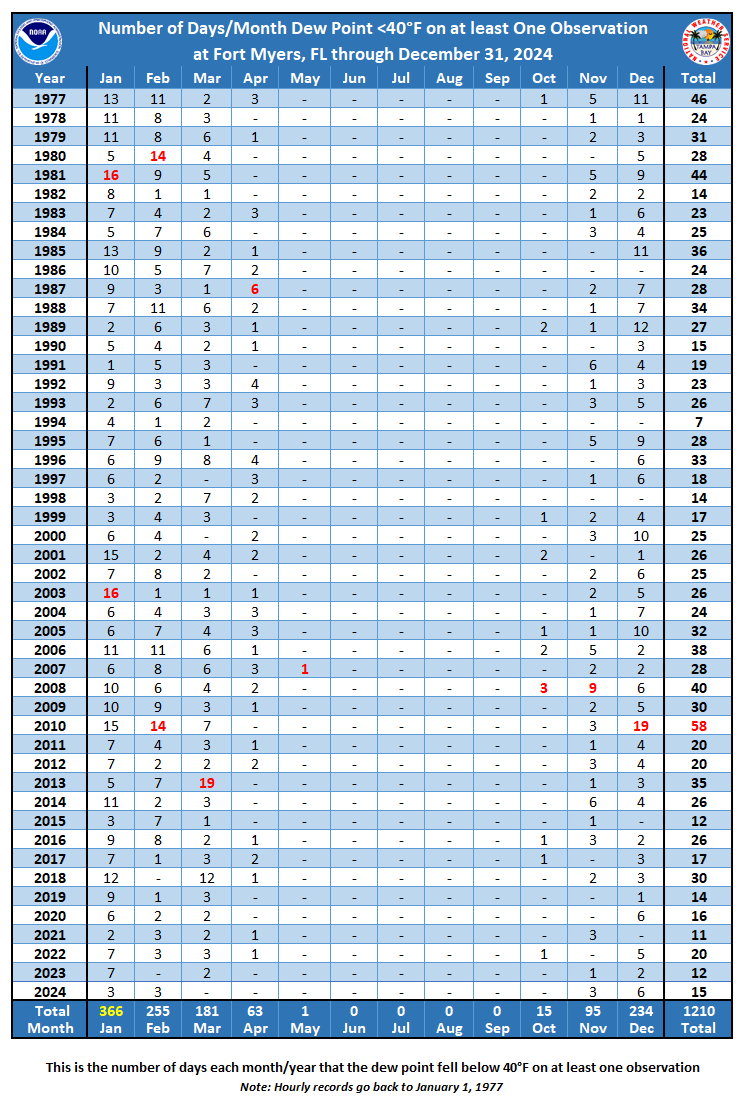 Link to <40°F Table |
 Link to <30°F Table |
 |
||
 |
||
Sarasota-Bradenton Dew Point Statistics: |
||
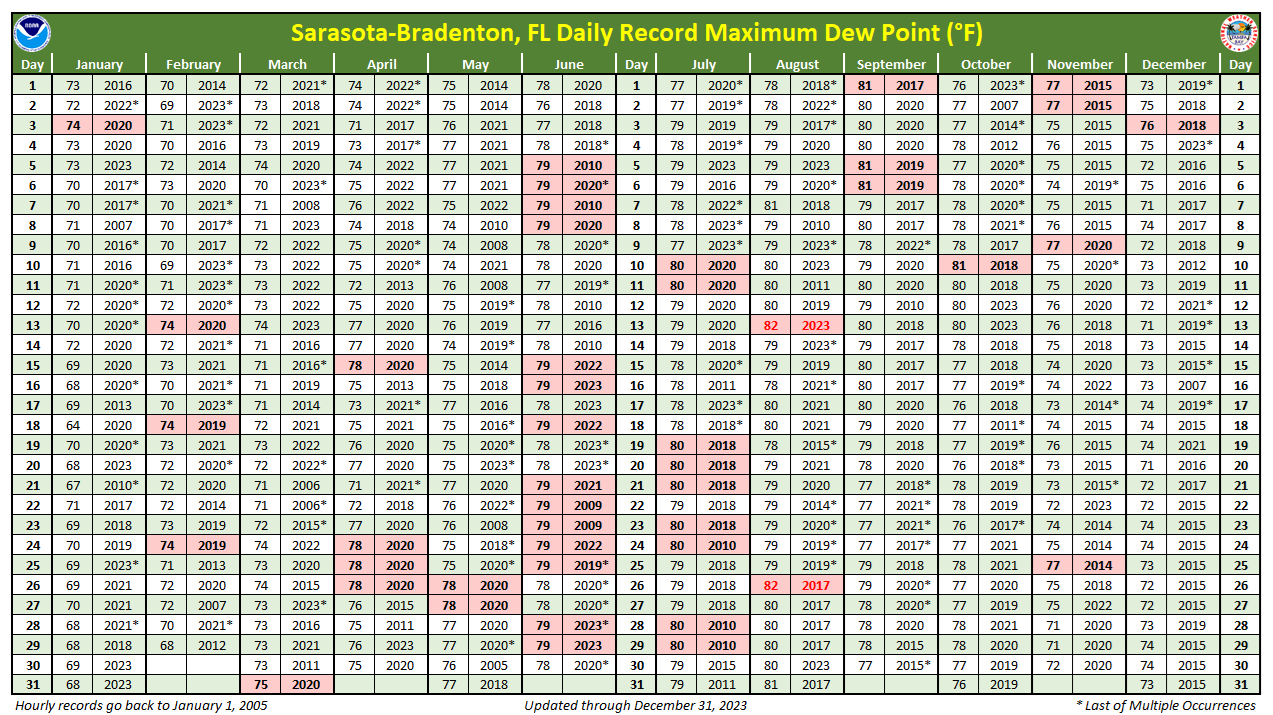
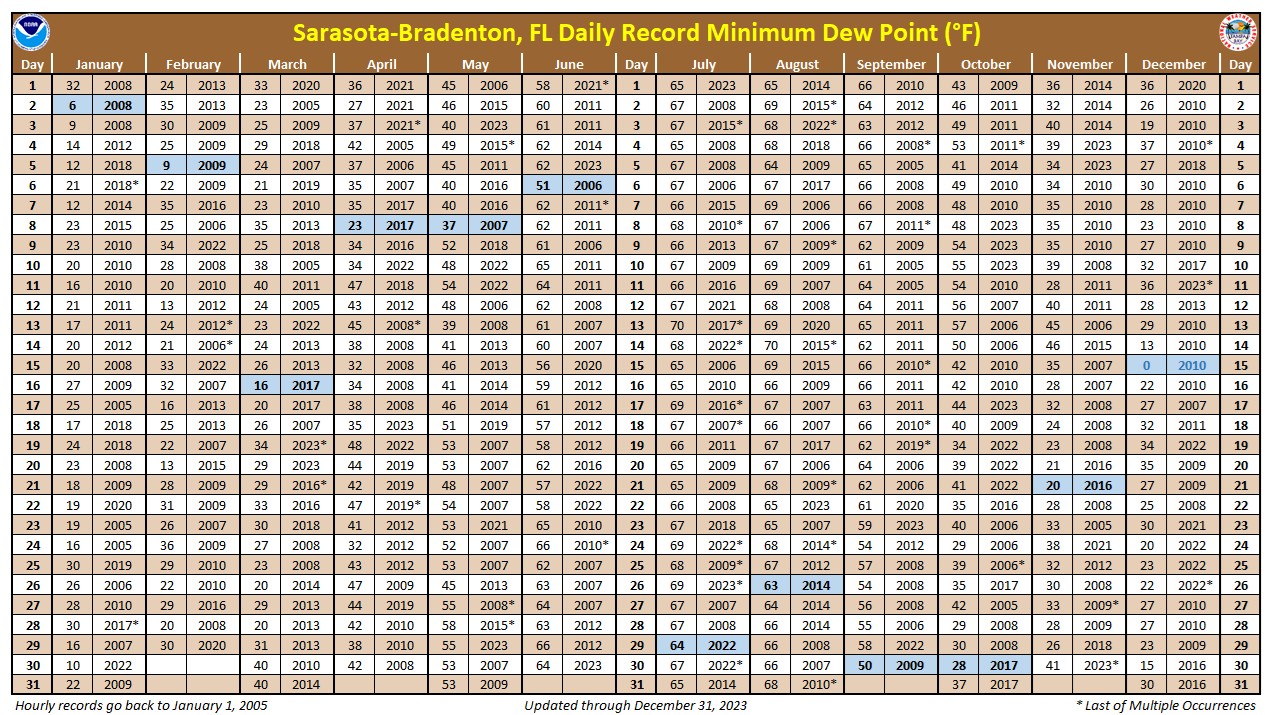
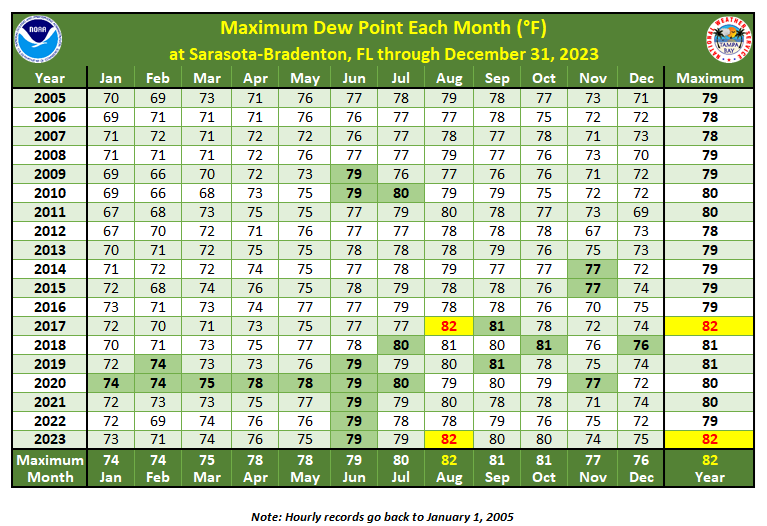
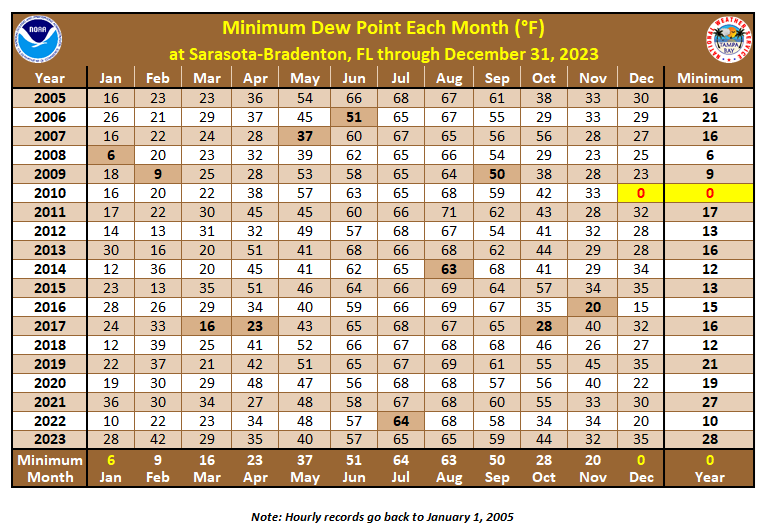
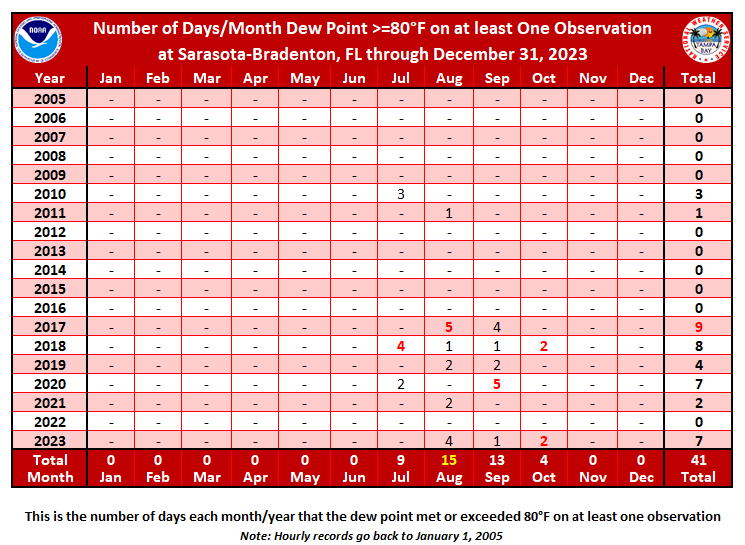
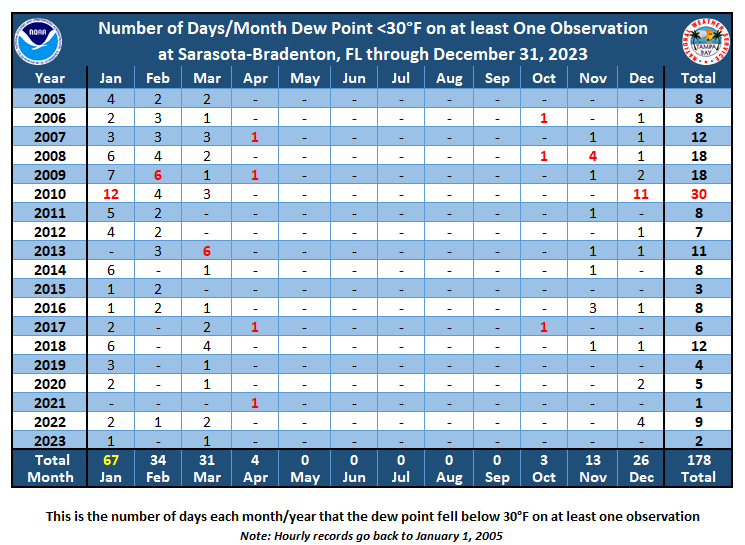
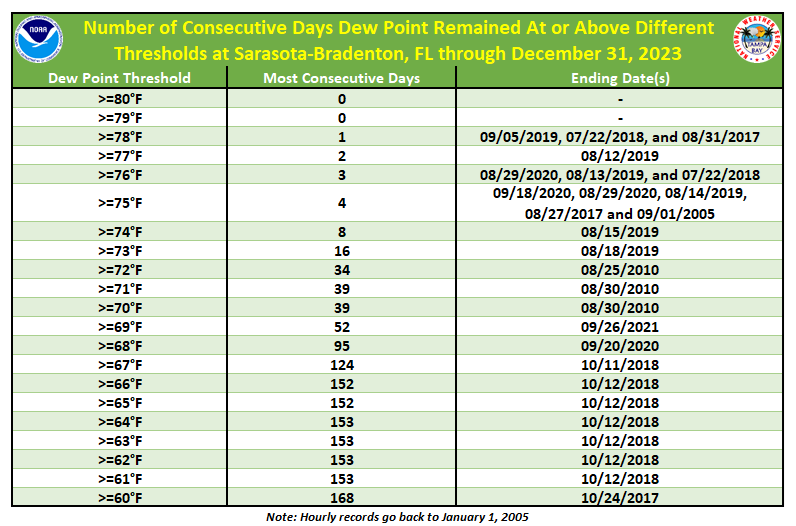
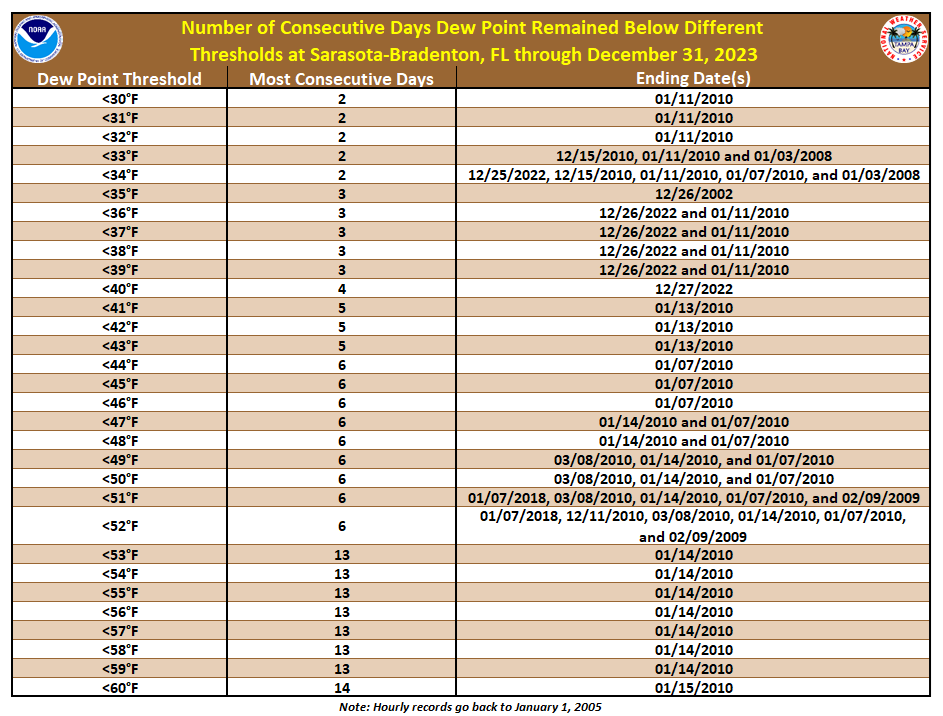
Hourly observations at Sarasota-Bradenton back to 2005 were examined and the reported dew point temperature values were analyzed. Quality control was performed on the data, but errors could still exist. Highlights:
|
||
 |
||
 |
||
 |
||
 |
||
 |
||
Dew Point >=80°F |
Dew Point >=75°F |
Dew Point >=70°F |
 Link to >=80°F Table |
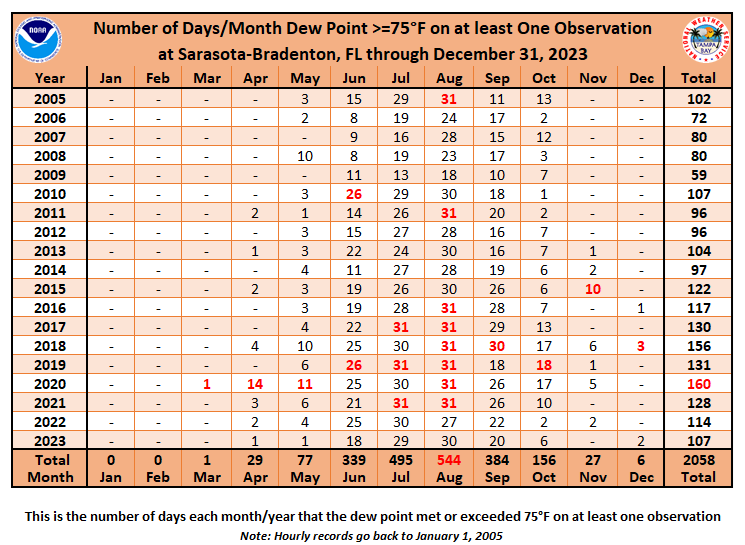 Link to >=75°F Table |
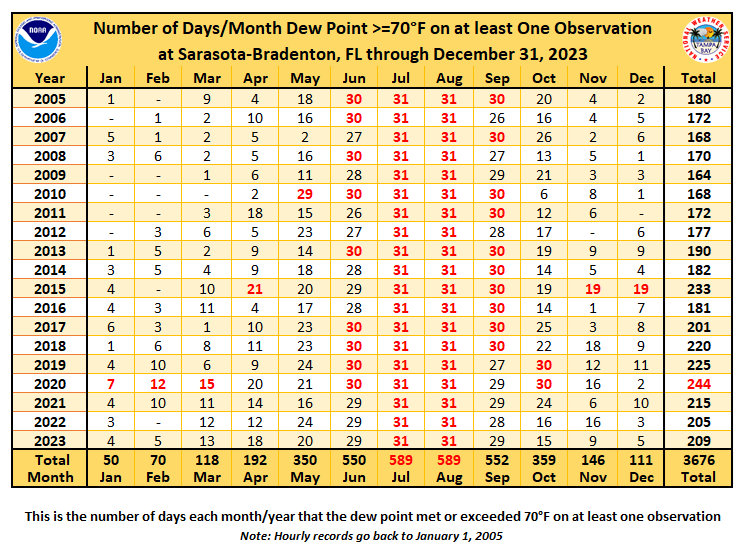 Link to >=70°F Table |
Dew Point <50°F |
Dew Point <40°F |
Dew Point <30°F |
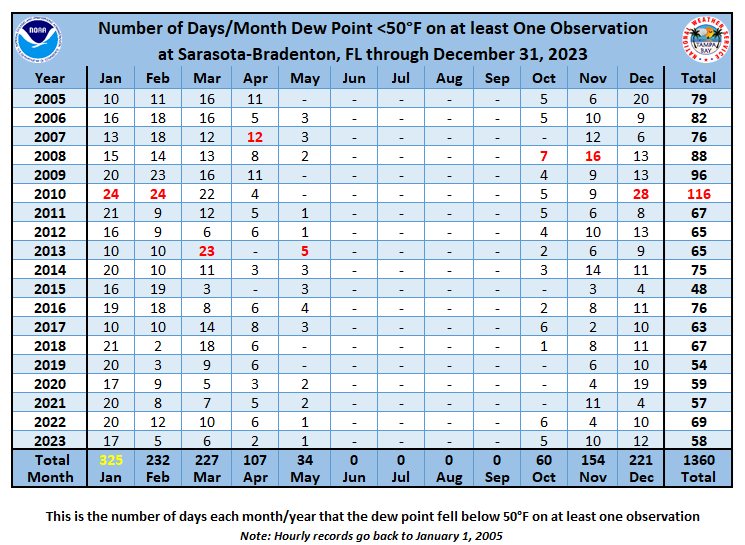 Link to <50°F Table |
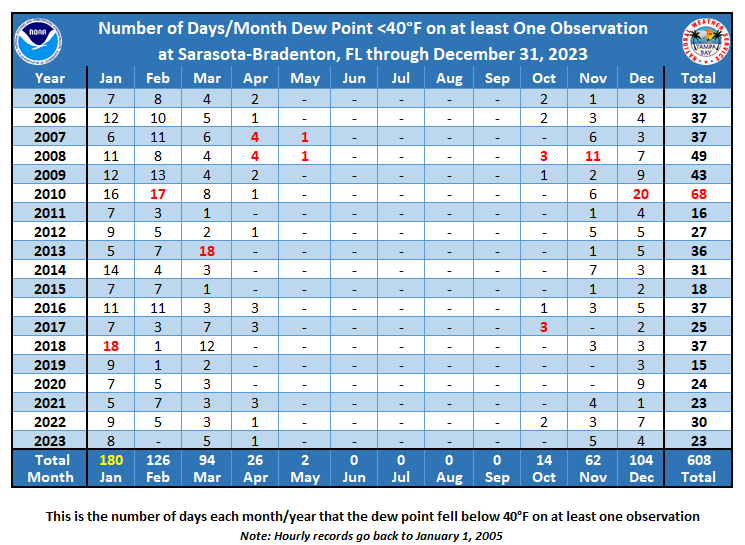 Link to <40°F Table |
 Link to <30°F Table |
 |
||
 |
||