| West Central and Southwest Florida Climate Tables and Graphics for Winter 2018-19 |
||
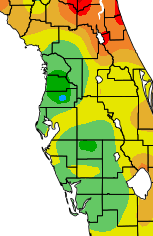
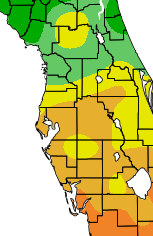
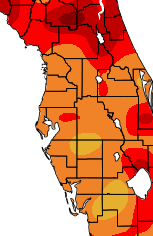
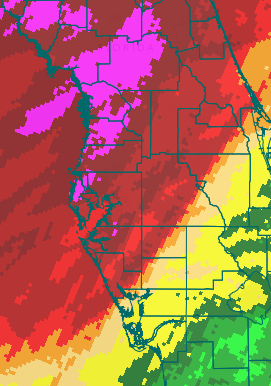
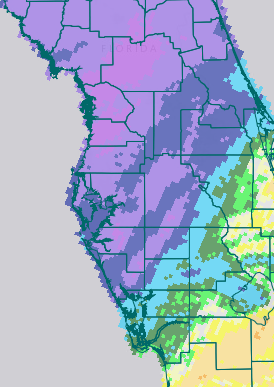
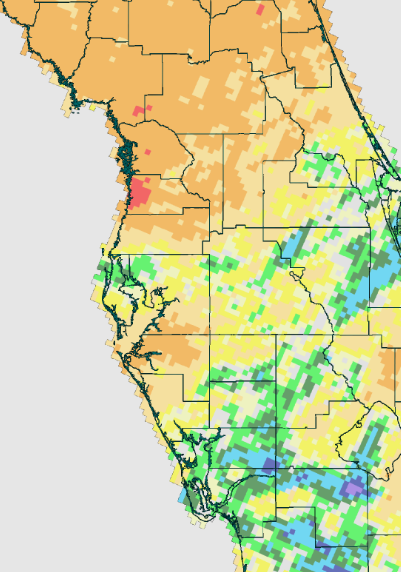
Winter 2018-19 (December/January/February) across West Central and Southwest Florida was warmer than normal with temperatures averaging in the middle 60s, which was about 1 to almost 4 degrees above normal. It was also a rather wet Winter across the area thanks to the El Niño pattern with rainfall amounts about 3 to over 8 inches above normal. |
| Winter 2018-19 Temperature (°F) | Winter 2018-19 Rainfall (inches) | |||||||||
| Site | Average | Normal | DFN | Ranking | Site | Total | Normal | DFN | Ranking | |
| Arcadia | 64.6 | 61.7 | +2.9 | Tied 24th Warmest | Arcadia | 10.03 | 6.33 | +3.70 | 21st Wettest | |
| Archbold | 64.8 | 61.7 | +3.1 | Tied 8th Warmest | Archbold | 9.12 | 6.39 | +2.73 | 9th Wettest | |
| Bartow | 64.1 | 63.3 | +0.8 | 24th Warmest | Bartow | 11.98 | 7.45 | +4.53 | 15th Wettest | |
| Brooksville | 62.0 | 58.5 | +3.5 | Tied 33rd Warmest / 66th Coolest | Brooksville | 14.74 | 8.98 | +5.76 | 11th Wettest | |
| Chiefland 5 ESE | M | 56.0 | M | Numerous Days Missing in January | Chiefland 5 ESE | 16.37 | 10.44 | +5.93 | 8th Wettest | |
| Fort Myers | 68.0 | 65.7 | +2.3 | 18th Warmest | Fort Myers | 9.47 | 5.80 | +3.67 | 16th Wettest | |
| Inverness 3 SE | 60.1 | 58.0 | +2.1 | 21st Warmest | Inverness 3 SE | 16.66 | 8.31 | +8.35 | 3rd Wettest | |
| Lakeland | 65.9 | 62.3 | +3.6 | 12th Warmest | Lakeland | 15.22 | 8.24 | +6.98 | 4th Wettest | |
| Myakka Rvr St Pk | 66.1 | 63.2 | +2.9 | Tied 7th Warmest | Myakka Rvr St Pk | 12.60 | 8.01 | +4.59 | 9th Wettest | |
| Plant City | 66.0 | 62.1 | +3.9 | 6th Warmest | Plant City | 14.99 | 8.10 | +6.89 | 5th Wettest | |
| Punta Gorda | 65.8 | 63.9 | +1.9 | Tied 34th Warmest / 55th Coolest | Punta Gorda | 9.13 | 6.26 | +2.87 | 15th Wettest | |
| Sarasota-Bradenton | 66.3 | 62.7 | +3.6 | 7th Warmest | Sarasota-Bradenton | 12.39 | 7.72 | +4.67 | 11th Wettest | |
| St. Leo | 63.6 | 62.4 | +1.2 | Tied 22nd Warmest | St. Leo | 13.88 | 9.08 | +4.80 | 13th Wettest | |
| St. Petersburg | 65.7 | 63.3 | +2.4 | Tied 22nd Warmest | St. Petersburg | 11.61 | 8.04 | +3.57 | 16th Wettest | |
| Tampa | 65.6 | 62.4 | +3.2 | 15th Warmest | Tampa | 15.81 | 7.51 | +8.30 | 3rd Wettest | |
| Tarpon Springs | 64.0 | 61.3 | +2.7 | 19th Warmest | Tarpon Springs | 16.44 | 8.87 | +7.57 | 7th Wettest | |
| Venice | 65.3 | 63.0 | +2.3 | 11th Warmest | Venice | 12.35 | 7.02 | +5.33 | 5th Wettest | |
| Wauchula 2 N | 63.9 | 63.0 | +0.9 | 26th Warmest | Wauchula 2 N | 11.53 | 6.90 | +4.63 | 9th Wettest | |
| Winter Haven | 66.2 | 62.4 | +3.8 | 8th Warmest | Winter Haven | 11.84 | 7.76 | +4.08 | 7th Wettest | |
Click on a "Site" name above for more detailed information |
 |
 |
 |
 |
 |
 |
 |
|
|
| December Average Temp (°F) | December Dep fm Normal (°F) | January Average Temp (°F) | January Dep fm Normal (°F) | |||||
 |
 |
 |
 |
 |
 |
 |
|
|
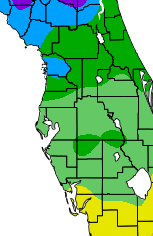
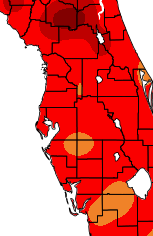
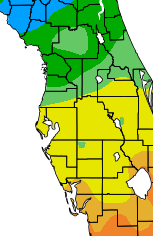
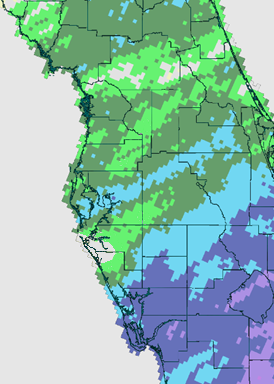
| February Average Temp (°F) | February Dep fm Normal (°F) | Winter Average Temp (°F) | Winter Dep fm Normal (°F) |
 |
 |
 |
 |
 |
|
 |
|
|
| December Rainfall (in.) | December Pct of Normal (%) | January Rainfall (in.) | January Pct of Normal (%) | |||||
 |
|
 |
|
 |
 |
 |
|
|
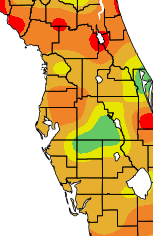
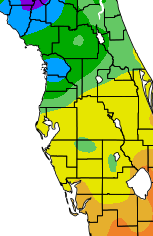
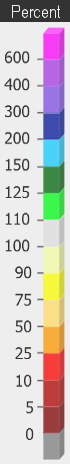
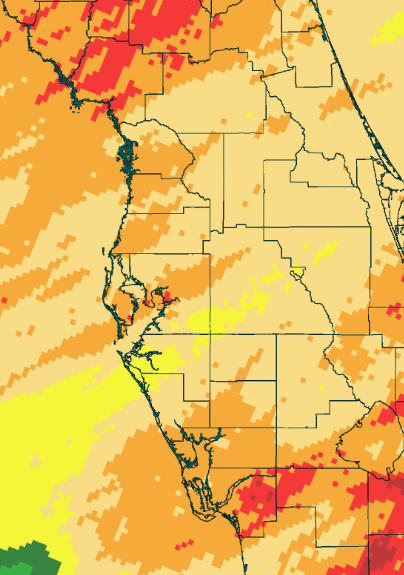
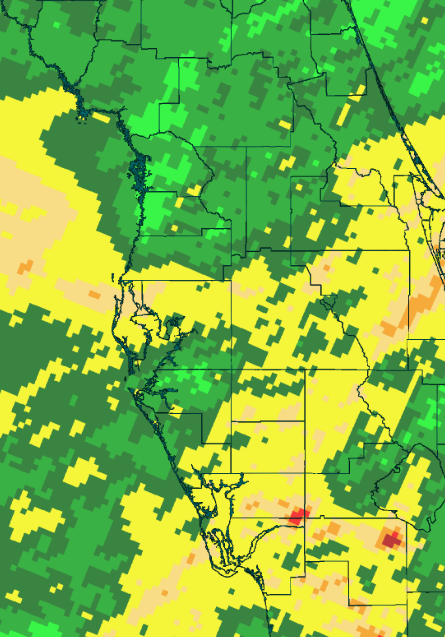
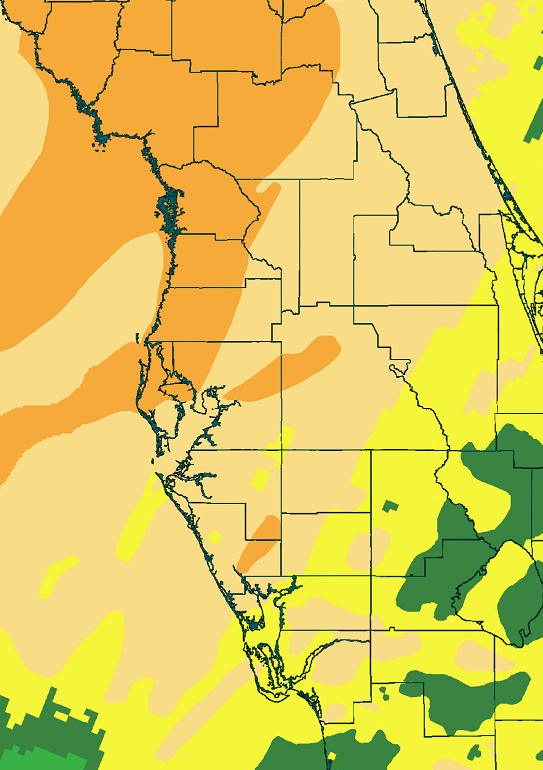
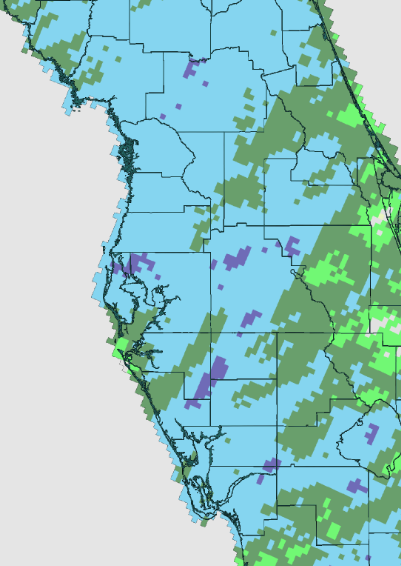
| February Rainfall (in.) | February Pct of Normal (%) | Winter Rainfall (in.) | Winter Pct of Normal (%) | |||||


