| Overview: | ||
Based on the common patterns of the subtropical ridge, meteorologists at the National Weather Service Forecast Office in Ruskin, FL identified eight wind patterns or "Flow Regimes" and produced high resolution spatial and temporal probability of precipitation (PoP) climatologies for each across the Southeast United States, spanning the years 2002-2019. This page defines the regimes and gives the graphics of the probability of precipitation ≥ 0.01 inch for the NWS Tampa Bay County Warning Area. Once you know what the regime number is for the day you're interested in click on the tab for that regime. |
|
|
Most images on this page can be magnified by clicking, and resized back to original size with a second click. |
||
 |
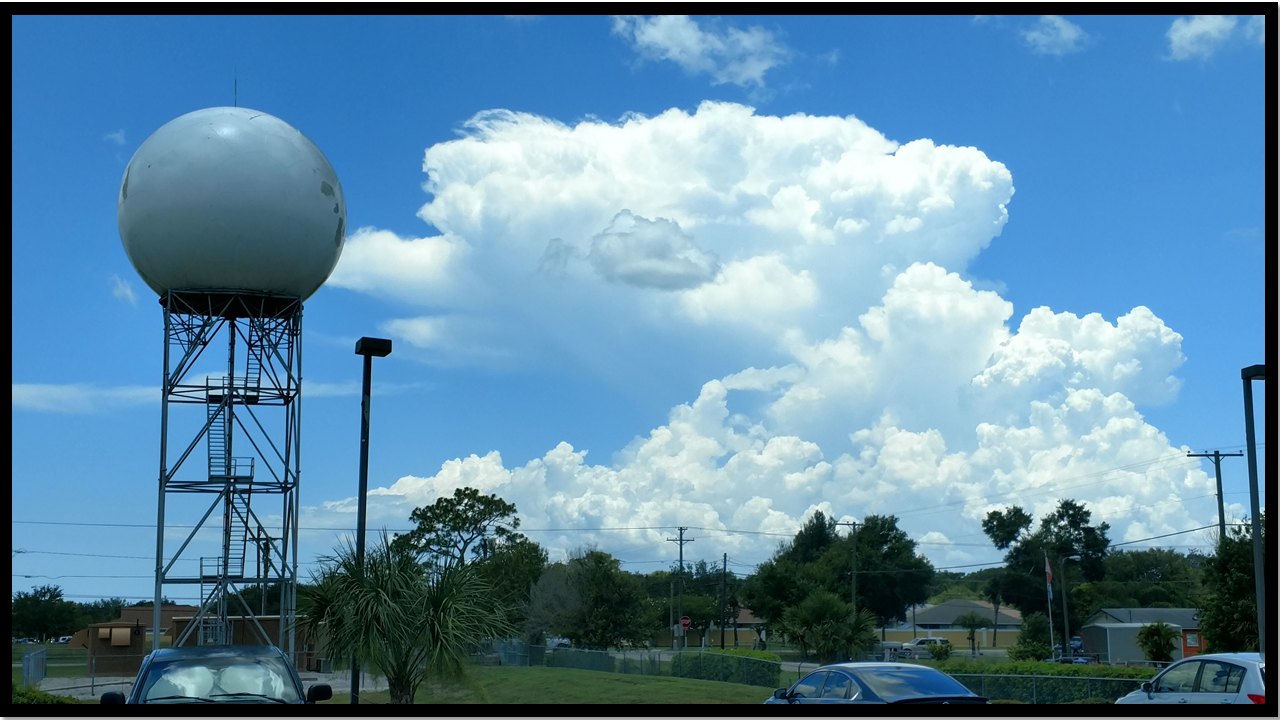
West Central and Southwest Florida is located in what is referred to as the Subtropics, between the Temperate Zone to the north and the Tropical Zone just to the south. During the late spring and summer months of June through September, the tropical climate shifts north. When combined with the influence of the surrounding oceans and daily sea breezes, this leads to our thunderstorm season. |
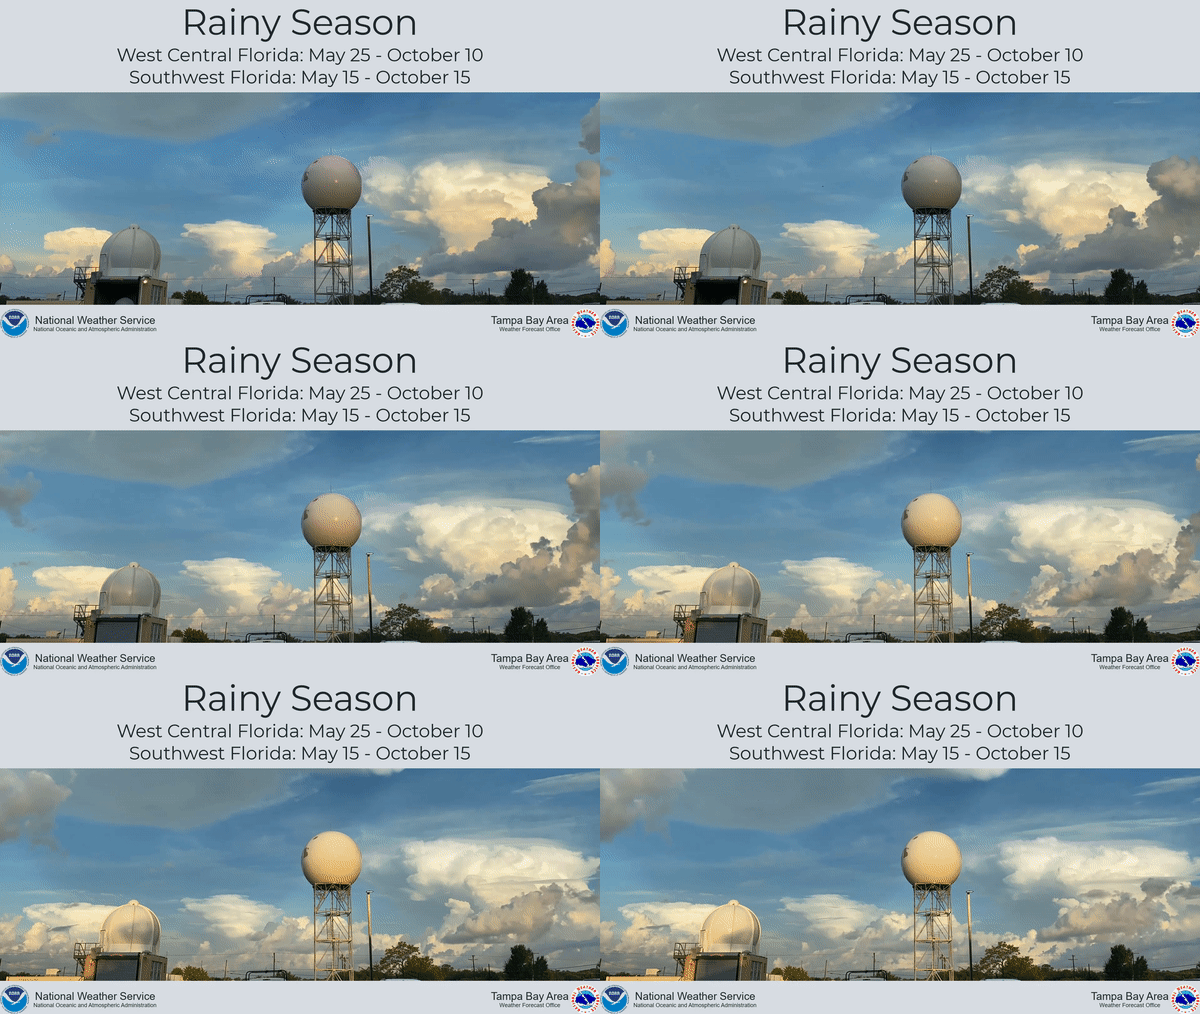
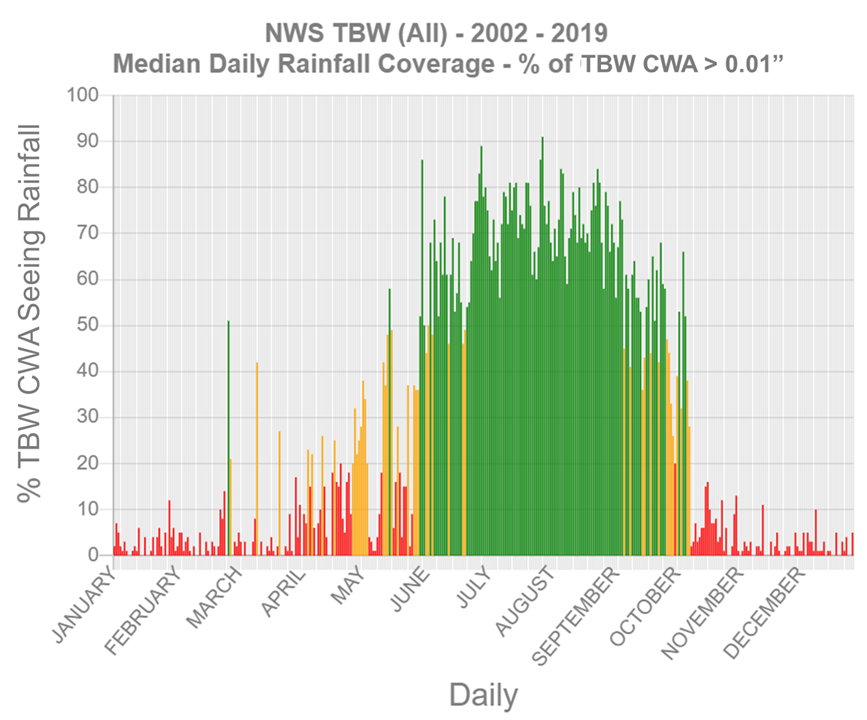
The National Weather Service Tampa Bay Area (Ruskin), Florida evaluated local thunderstorm science and climatology to define the rainy season for West Central and Southwest Florida and to increase public awareness of the associated hazards. The rainy season runs from May 15 to October 15 for Southwest Florida and from May 25 to October 10 for the rest of West Central Florida. The graph below illustrates how the rainfall coverage quickly increases for all of West Central and Southwest Florida in June and continues into early October. |
 |
The rainy season can begin abruptly in some years and the onset can take weeks to develop in other years. As described in the image below, there are several factors that need to come together in order for daily thunderstorms to occur. Therefore, the beginning of the rainy season is usually a transition period rather than a single date. Similar to hurricane season, the rainy season may occur before or after the aforementioned dates. |
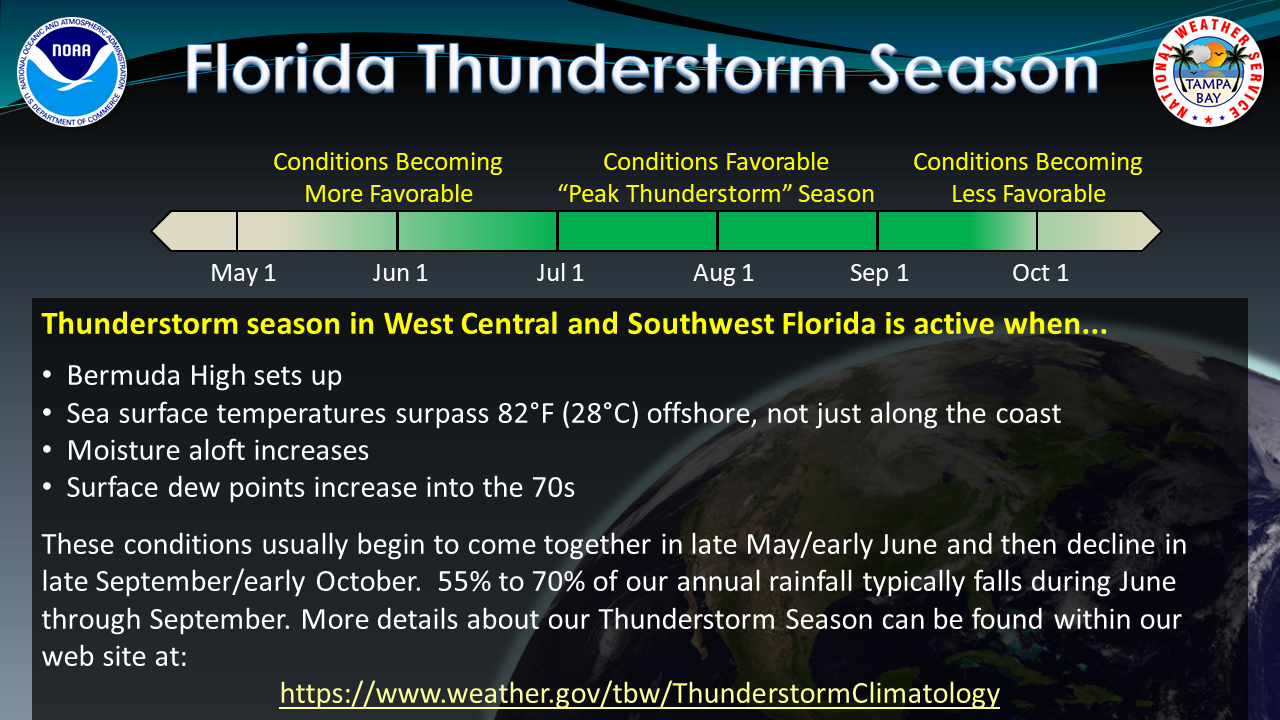 |
In general, the rainy season is characterized by warm, humid conditions with frequent showers and thunderstorms. The start date of the rainy season varies from year to year and is largely determined by the onset of almost daily showers and thunderstorms over the Florida peninsula, as well as late night and morning showers and thunderstorms over the waters of the eastern Gulf of America. As described in the graphic above, this is typically accompanied by an increase in humidity with persistent dew point values above 70°F, daily low temperatures in the 70s to around 80°, and high temperatures in the upper 80s to middle 90s. To determine if and when moisture aloft is increasing, meteorologists with the National Weather Service Tampa Bay Area turn to Precipitable Water (PWAT or PW). In general terms, PW is all of the moisture that could be squeezed out in a vertical column of the atmosphere up to about 30,000 feet over a given location. The PW value is measured in millimeters or inches and is usually calculated from the twice daily upper air balloon soundings, participating Aircraft Communications Addressing and Reporting System (ACARS) or Aircraft Meteorological Data Relay (AMDAR) aviation partners, satellite-derived total PW values, and/or from weather models. The values of PW range from 0 to about 76 millimeters (or up to around 3 inches), but can vary greatly depending on the season and location. For West Central and Southwest Florida, typical values during our thunderstorm season range from around 43 to 48 mm (1.7 to 1.9 inches). When values fall to around 38 mm (1.5 inches) or less, thunderstorm coverage is usually very limited. |
The rainy season usually has three phases:
|
During the rainy season, the location and timing favored for thunderstorm development on any given day changes based on the position and strength of the Bermuda High. The National Weather Service Tampa Bay Area, FL has evaluated the climatological placement and strength of this semi-permanent high pressure feature to define eight varying subtropical ridge wind “regimes" (with a ninth sub-regime of regime eight) to aid in daily thunderstorm forecasting. For more information on the differences seen in daily thunderstorms associated with these differing positions of the subtropical ridge (Regimes 1 - 8) visit https://www.weather.gov/tbw/ThunderstormClimatology. Here you will find the thunderstorm climatology for your Florida city, county, region, or media market. |
Some other helpful links are listed below: SPC Observed Soundings: https://www.spc.noaa.gov/exper/soundings/ SPC Sounding Climatology: https://www.spc.noaa.gov/exper/soundingclimo/ SPC Observed Surface and Upper Air Maps: https://www.spc.noaa.gov/obswx/maps/ Sea Surface Temperature Maps: https://www.ospo.noaa.gov/Products/ocean/sst/contour/index.html https://weather.msfc.nasa.gov/cgi-bin/sportPublishData.pl?dataset=sst&product=sport_gomex1 |
Locating the Correct Regime: |
|||||||||||||||||||||||||||||||||||||||
During the "Rainy Season" there are a few ways to find the correct regime.
|
|||||||||||||||||||||||||||||||||||||||
Method 1: Check the NWS Tampa Bay Area Forecast Discussion (AFDTBW) for the Sea Breeze Regime section.
|
|||||||||||||||||||||||||||||||||||||||
Method 2: Go to the Storm Prediction Center Observed Sounding Archive web page and follow the example below.
|
|||||||||||||||||||||||||||||||||||||||
Method 3: (at any NWS office) Check the morning upper air sounding in AWIPS.
|
|||||||||||||||||||||||||||||||||||||||
Method 4: (at NWS Tampa Bay) Open GFE in AWIPS.
|
|||||||||||||||||||||||||||||||||||||||
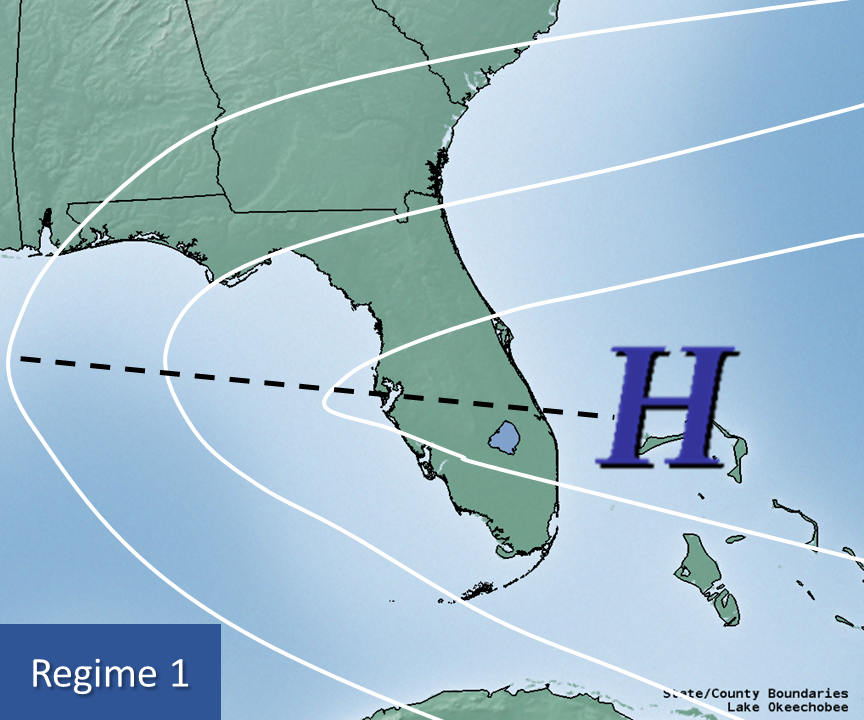
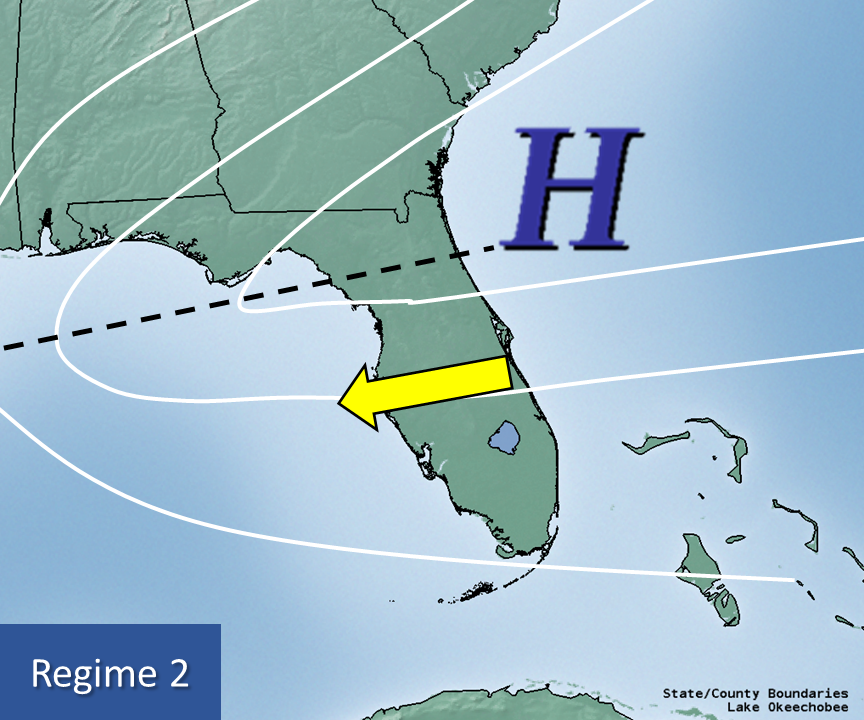
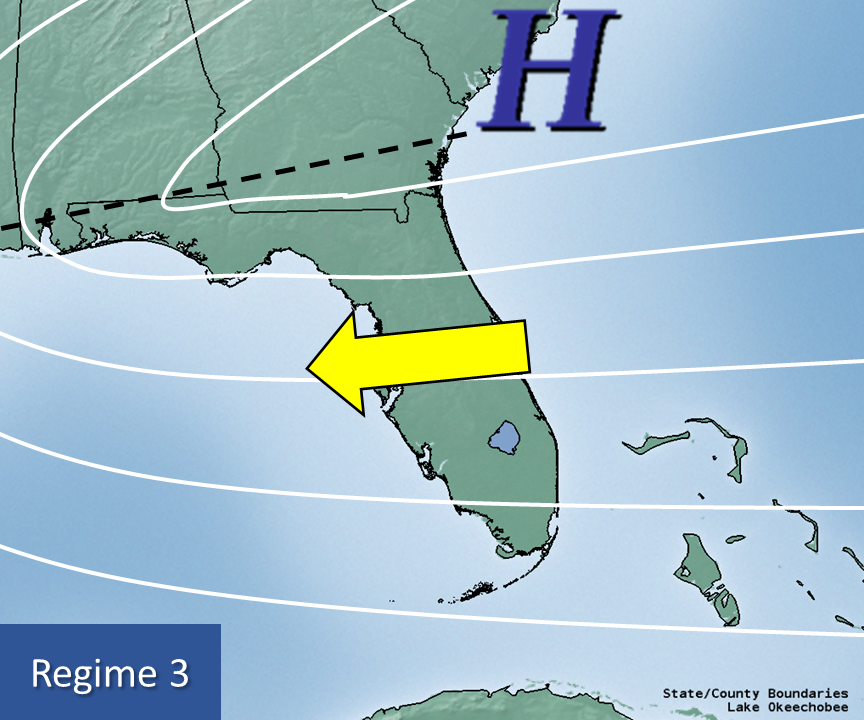
| Regime 1 | Regime 2 | Regime 3 |
 |
 |
 |
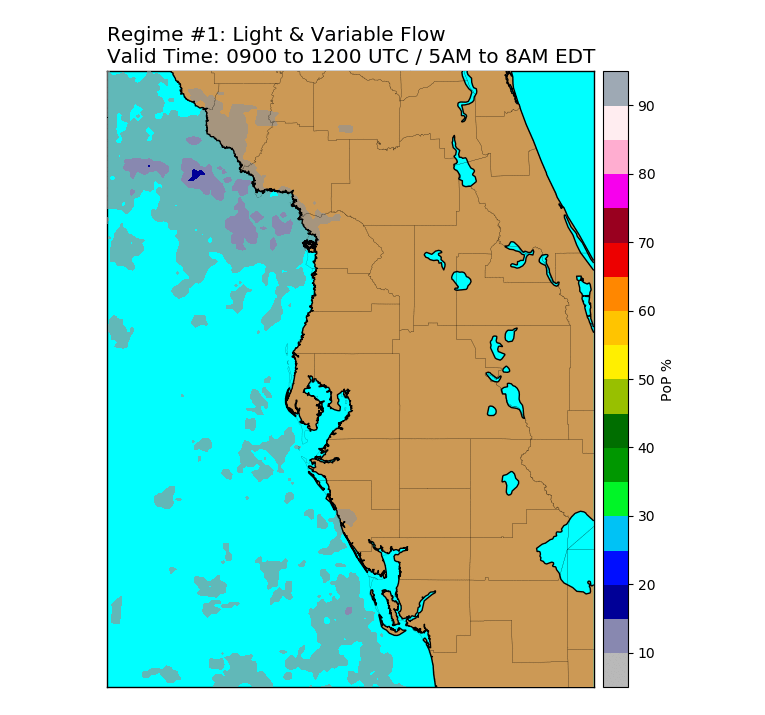
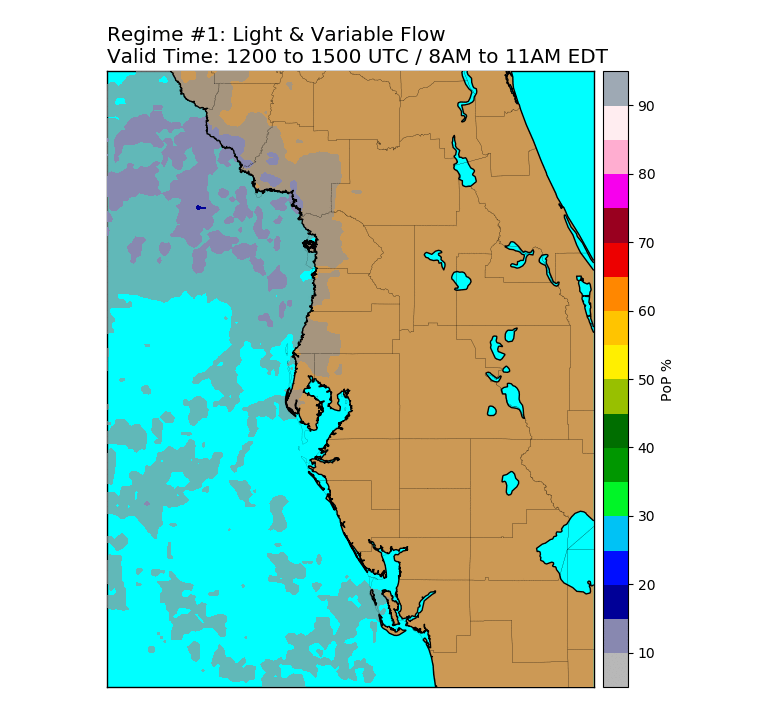
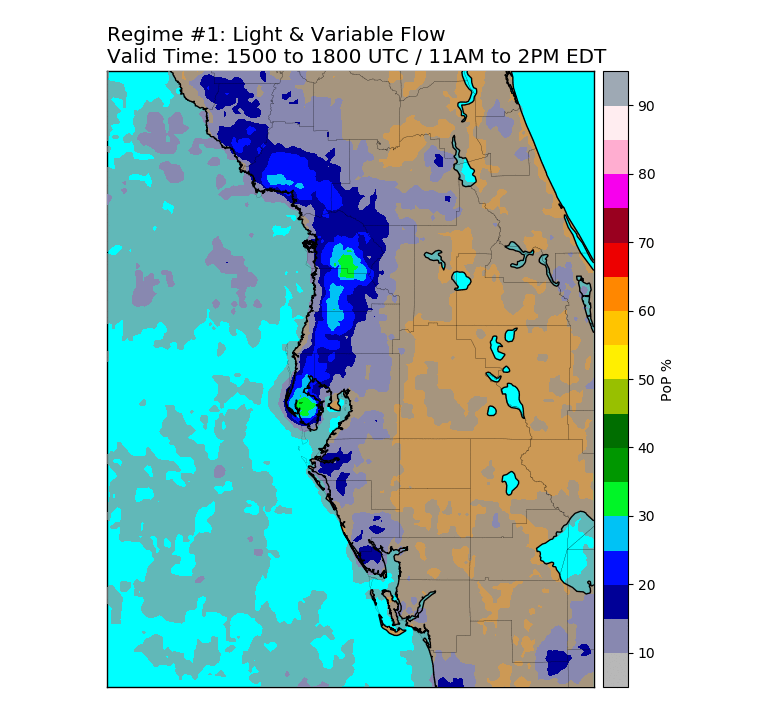
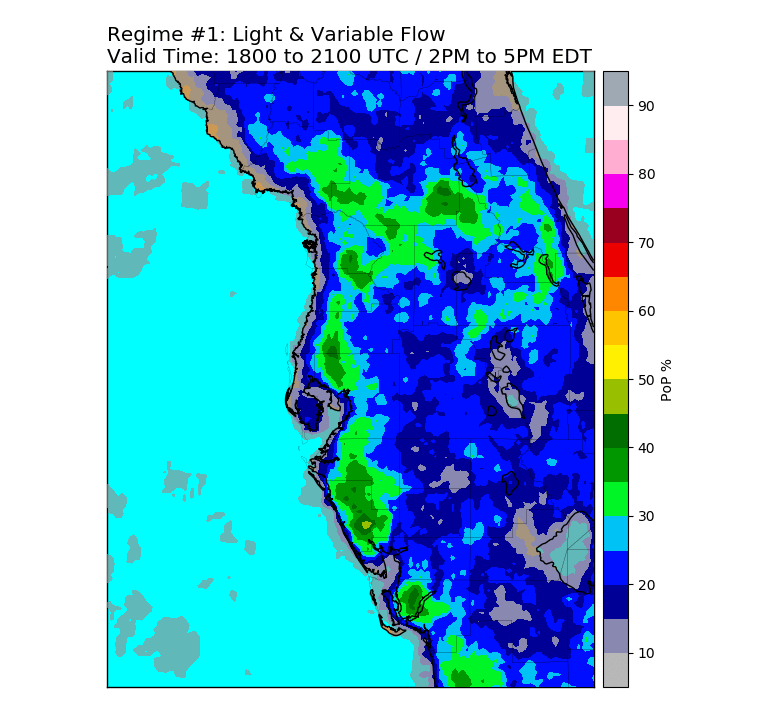
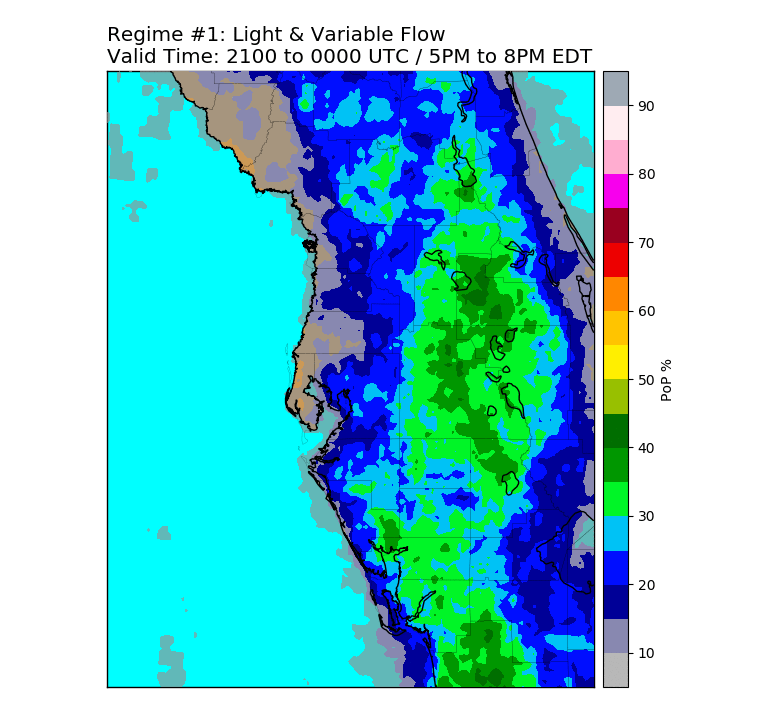
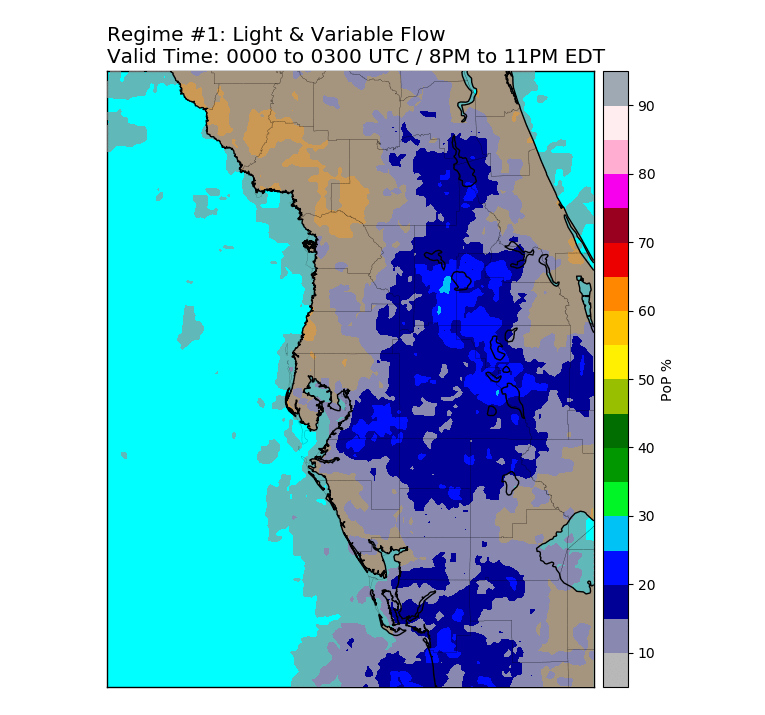
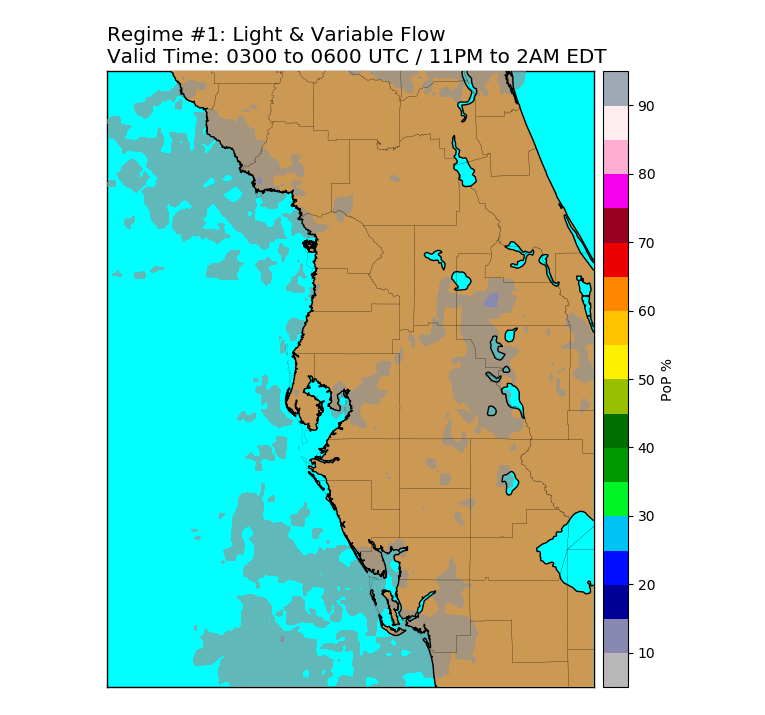
| 1000-700mb Mean Vector Flow Direction: Variable (Any Direction) Speed: < 5 knots 98 Total Days in Climatology |
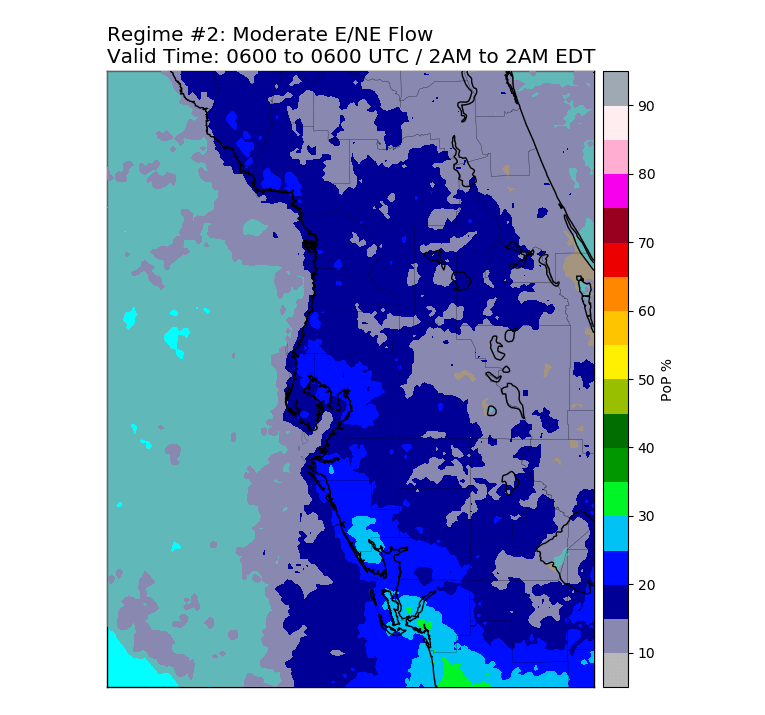
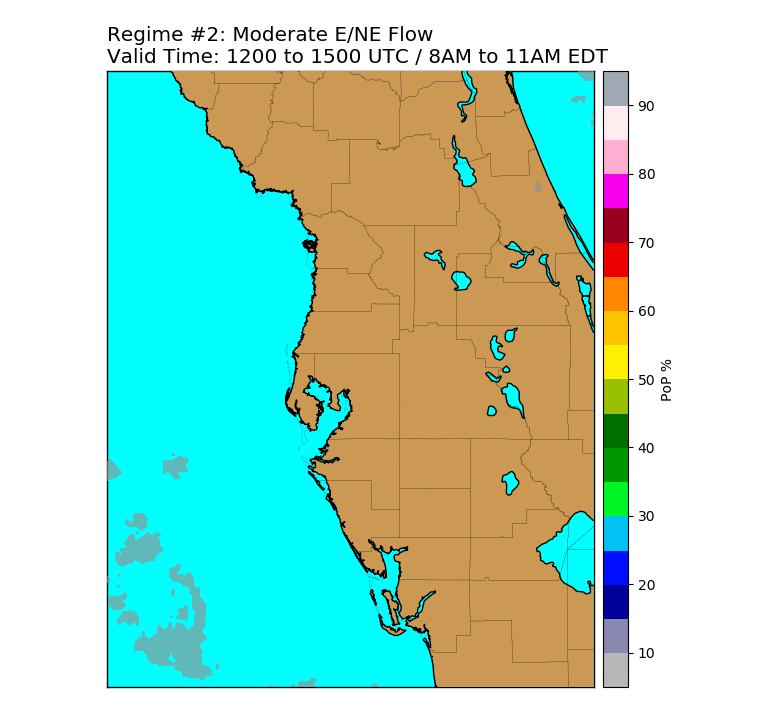
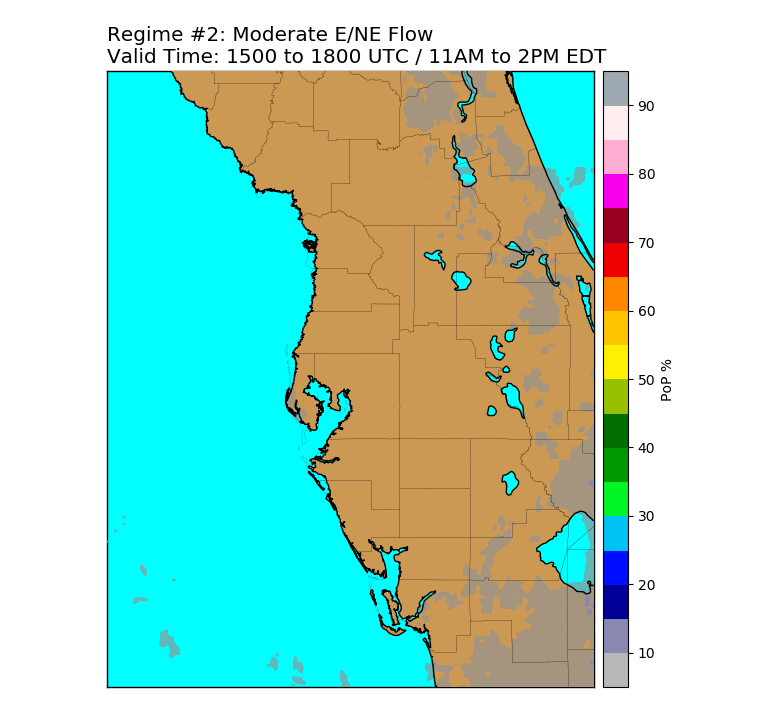
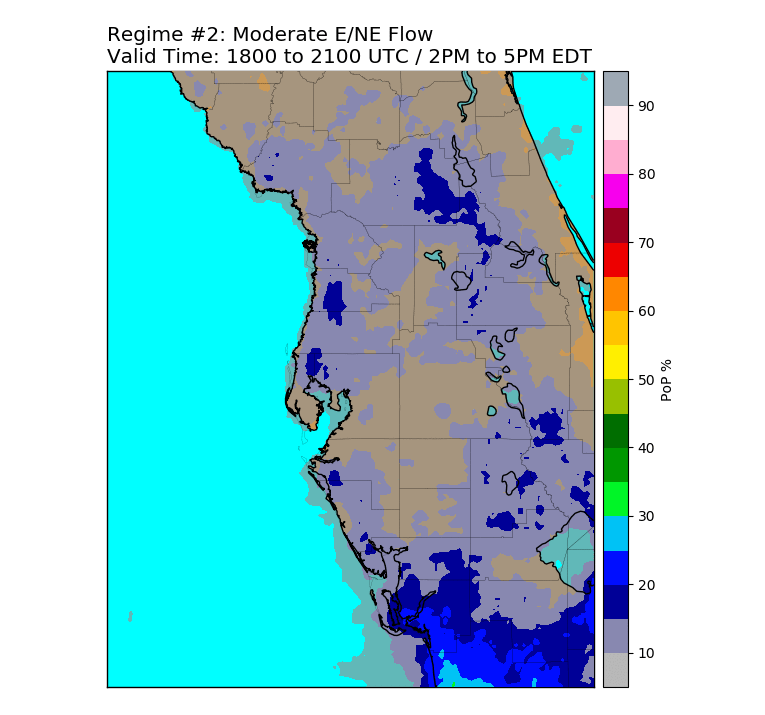
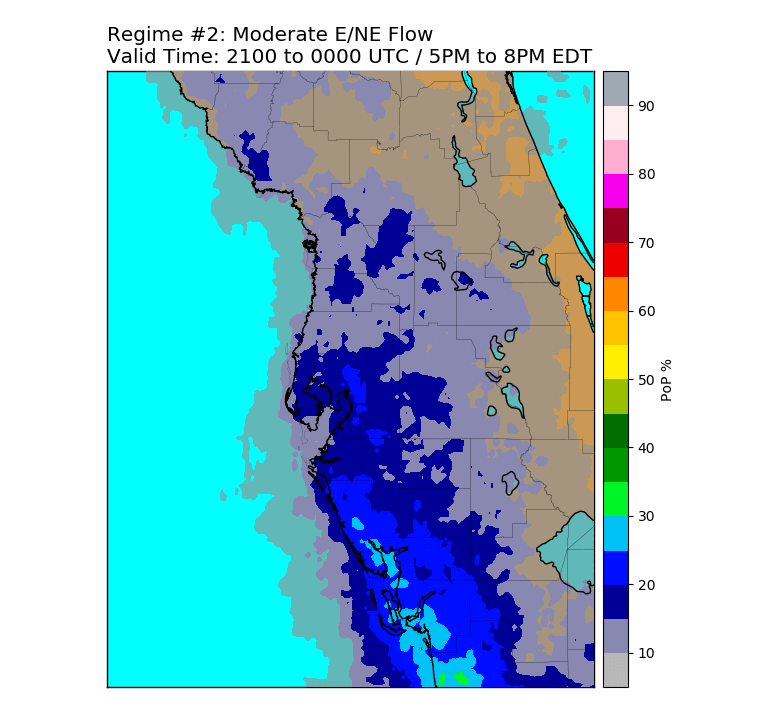
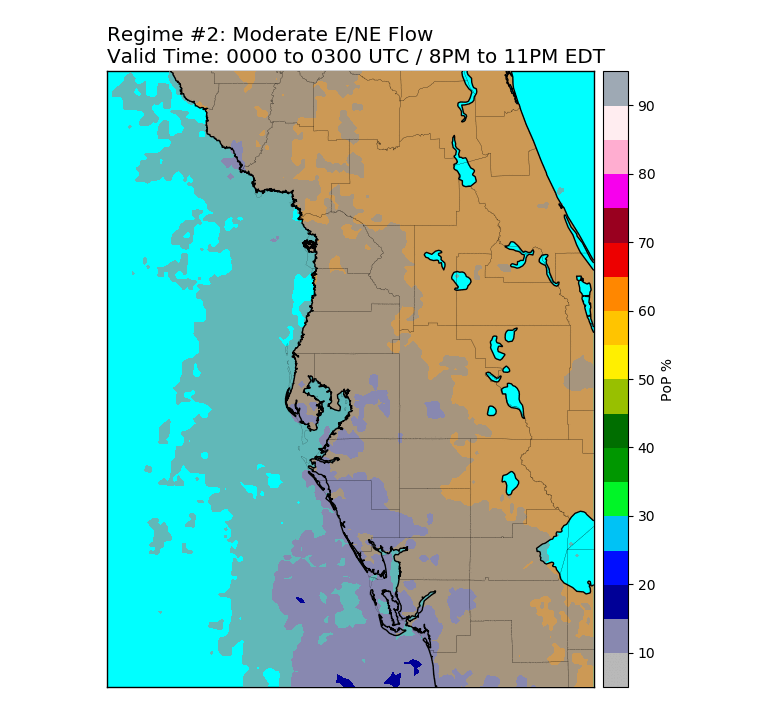
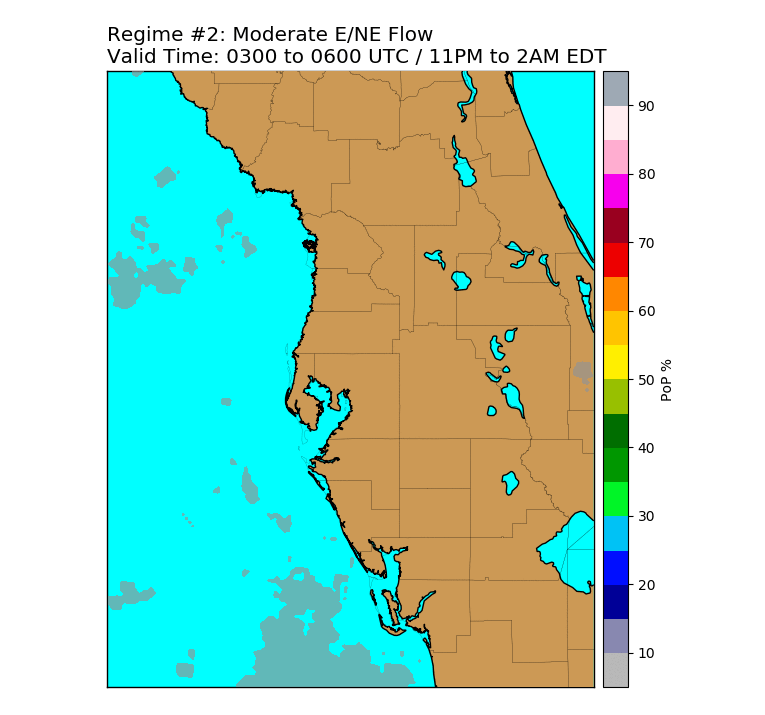
1000-700mb Mean Vector Flow Direction: NE/E (360° to 120°) Speed: 5 to 10 knots 249 Total Days in Climatology |
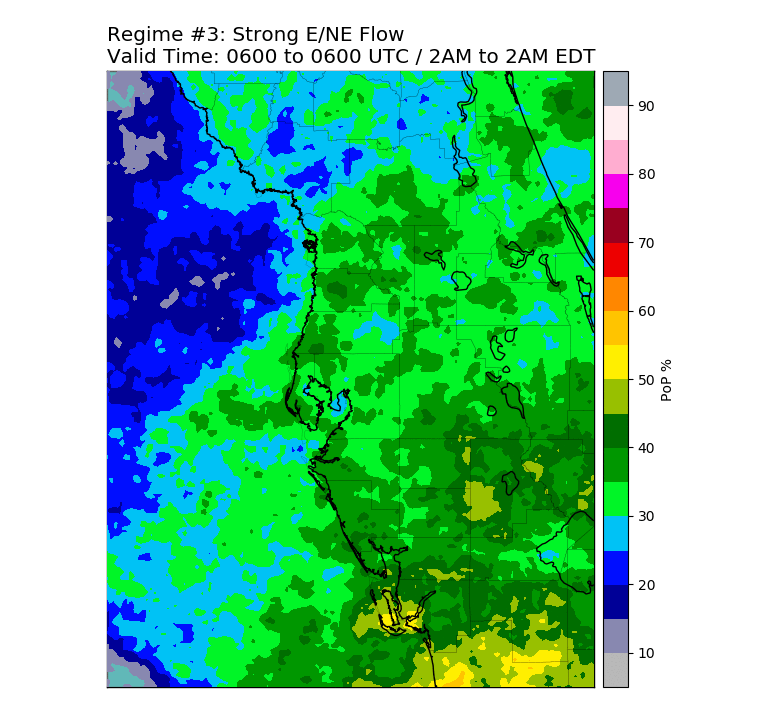
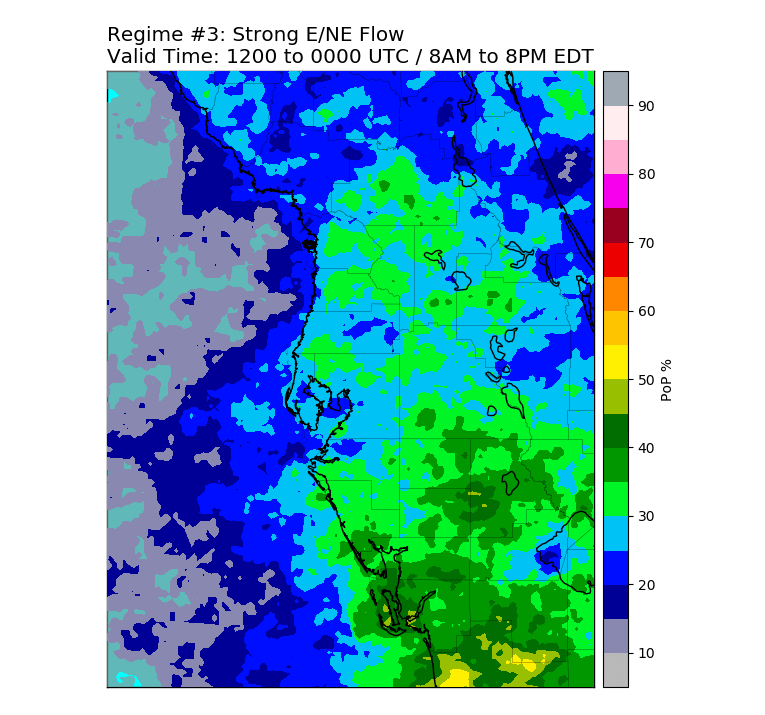
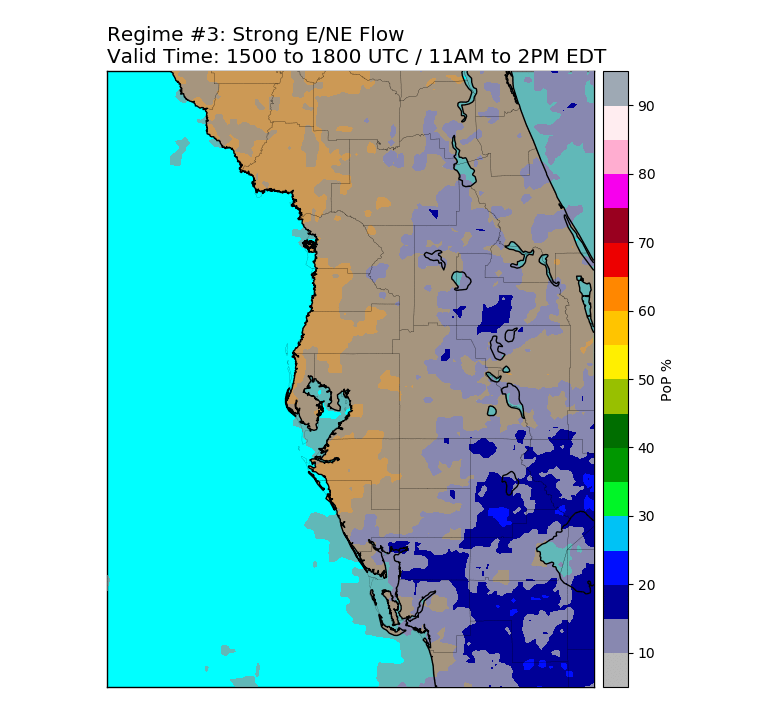
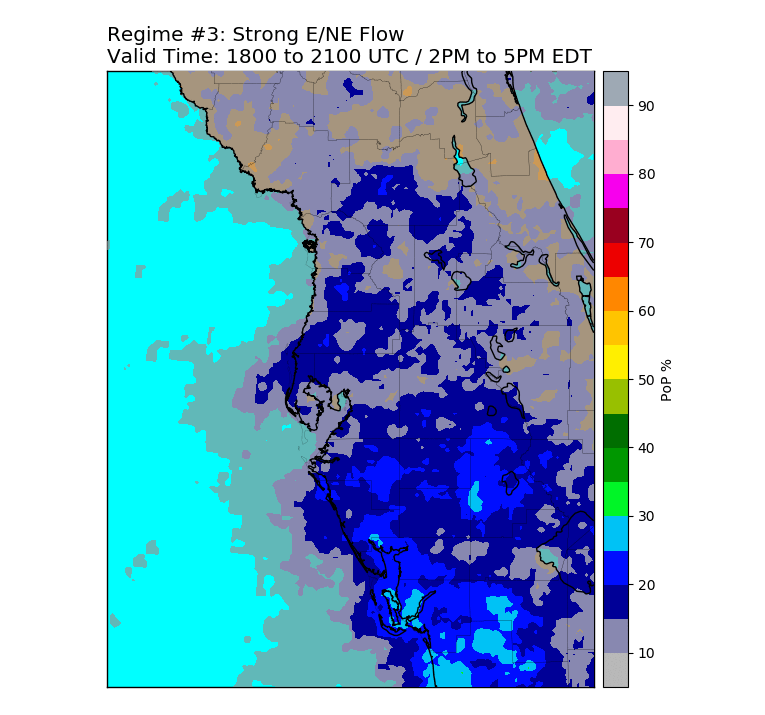
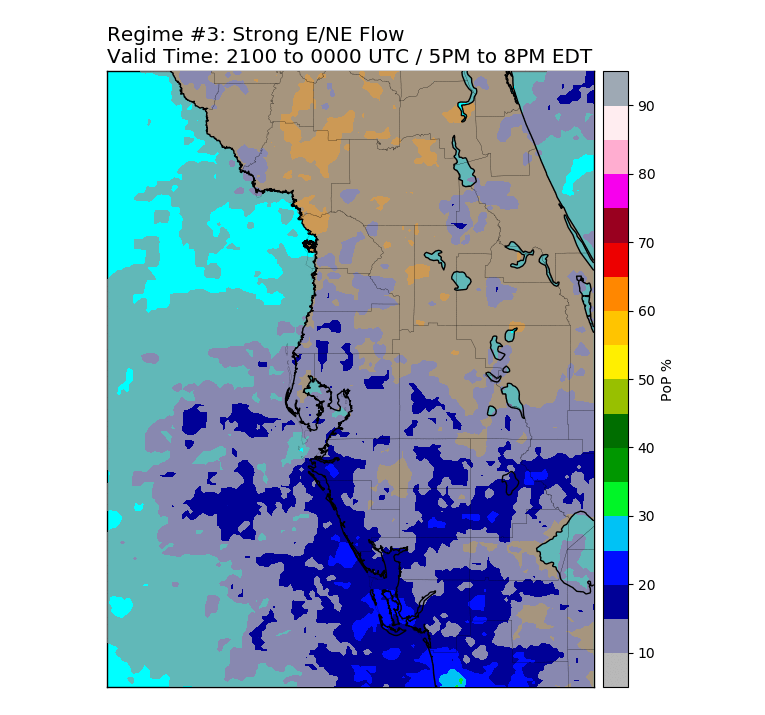
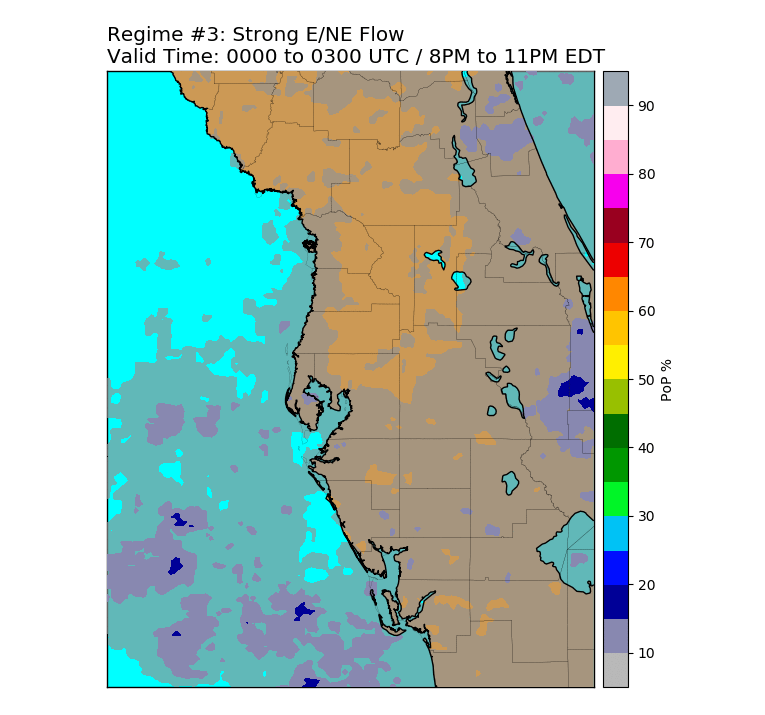
1000-700mb Mean Vector Flow Direction: NE/E (360° to 120°) Speed: > 10 knots 118 Total Days in Climatology |
| |
||
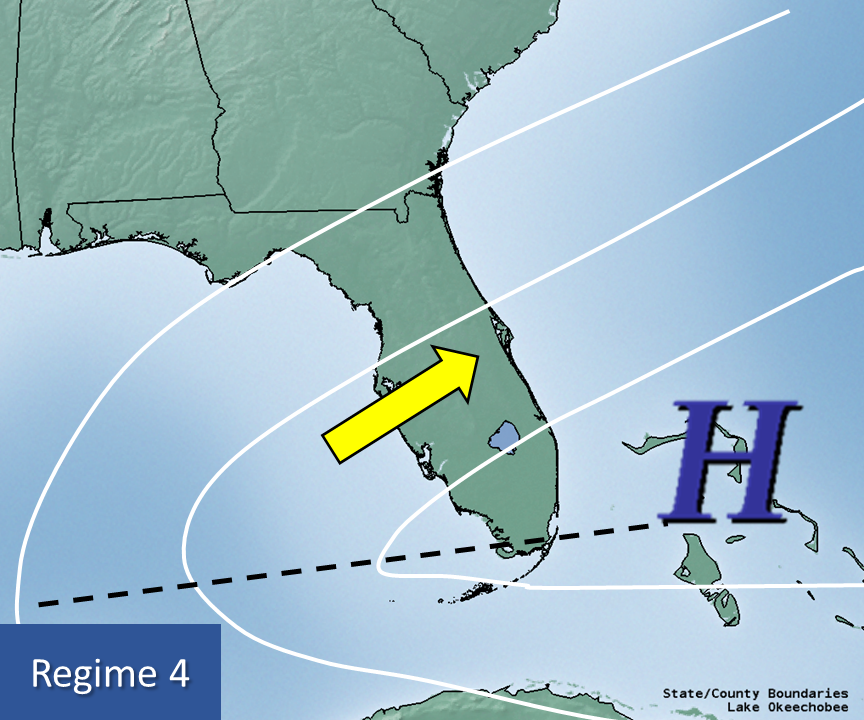
| Regime 4 | Regime 5 | Regime 6 |
 |
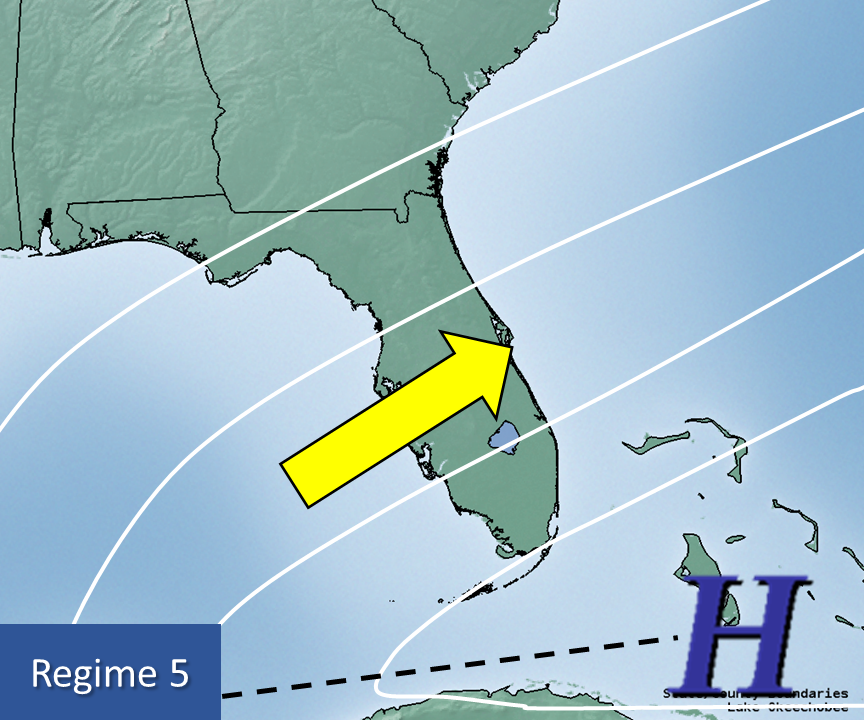 |
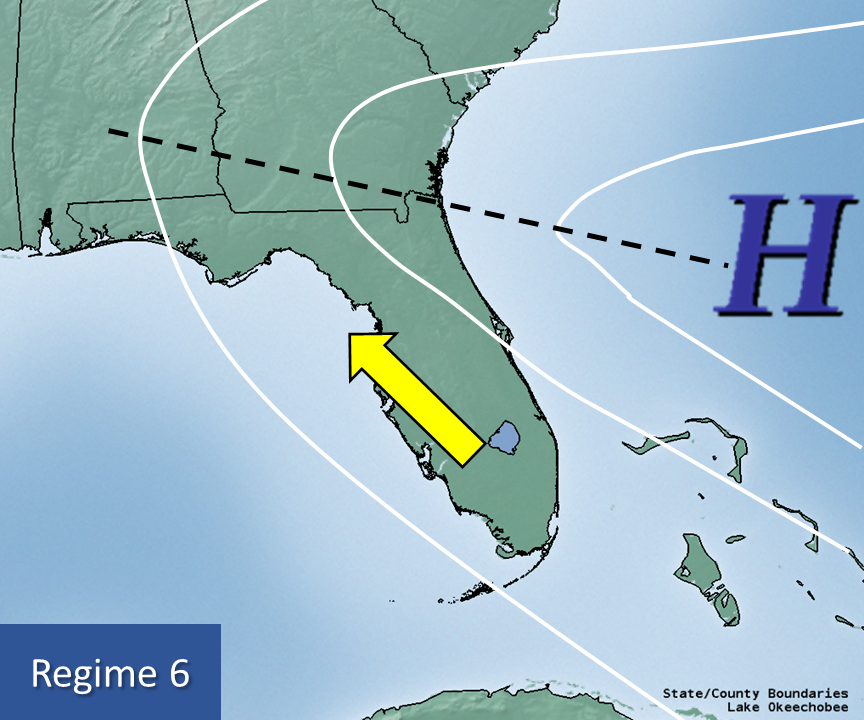 |
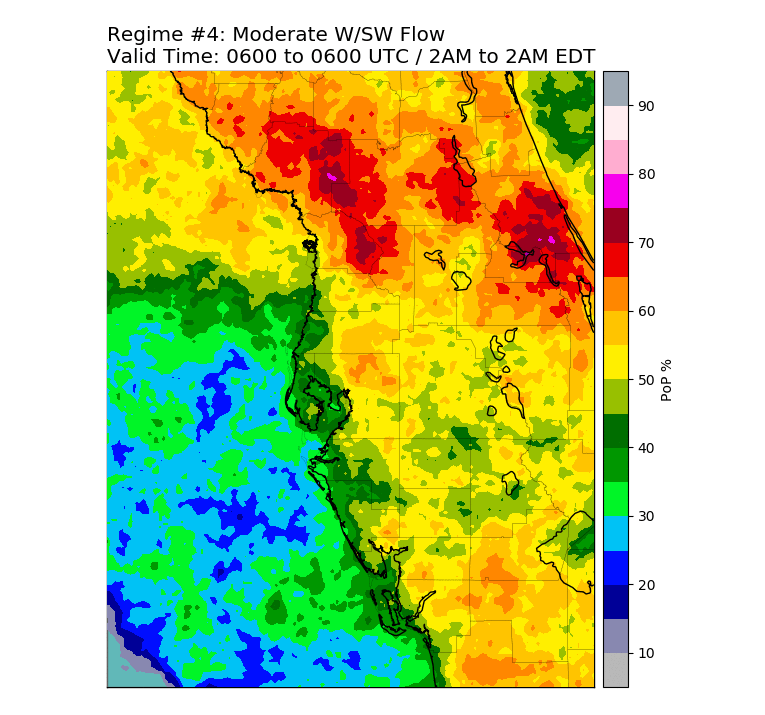
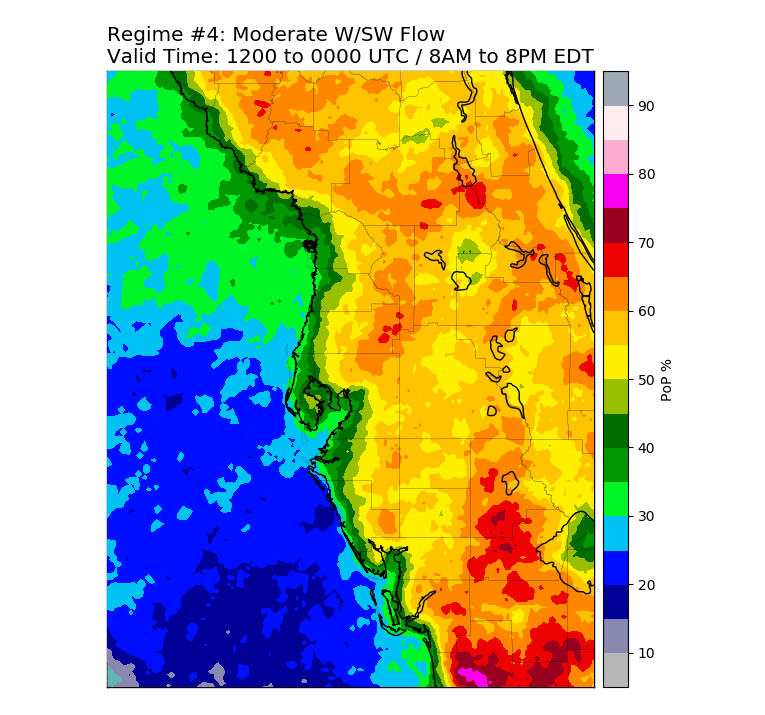
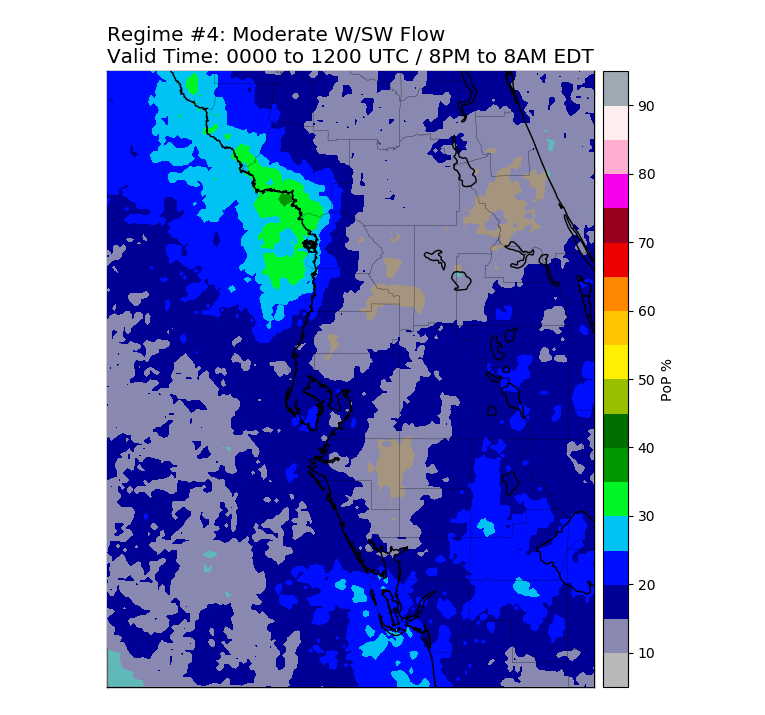
| 1000-700mb Mean Vector Flow Direction: SW/W (190° to 290°) Speed: 5 to 10 knots 428 Total Days in Climatology |
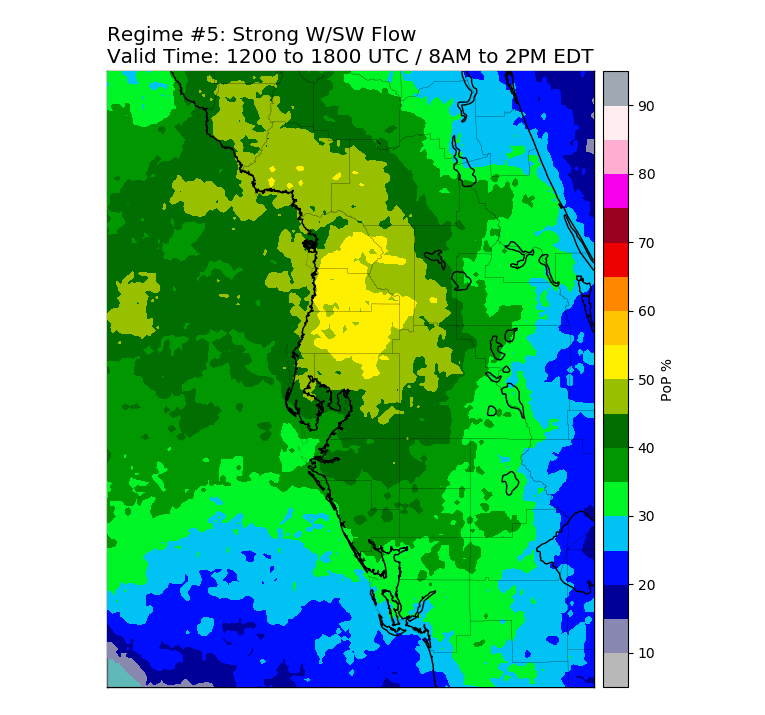
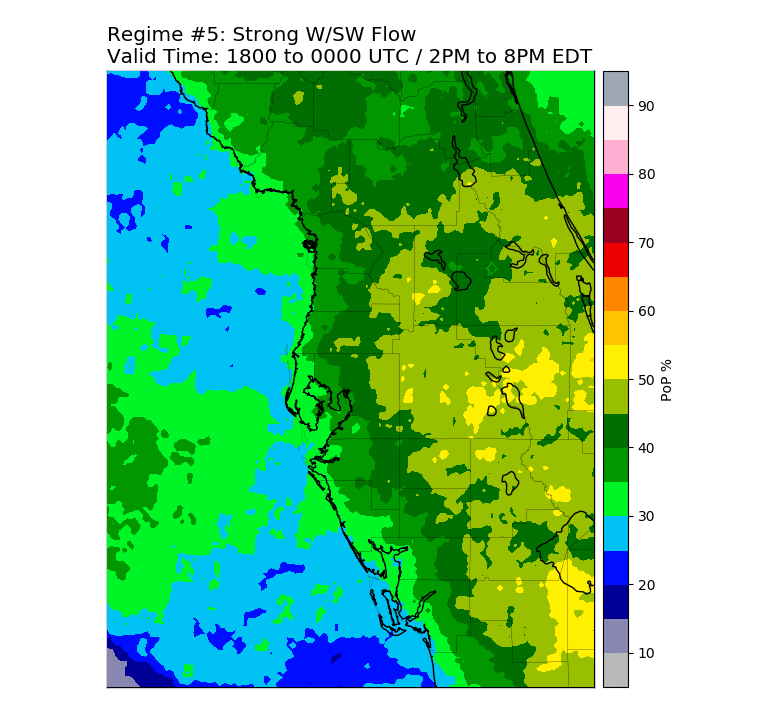
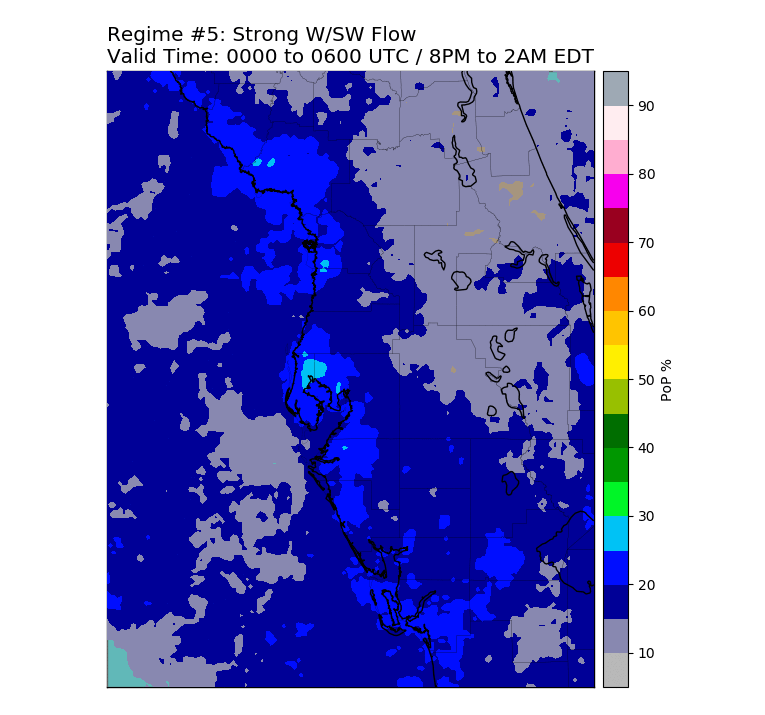
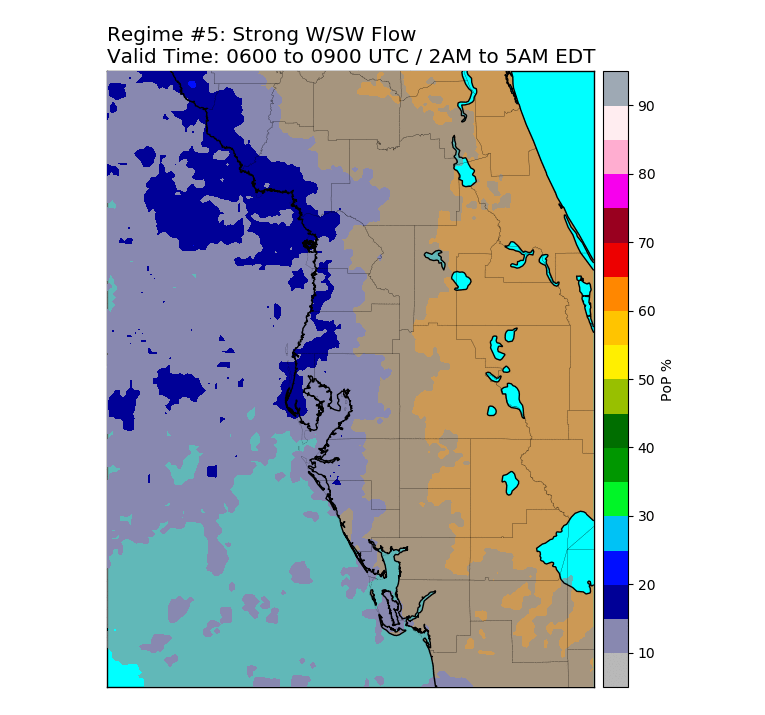
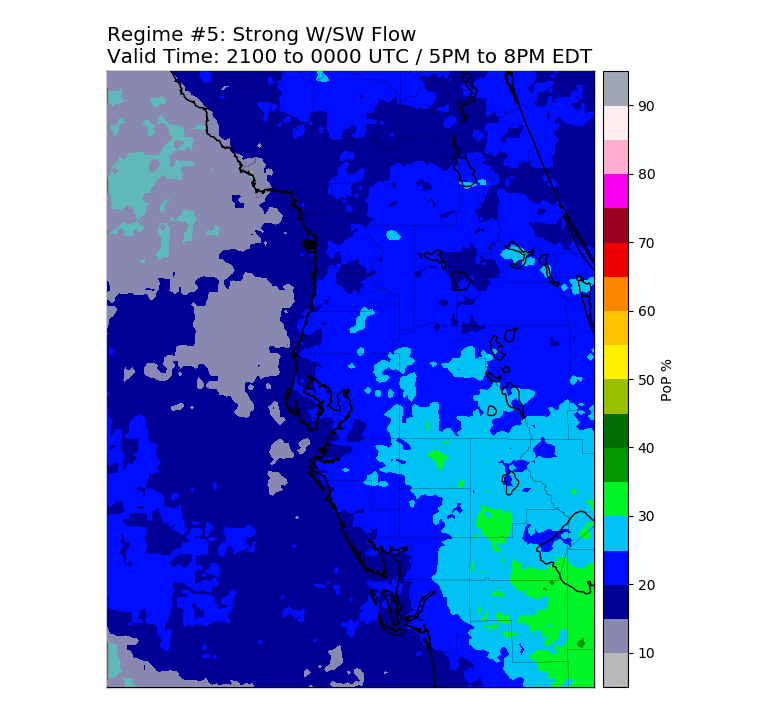
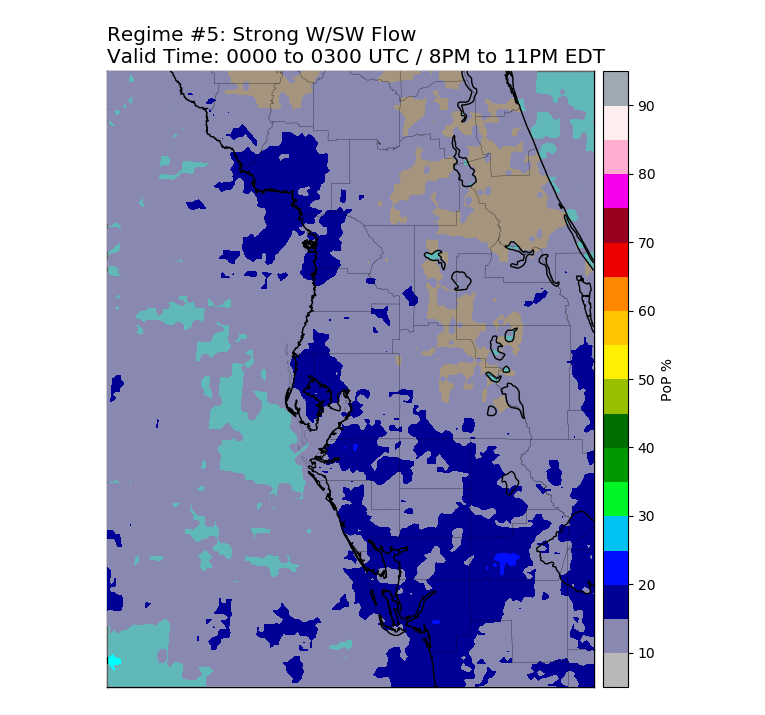
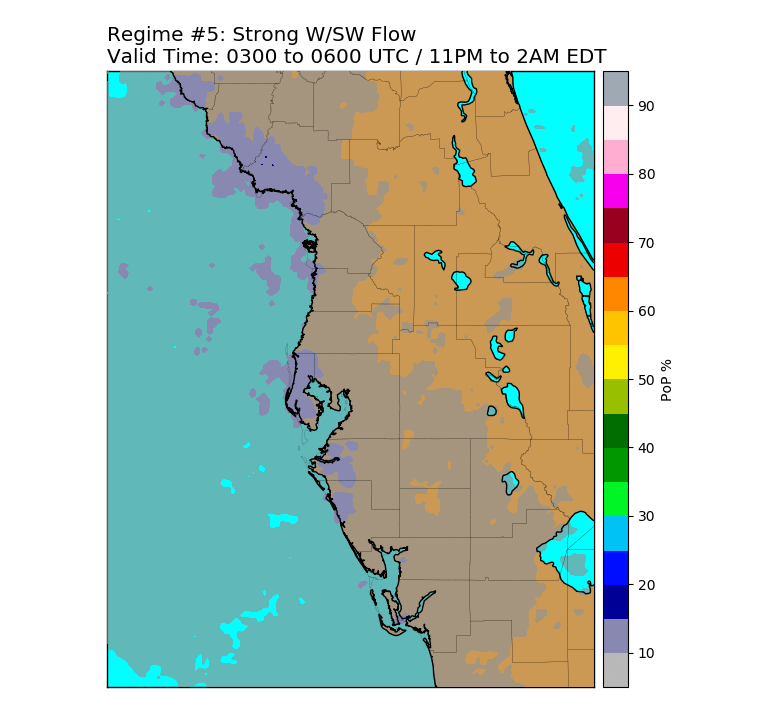
1000-700mb Mean Vector Flow Direction: SW/W (190° to 290°) Speed: > 10 knots 268 Total Days in Climatology |
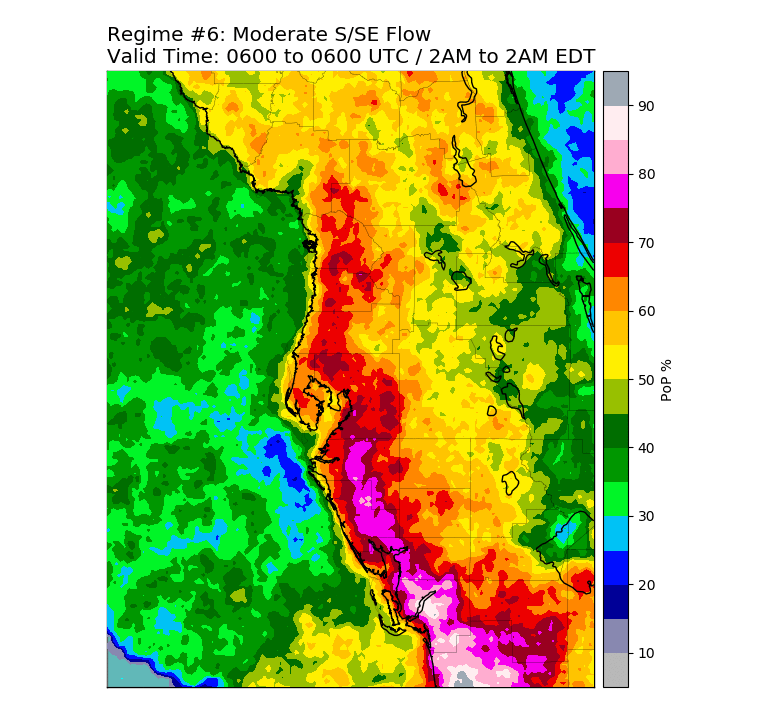
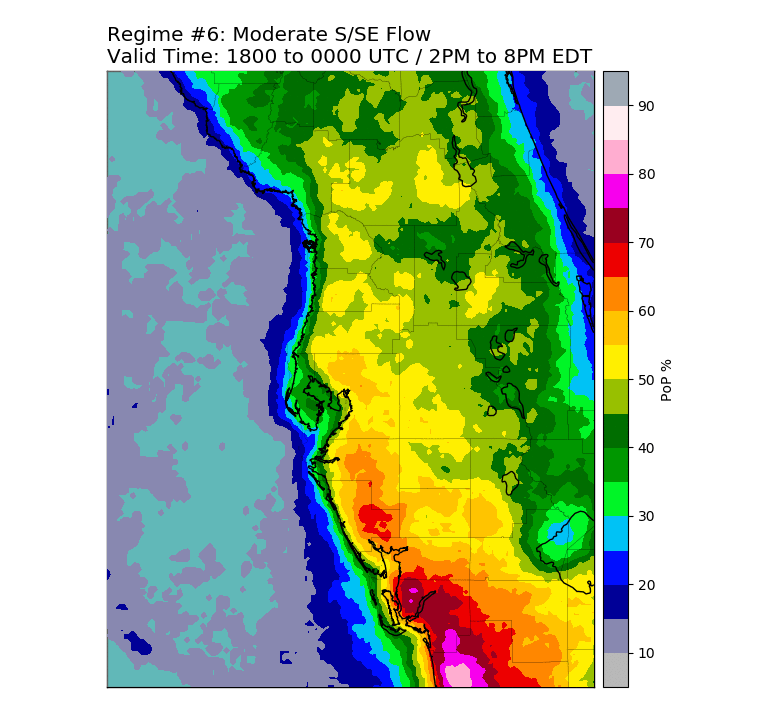
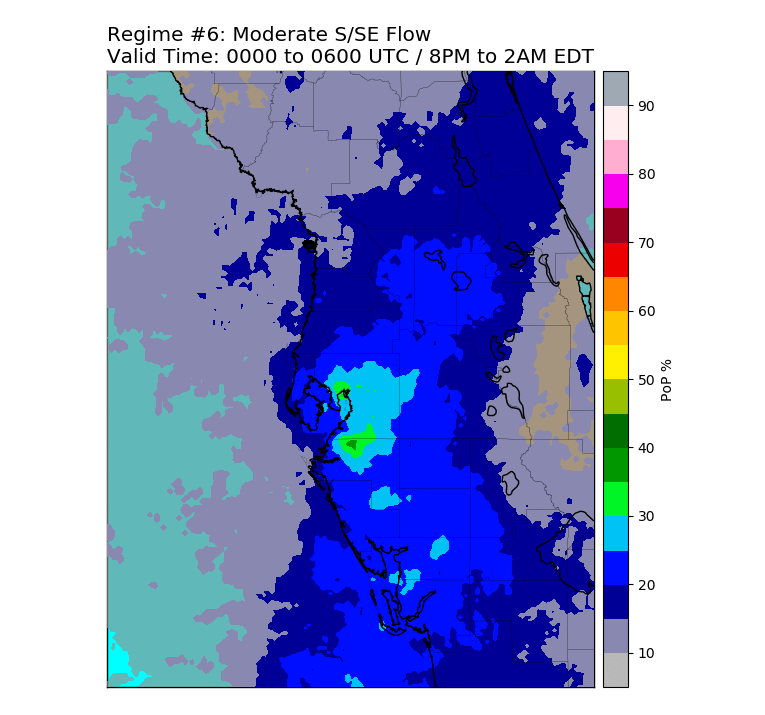
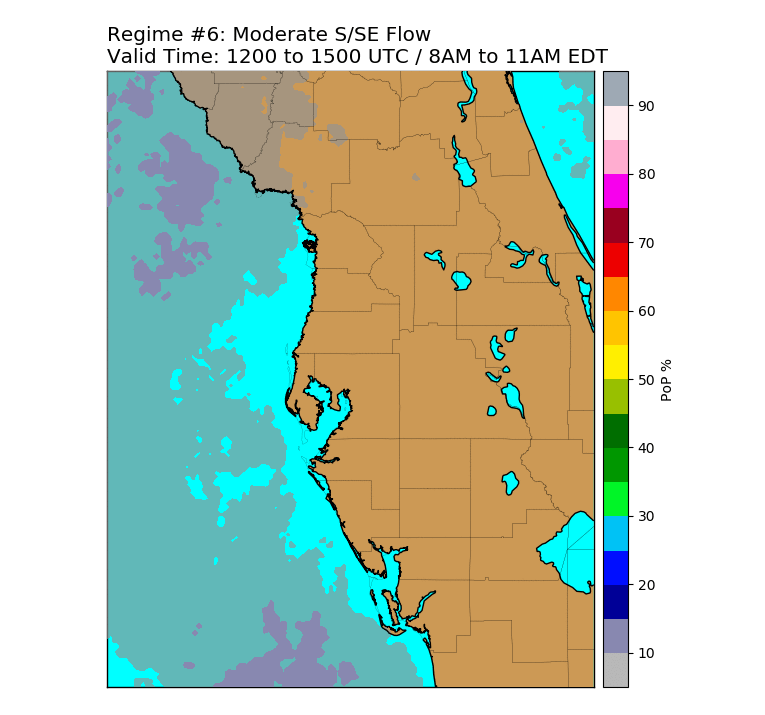
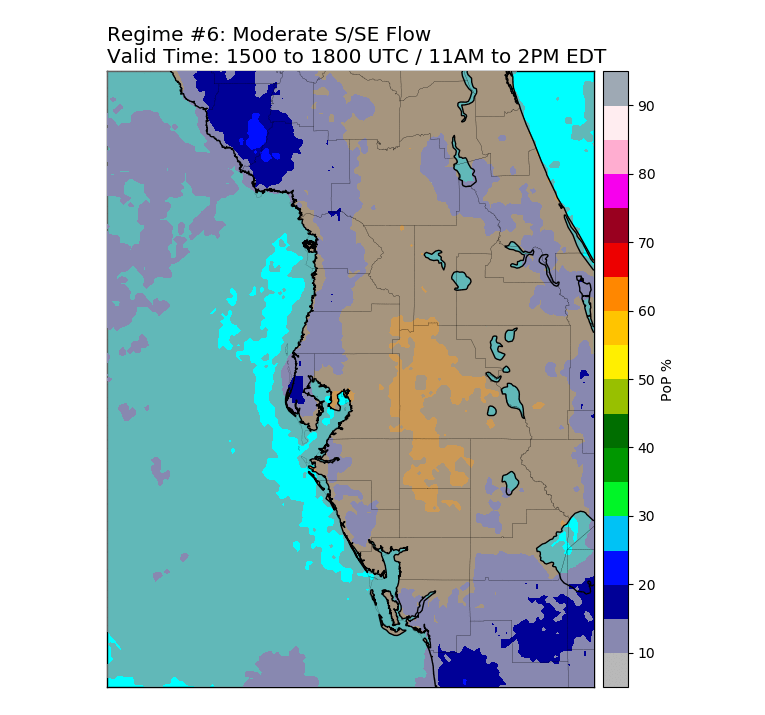
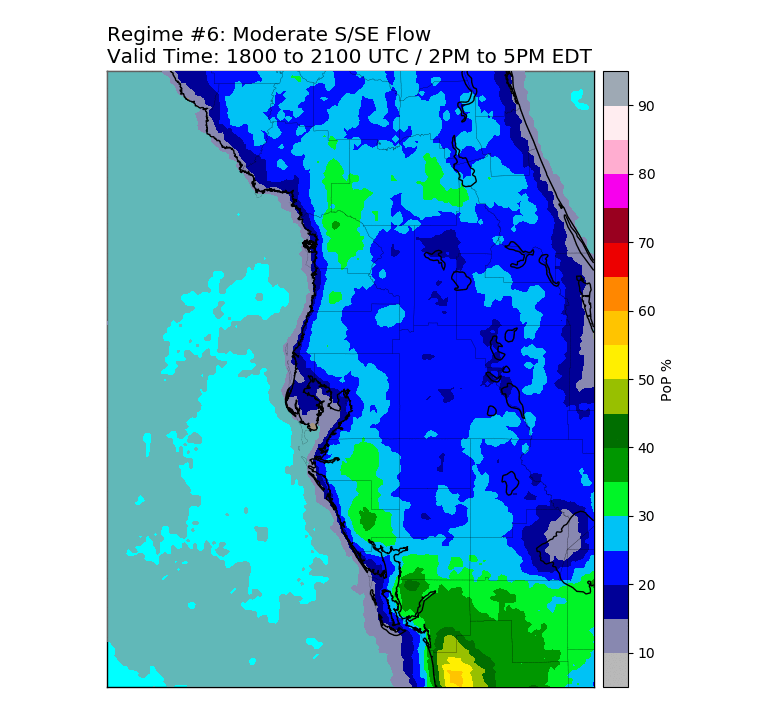
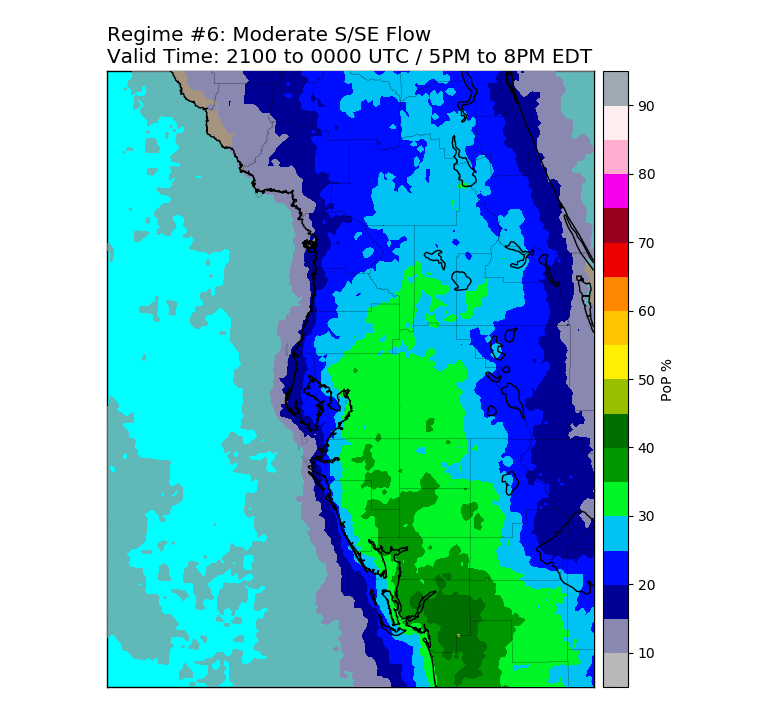
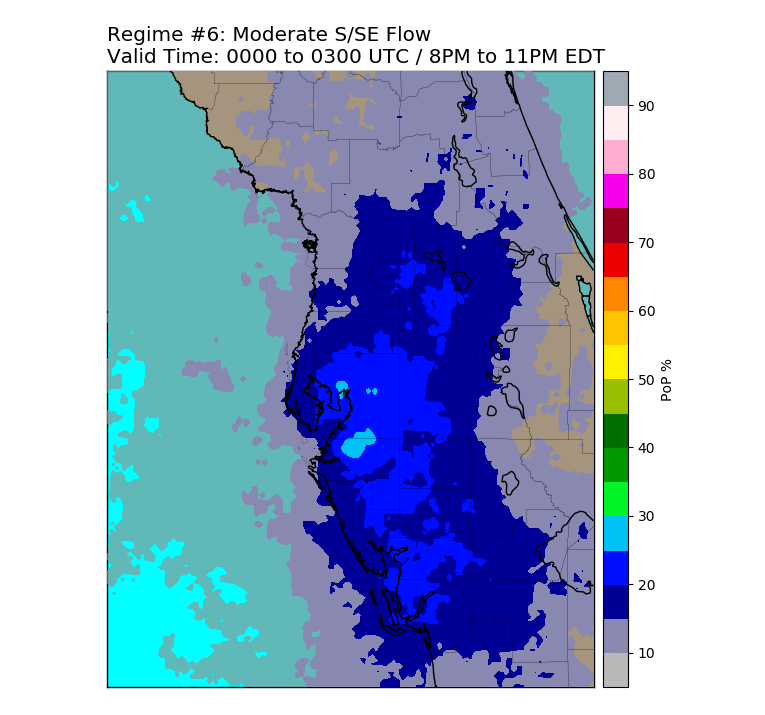
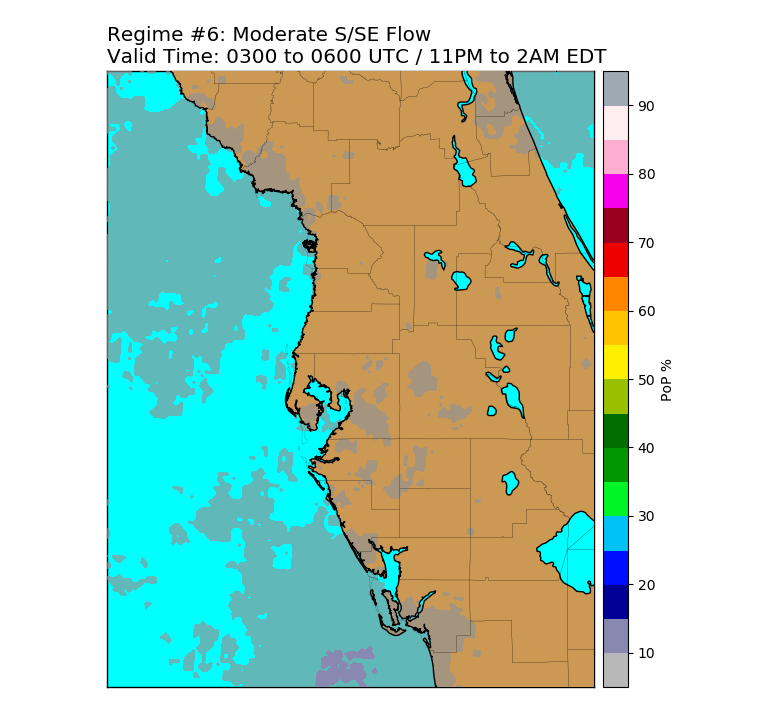
1000-700mb Mean Vector Flow Direction: SE/S (120° to 190°) Speed: 5 to 10 knots 458 Total Days in Climatology |
| |
||
| Regime 7 | Regime 8 | |
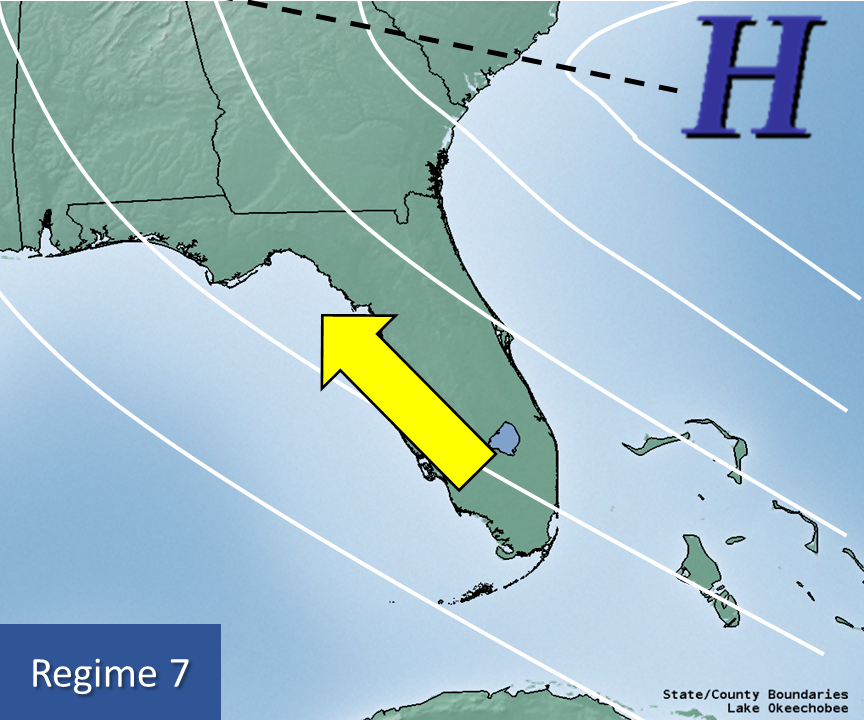 |
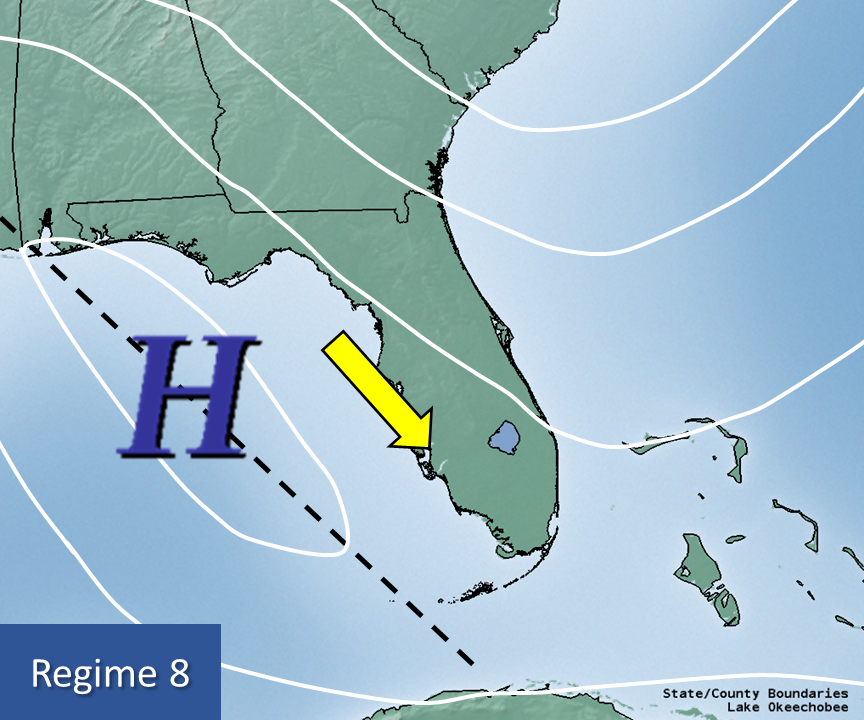 |
|
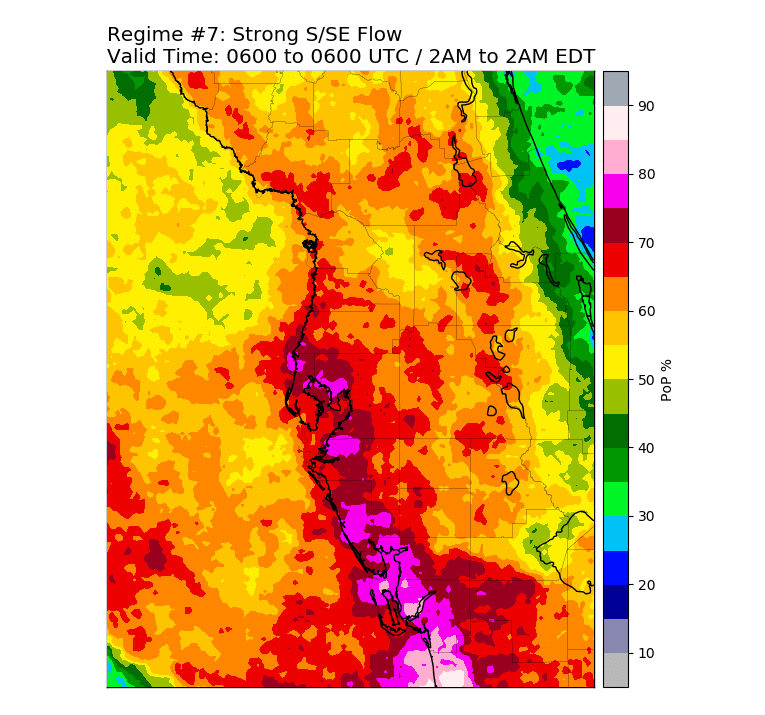
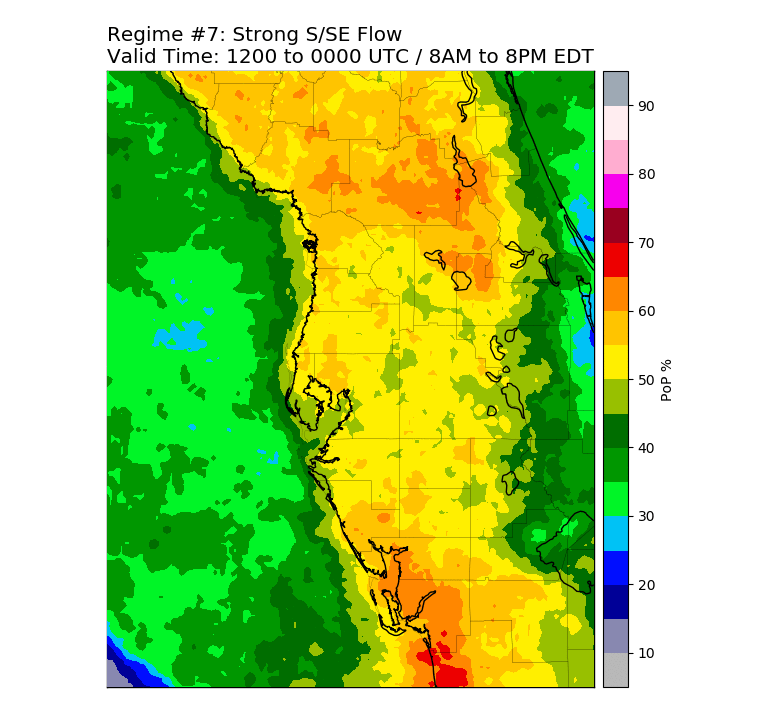
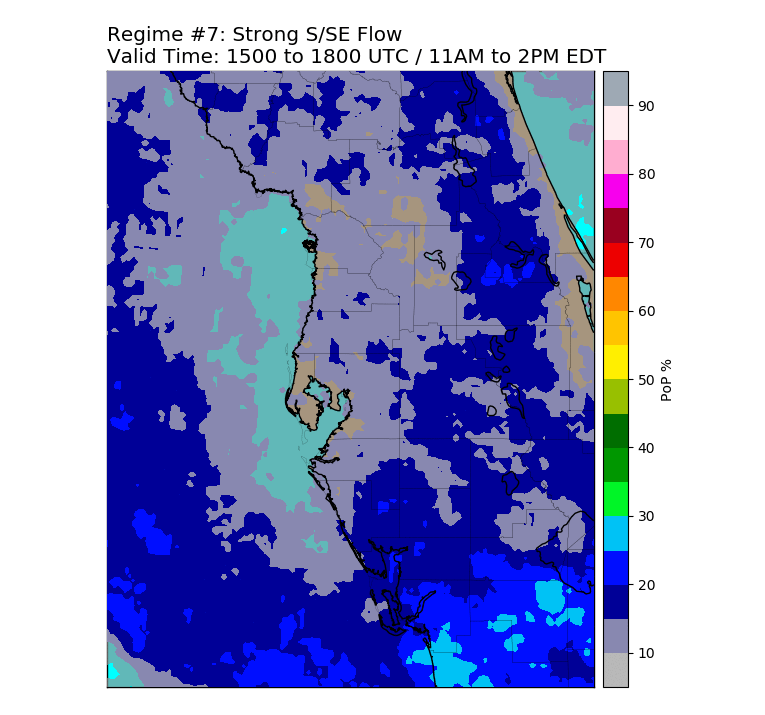
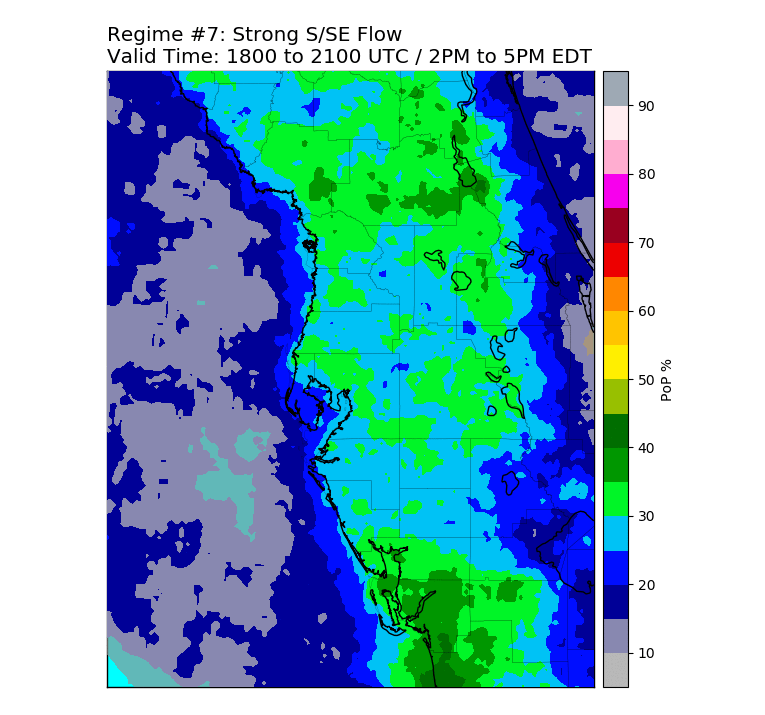
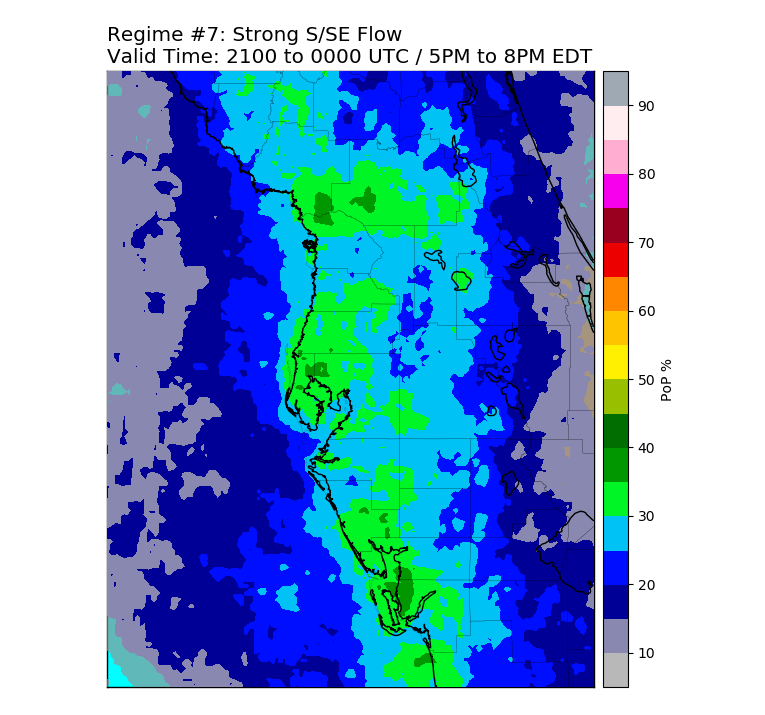
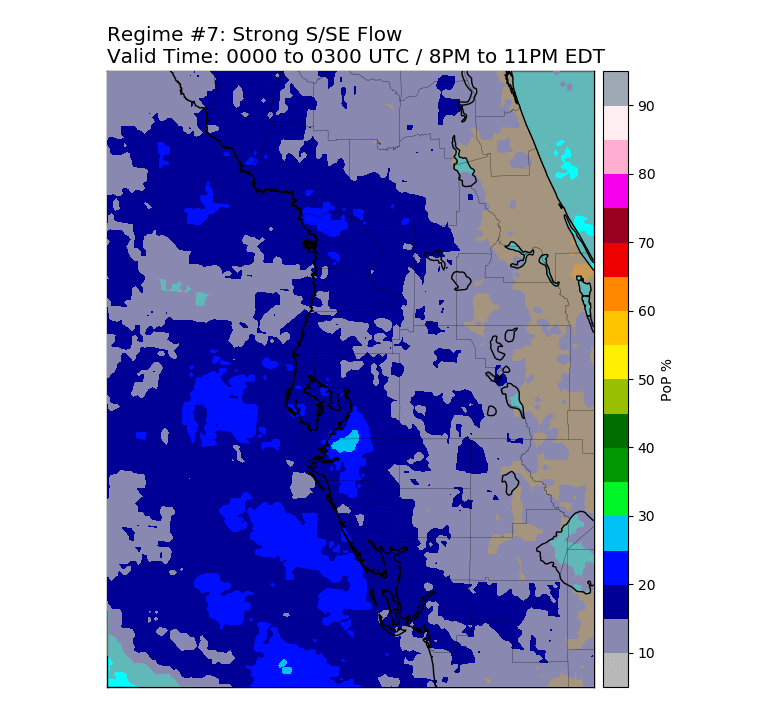
| 1000-700mb Mean Vector Flow Direction: SE/S (120° to 190°) Speed: > 10 knots 224 Total Days in Climatology |
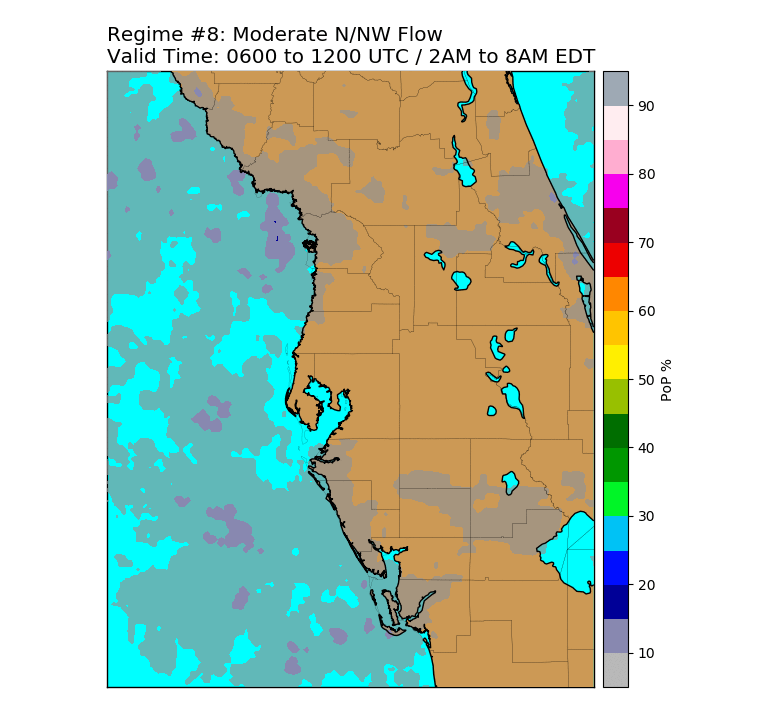
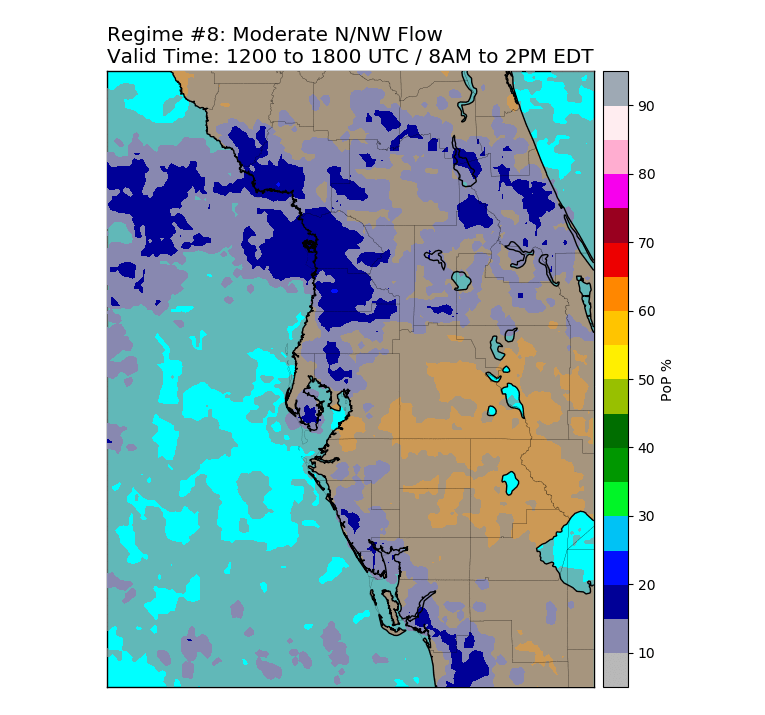
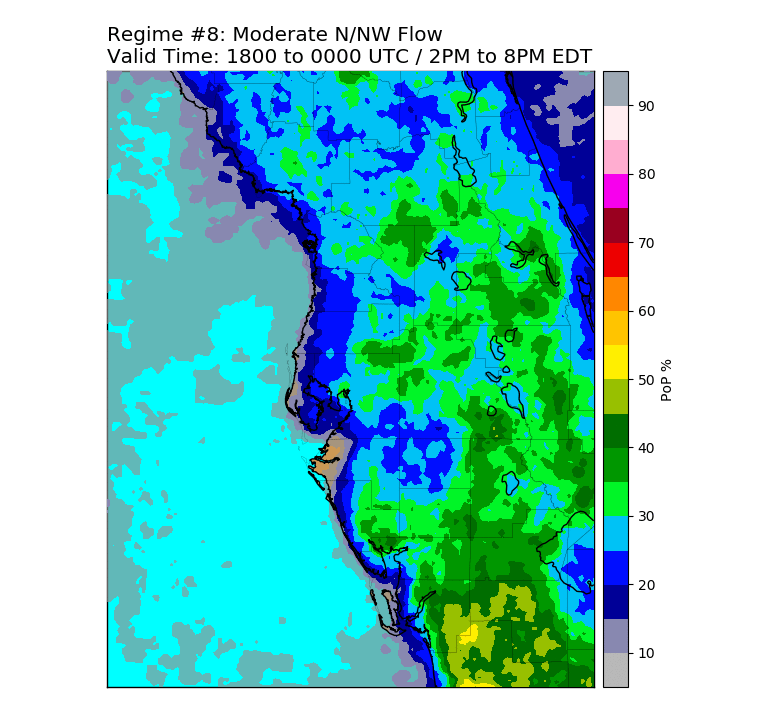
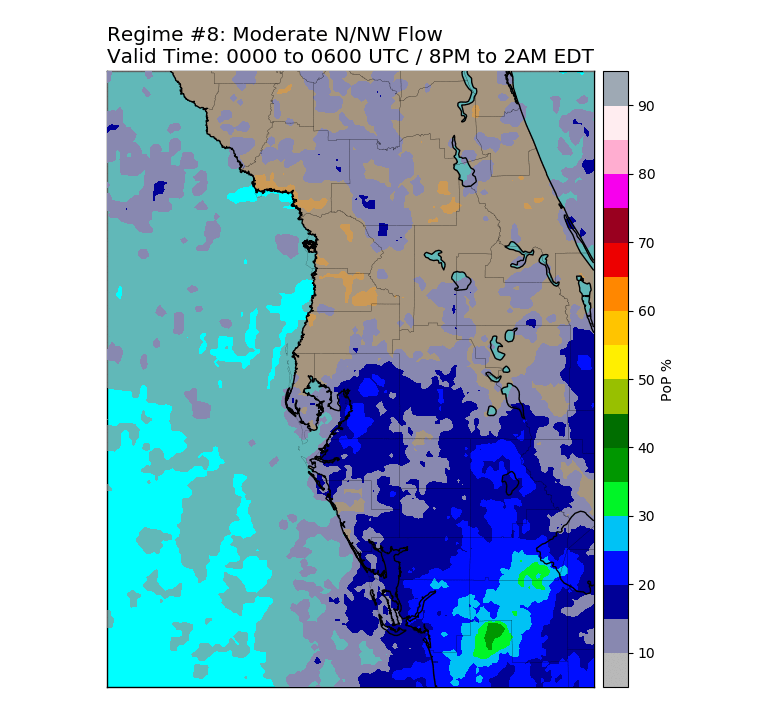
1000-700mb Mean Vector Flow Direction: NW/N (290° to 360°) Speed: 5 to 10 knots 96 Total Days in Climatology |
|
Regime 1 PoP Coverage: |
||||
24 Hour |
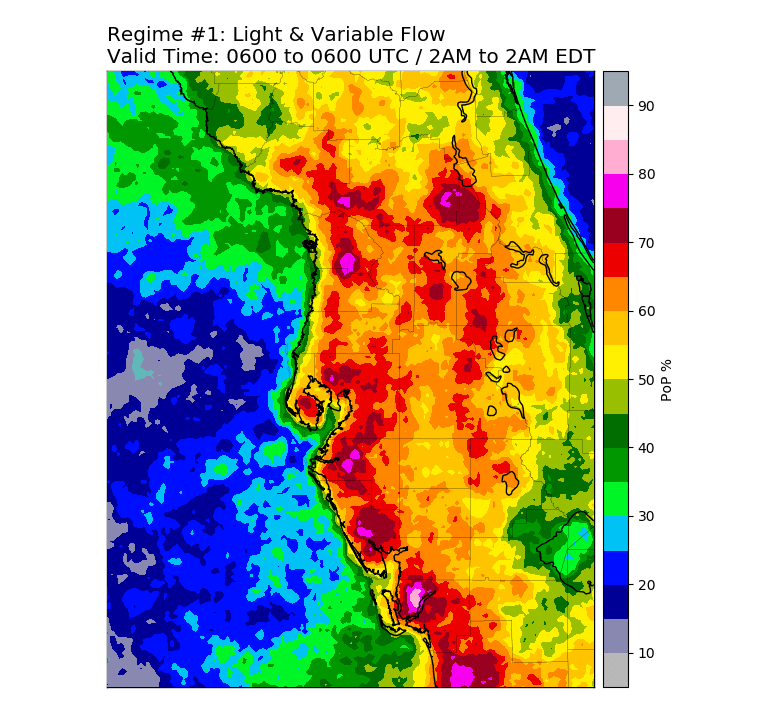
|
12 Hour |
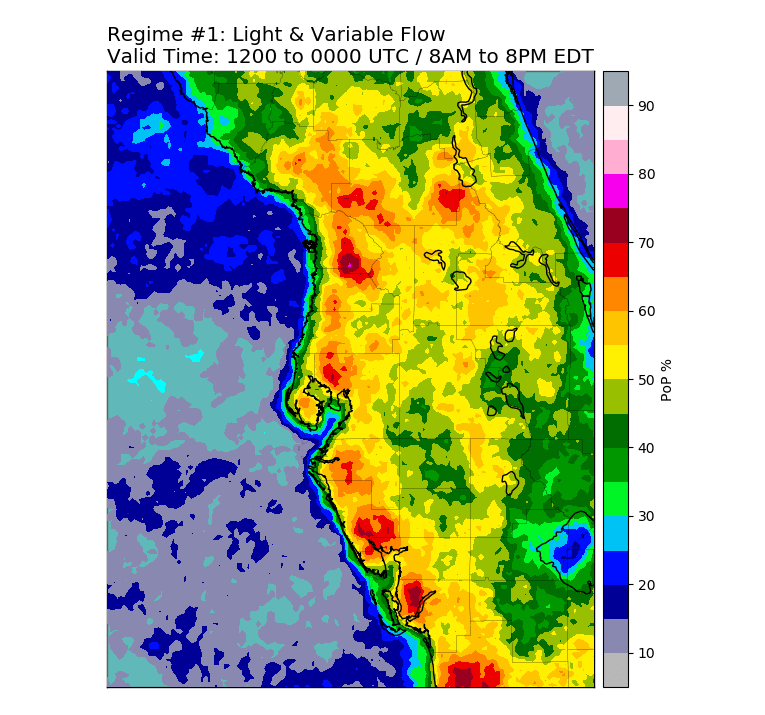
|
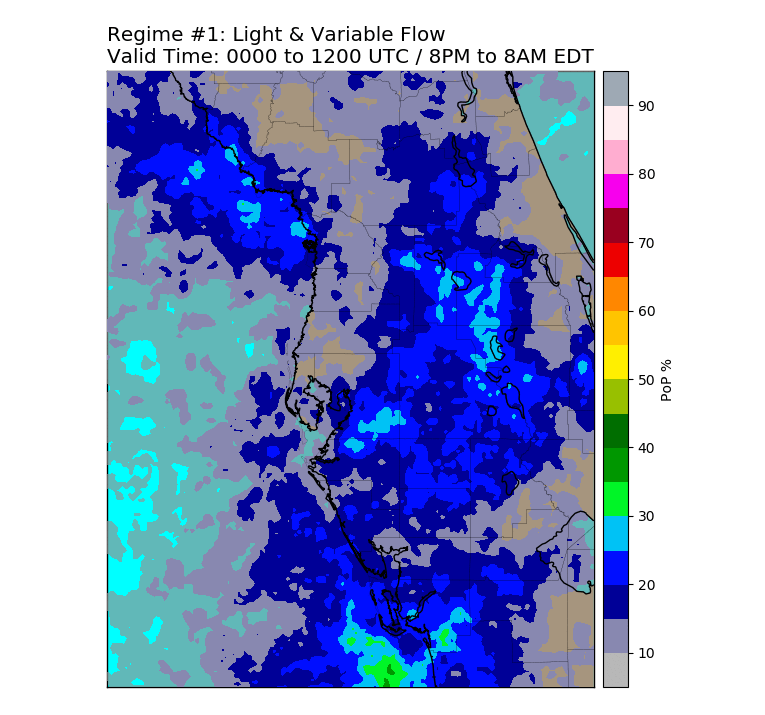
|
6 Hour |
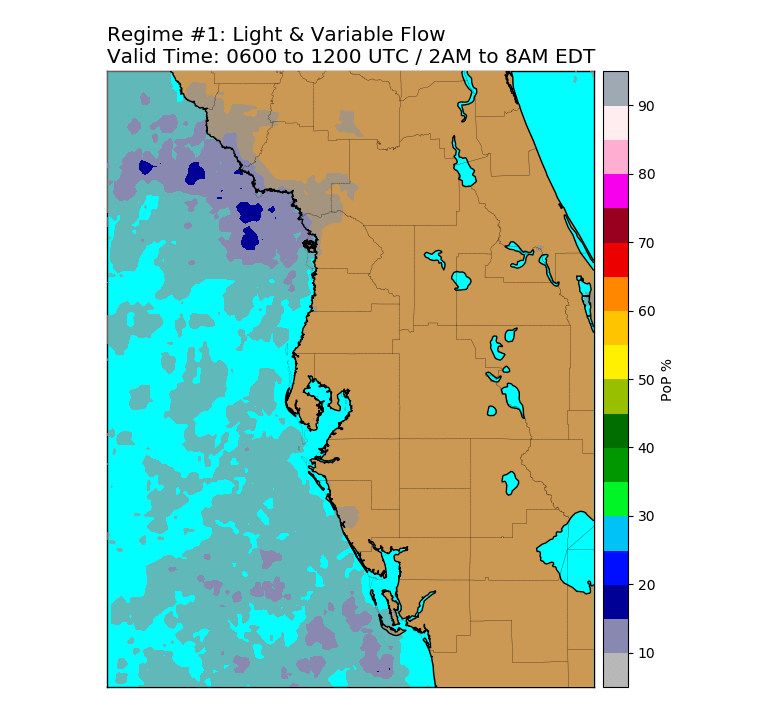
|
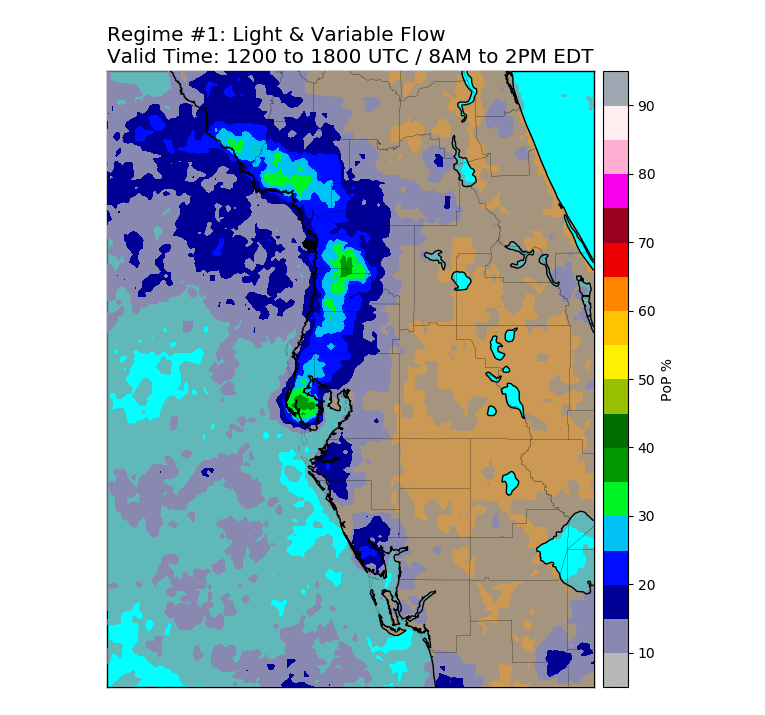
|
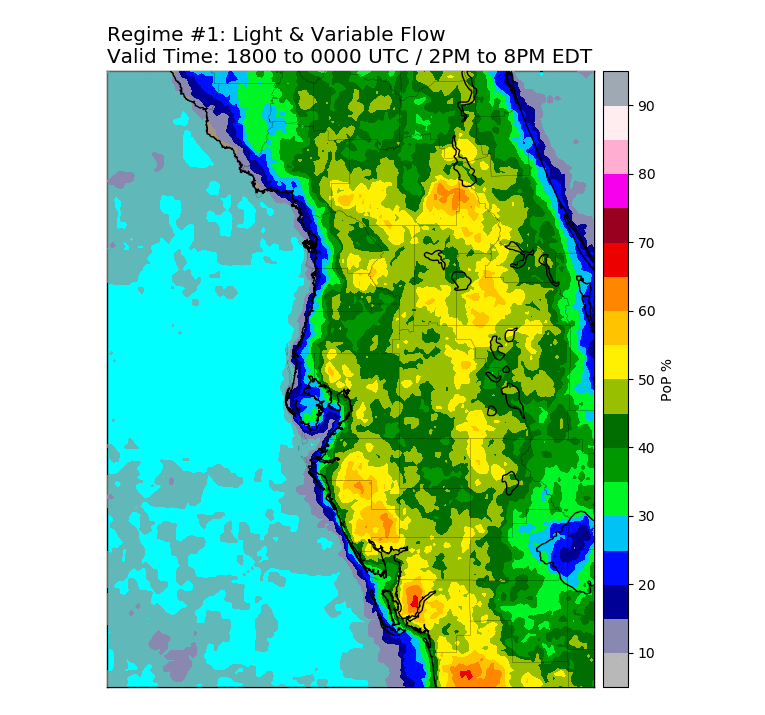
|
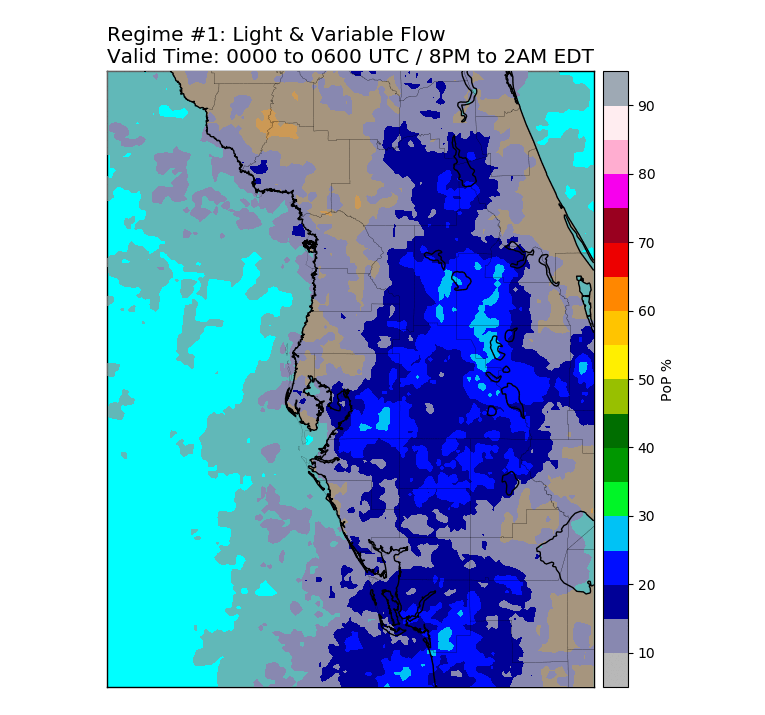
|
3 Hour |
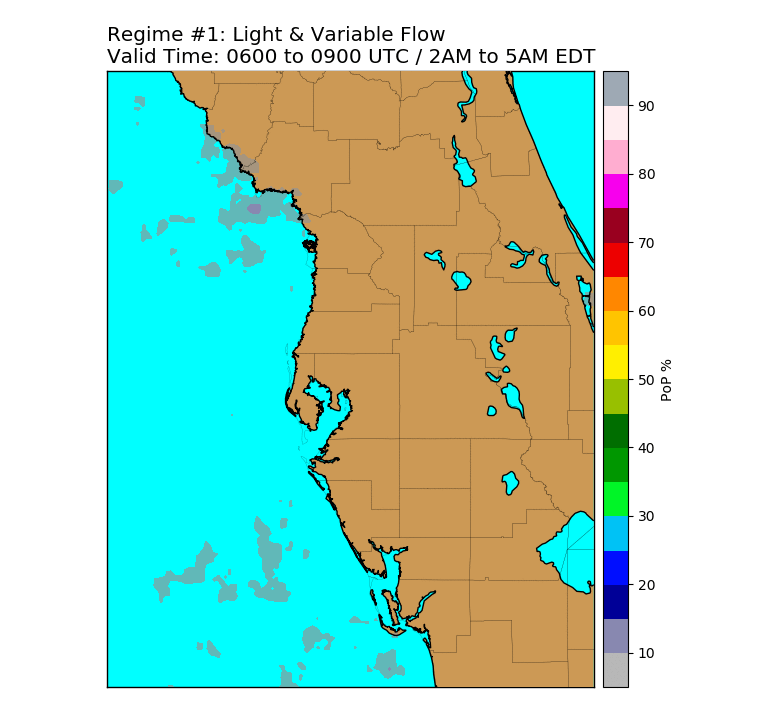
|
|
|
|
|
|
|
|
|
Regime 2 PoP Coverage: |
||||
24 Hour |
|
12 Hour |
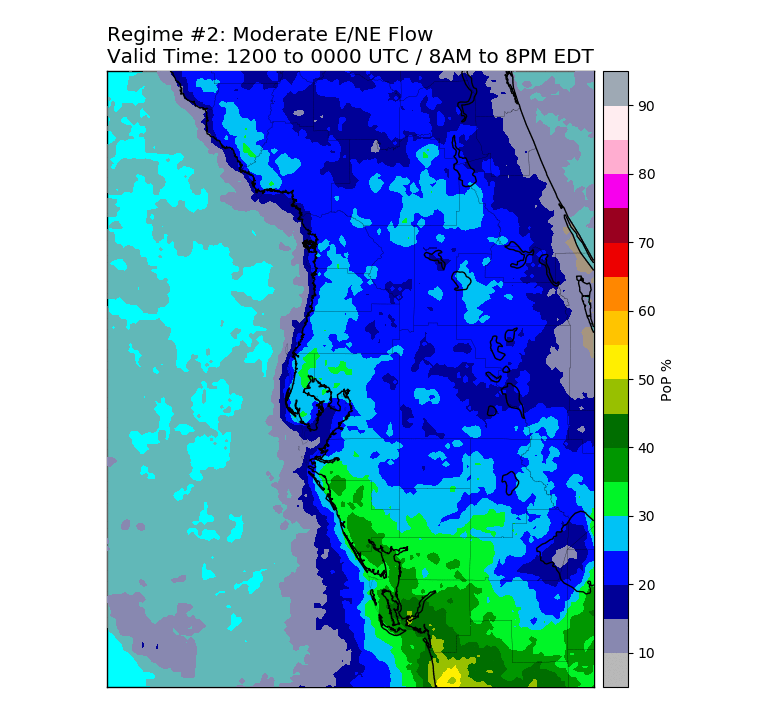
|
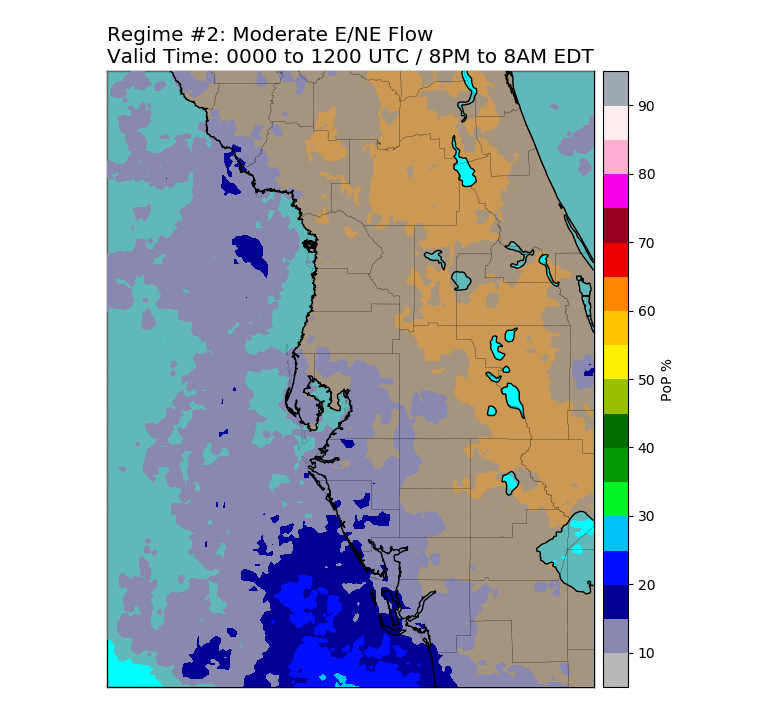
|
6 Hour |
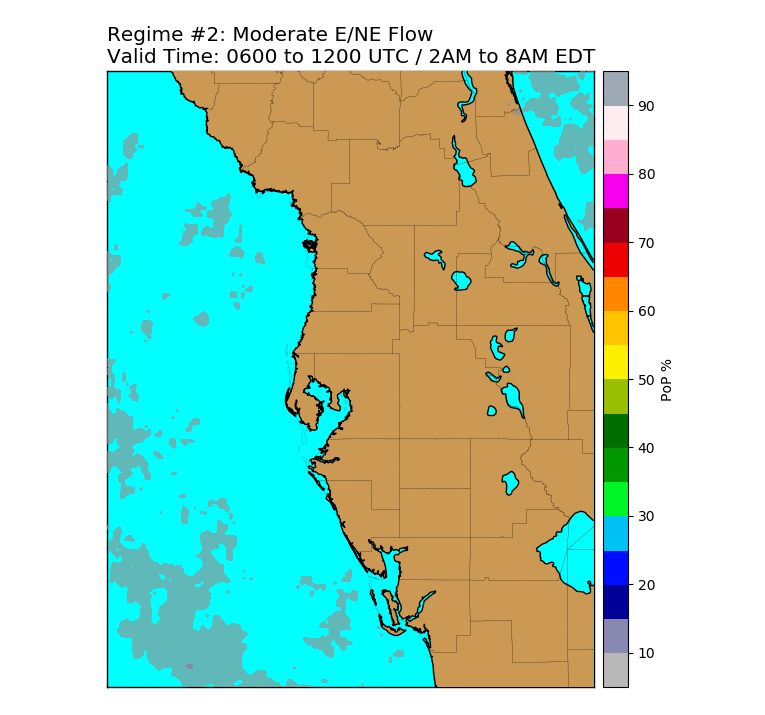
|
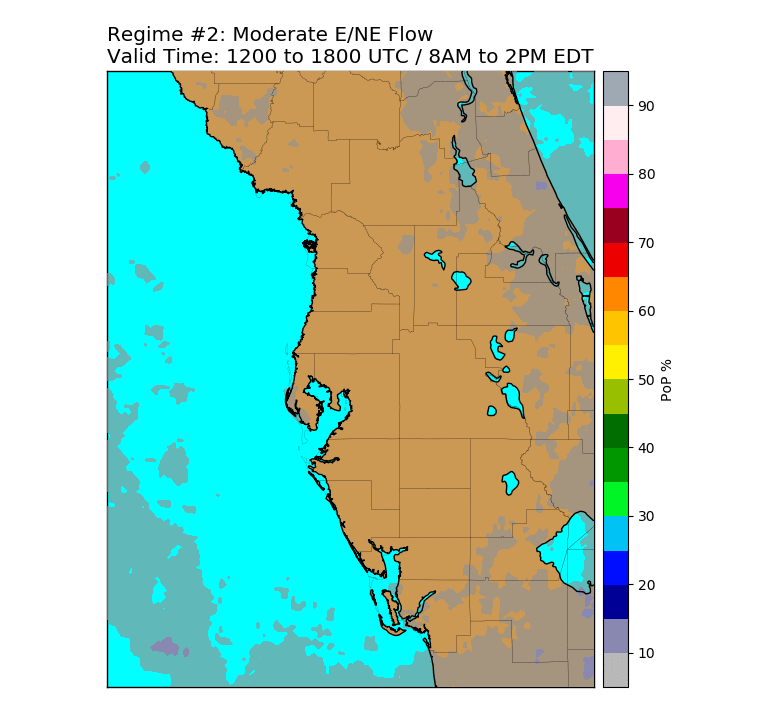
|
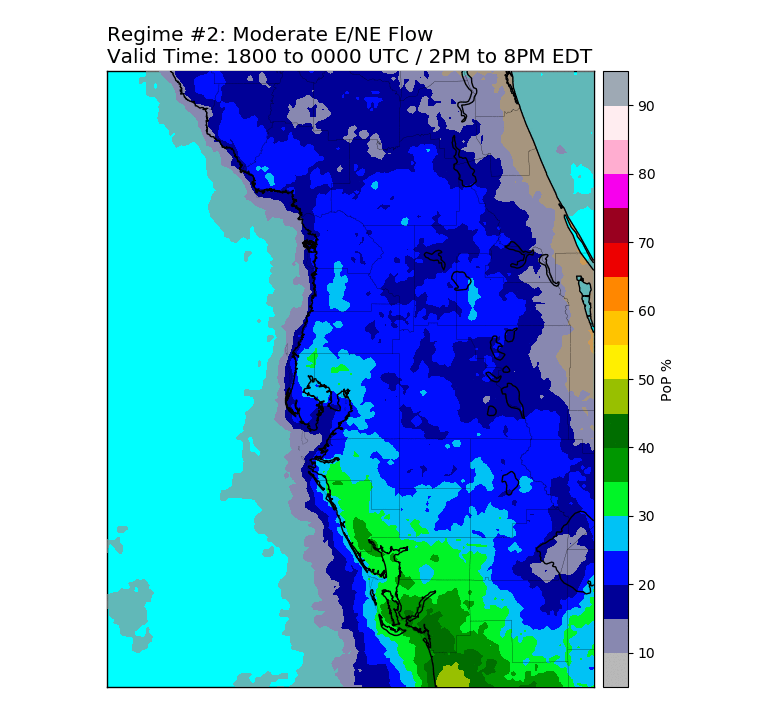
|
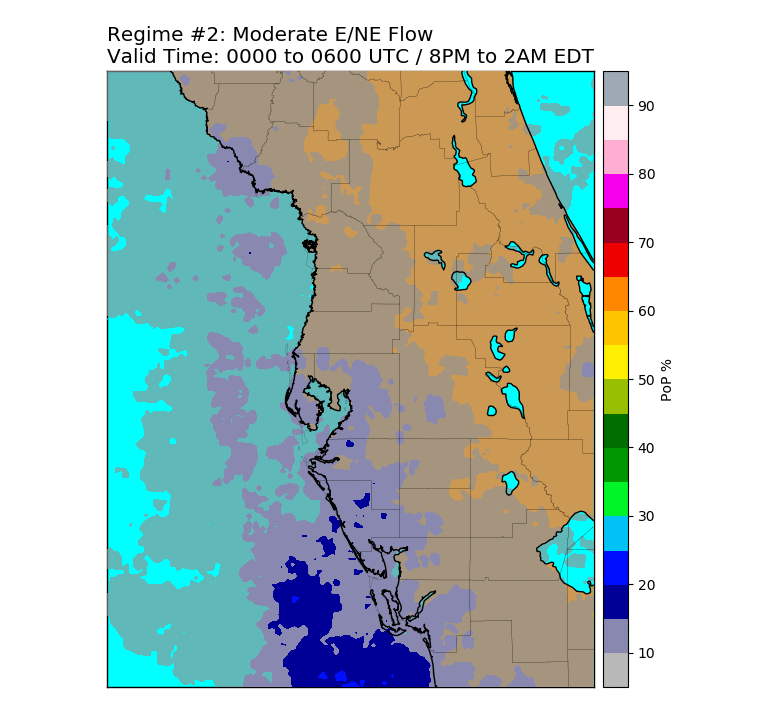
|
3 Hour |
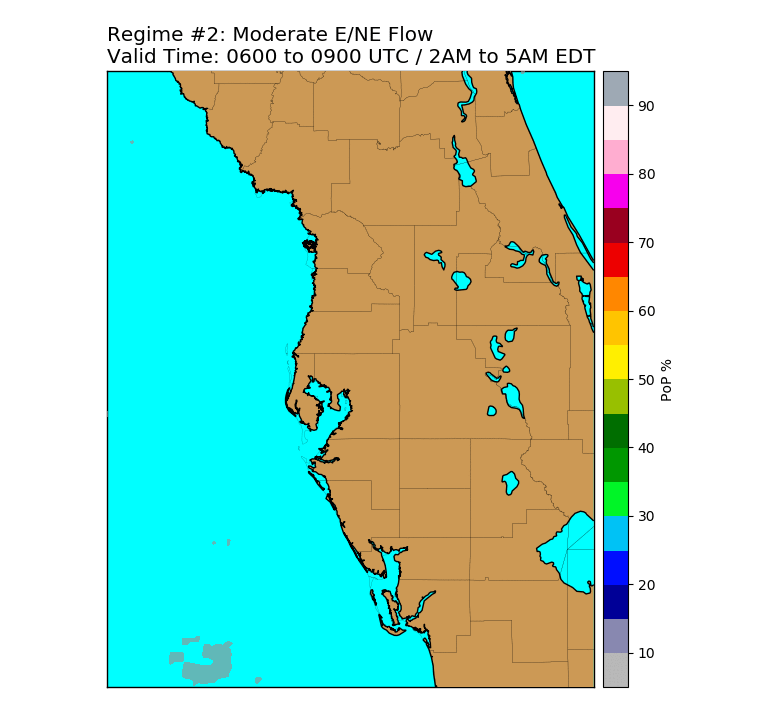
|
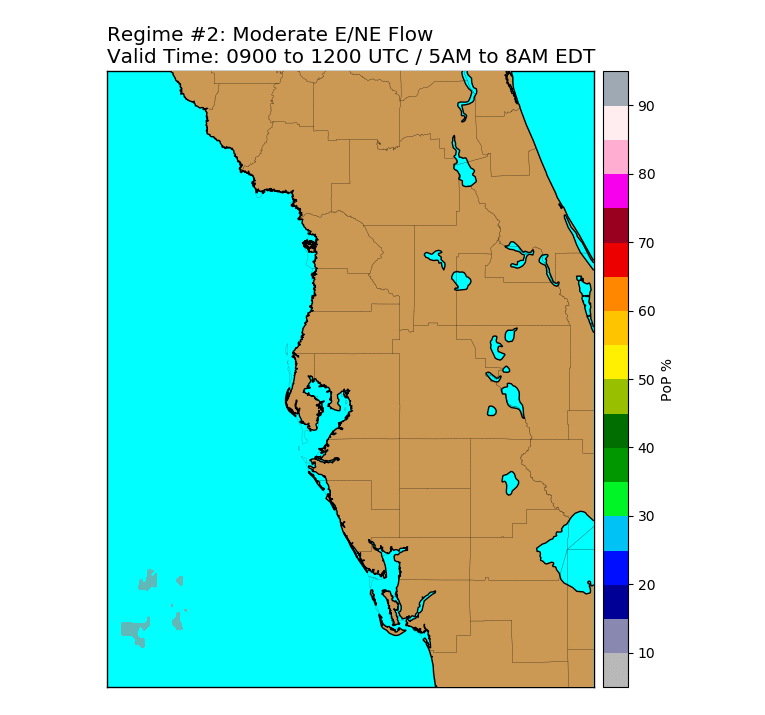
|
|
|
|
|
|
|
|
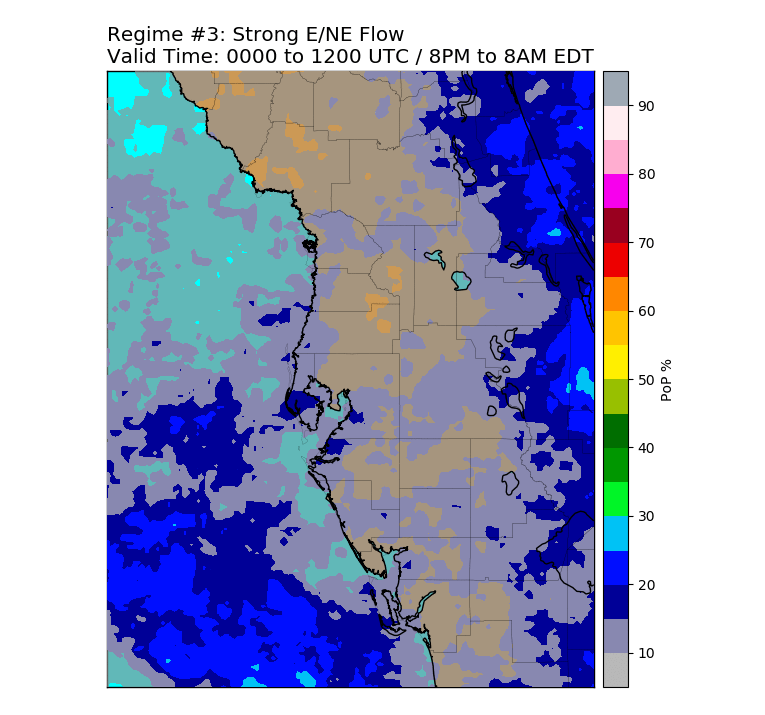
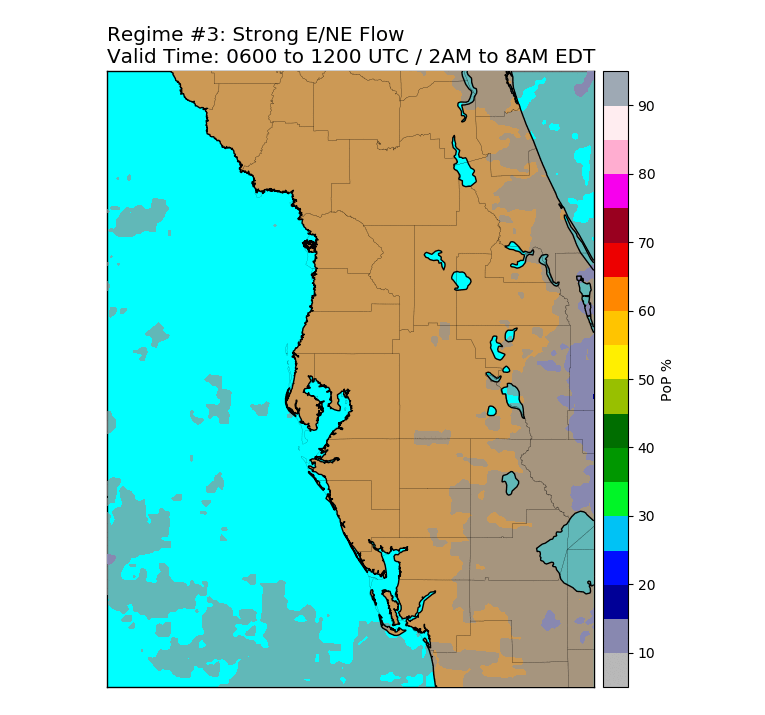
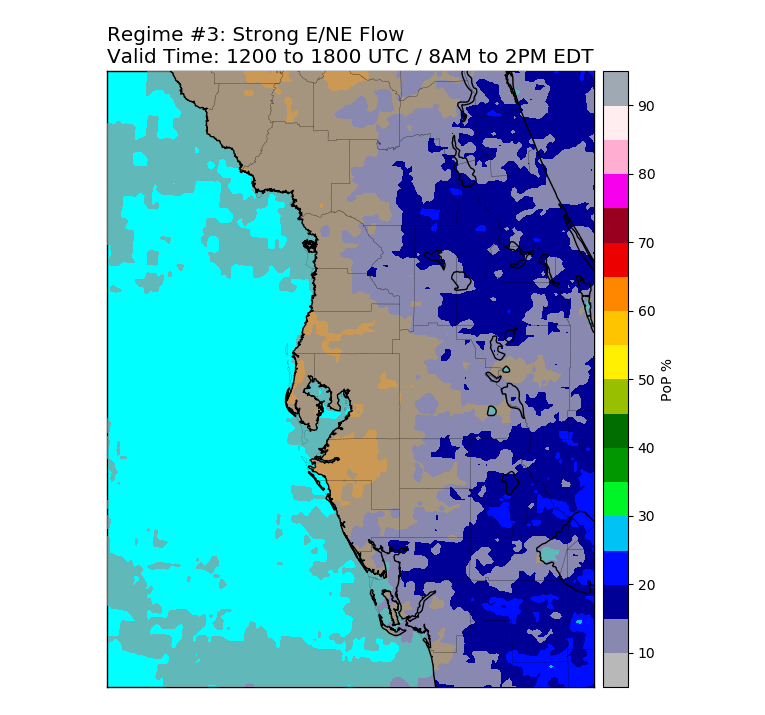
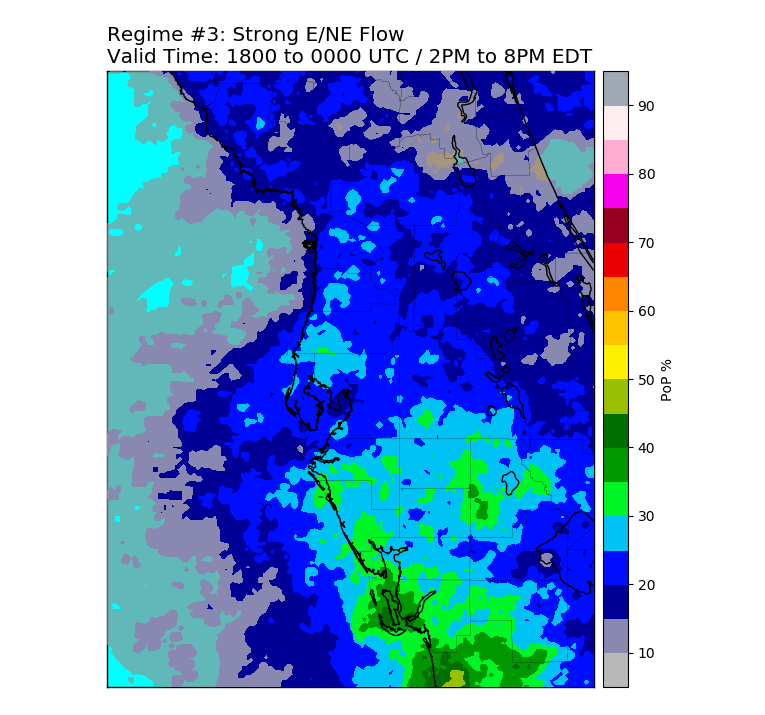
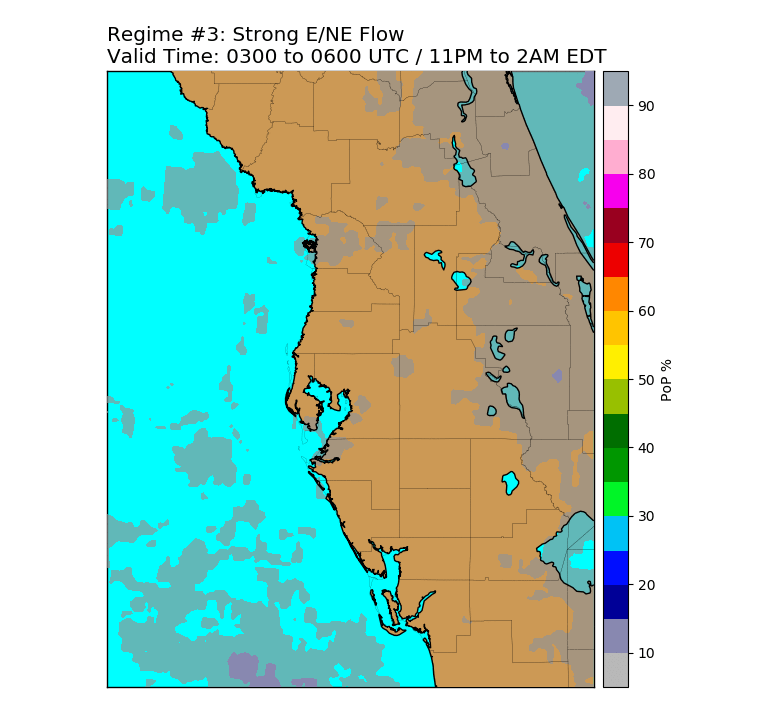
Regime 3 PoP Coverage: |
||||
24 Hour |
|
12 Hour |
|
|
6 Hour |
|
|
|
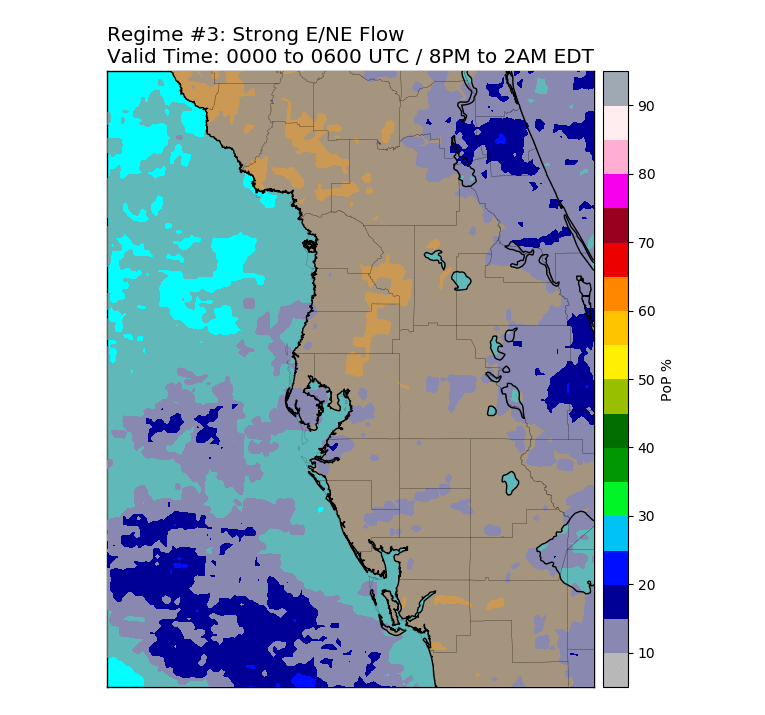
|
3 Hour |
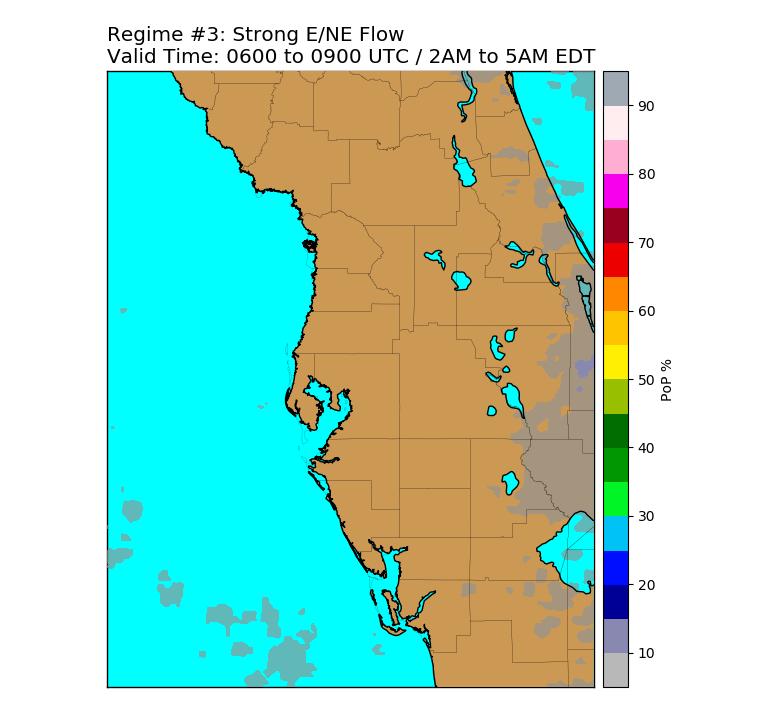
|
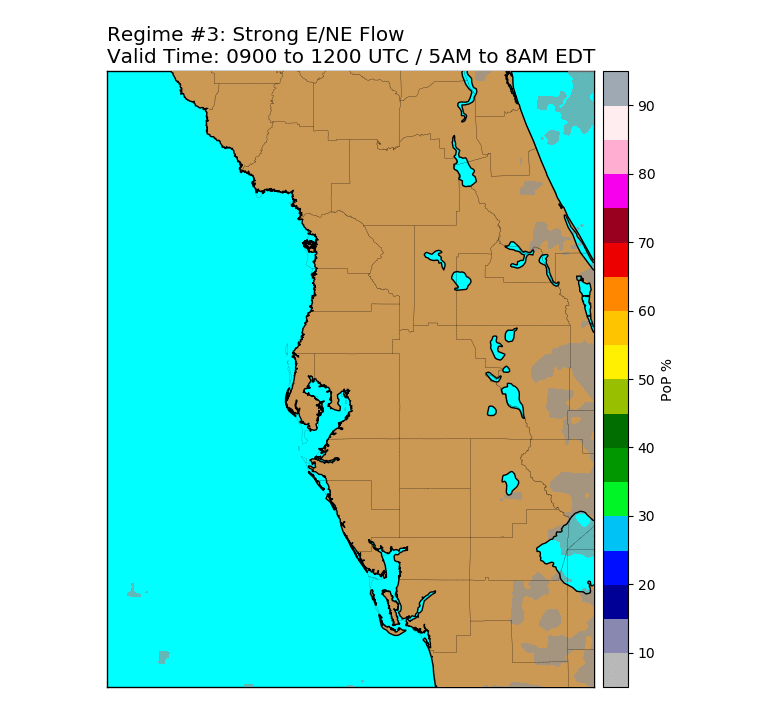
|
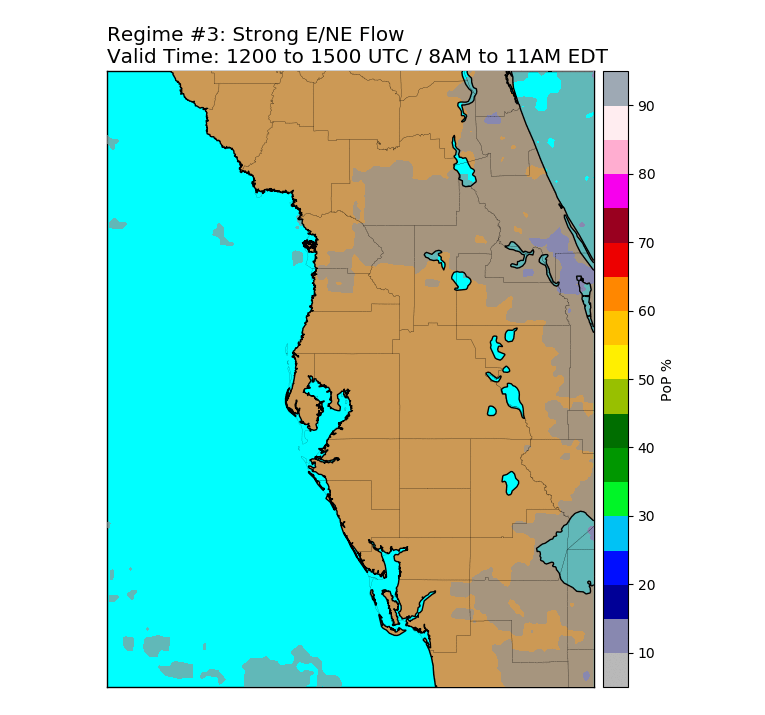
|
|
|
|
|
|
|
Regime 4 PoP Coverage: |
||||
24 Hour |
|
12 Hour |
|
|
6 Hour |
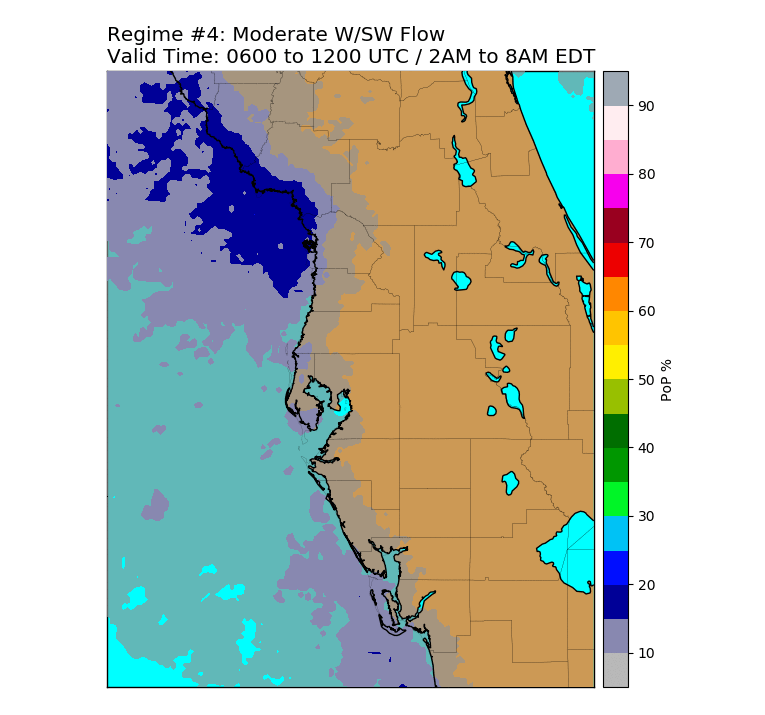
|
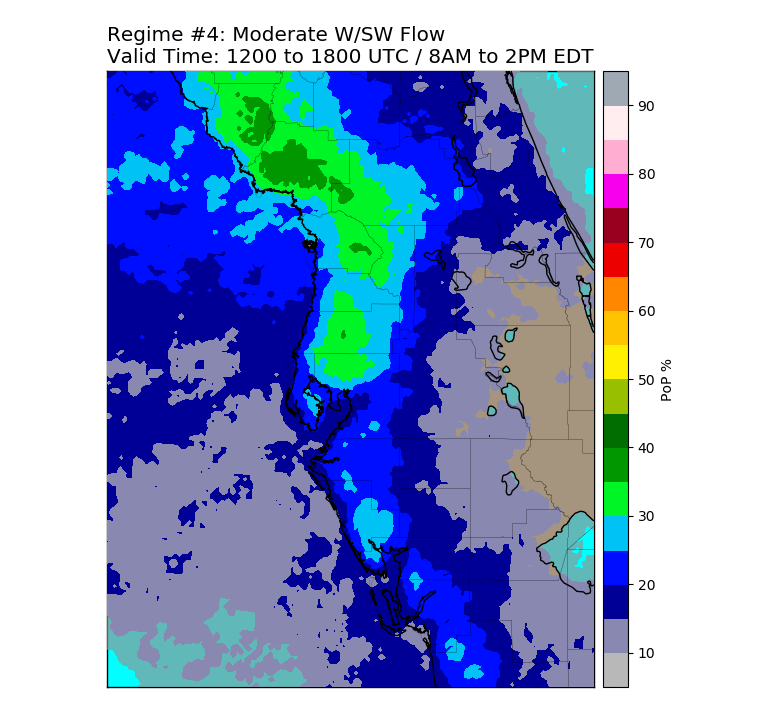
|
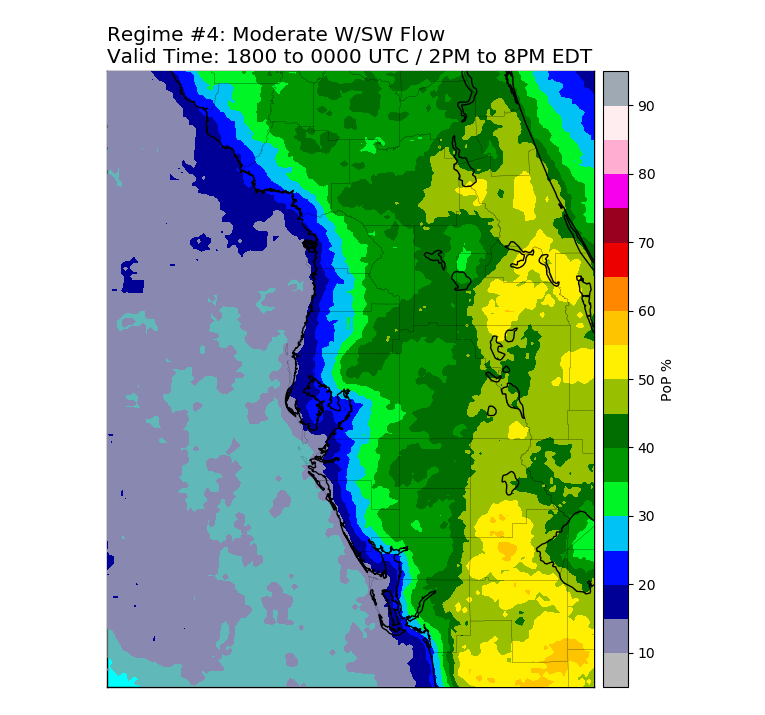
|
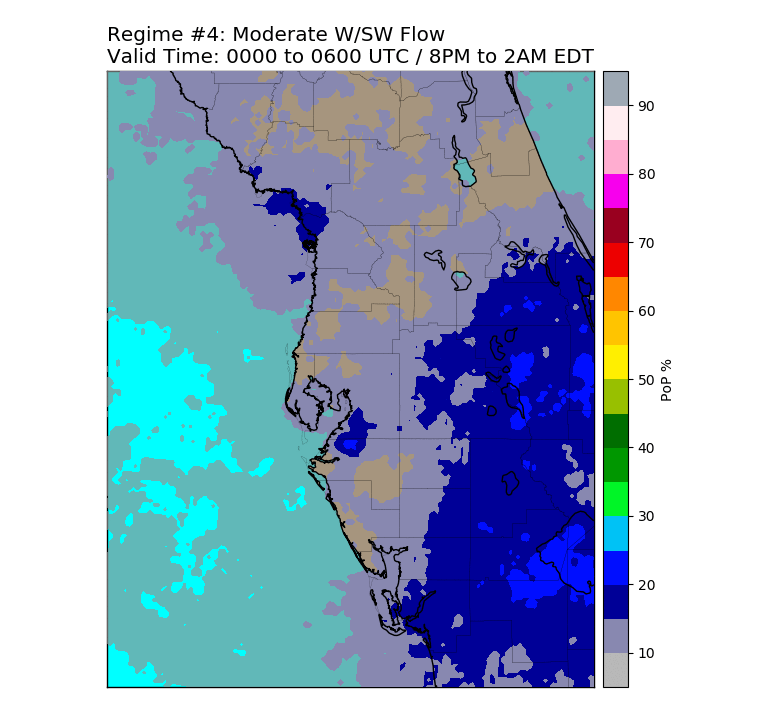
|
3 Hour |
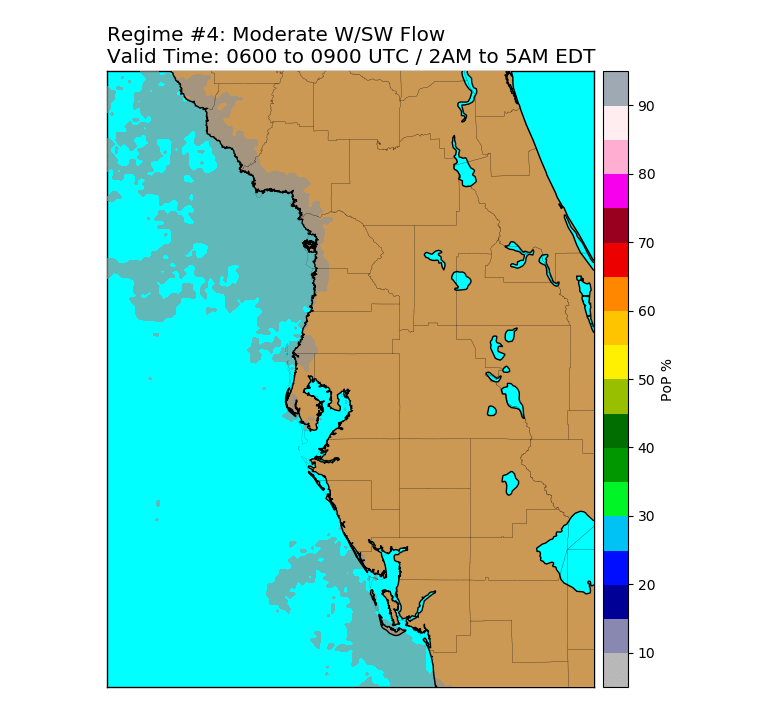
|
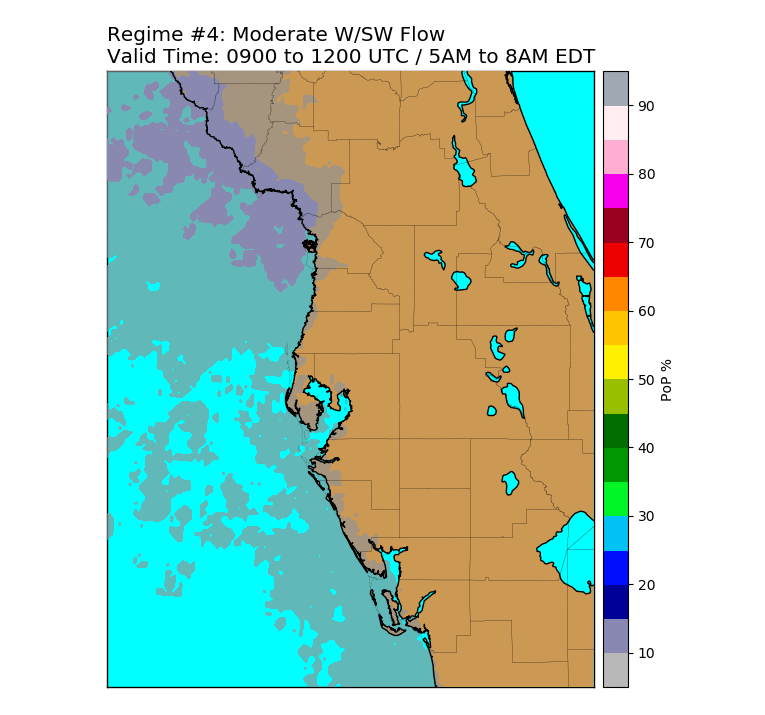
|
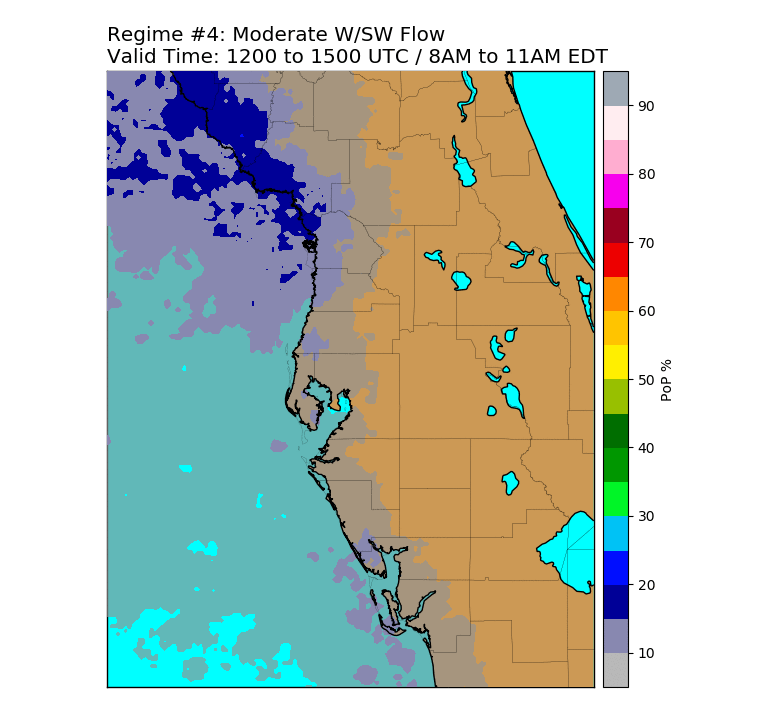
|
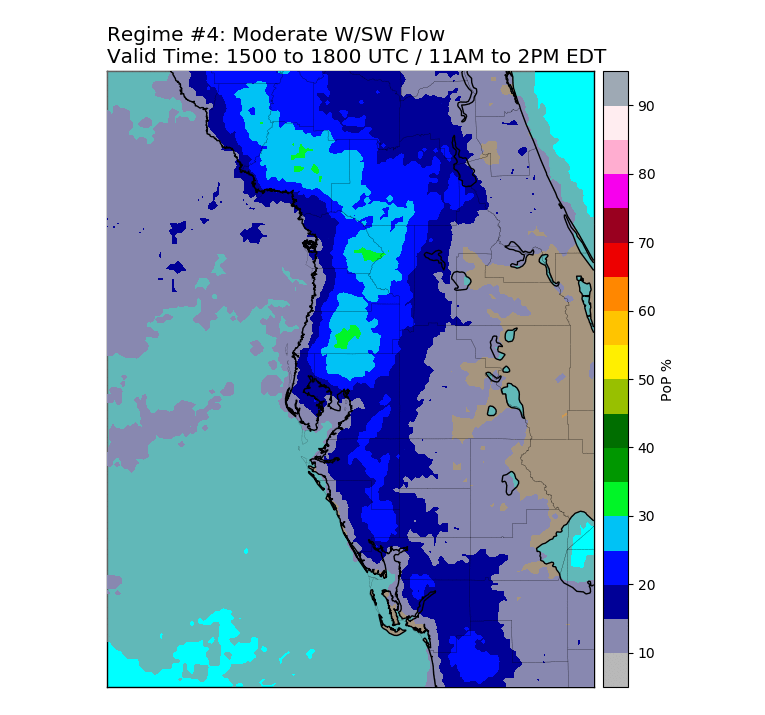
|
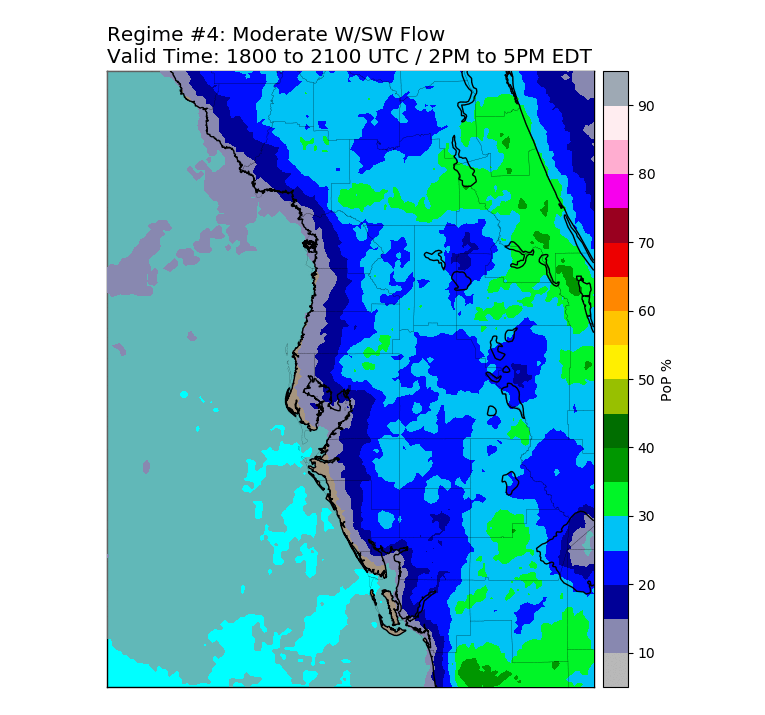
|
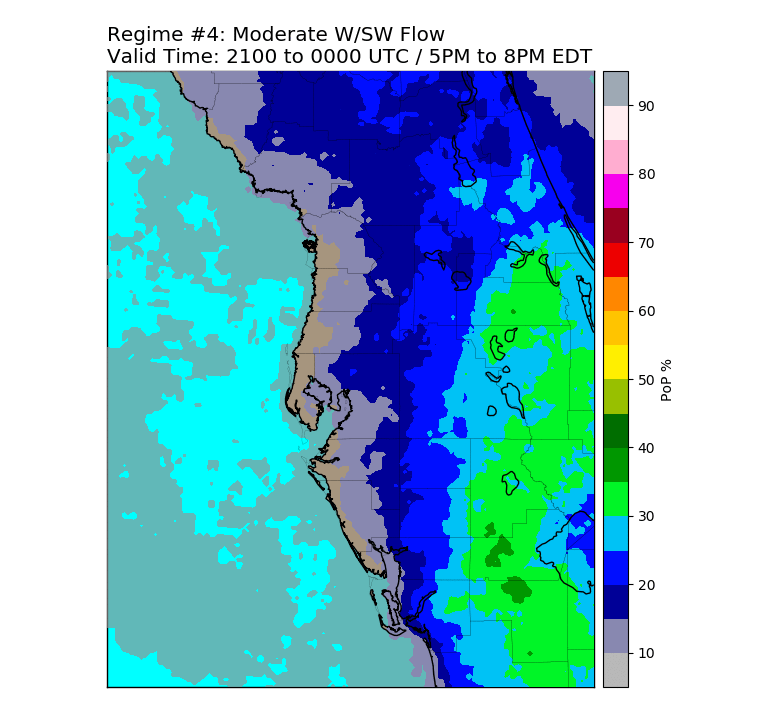
|
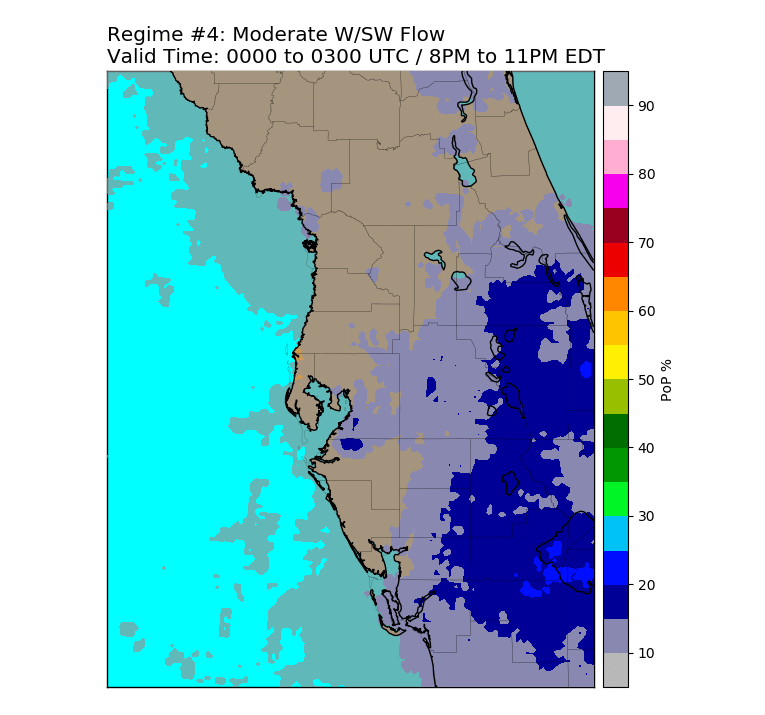
|
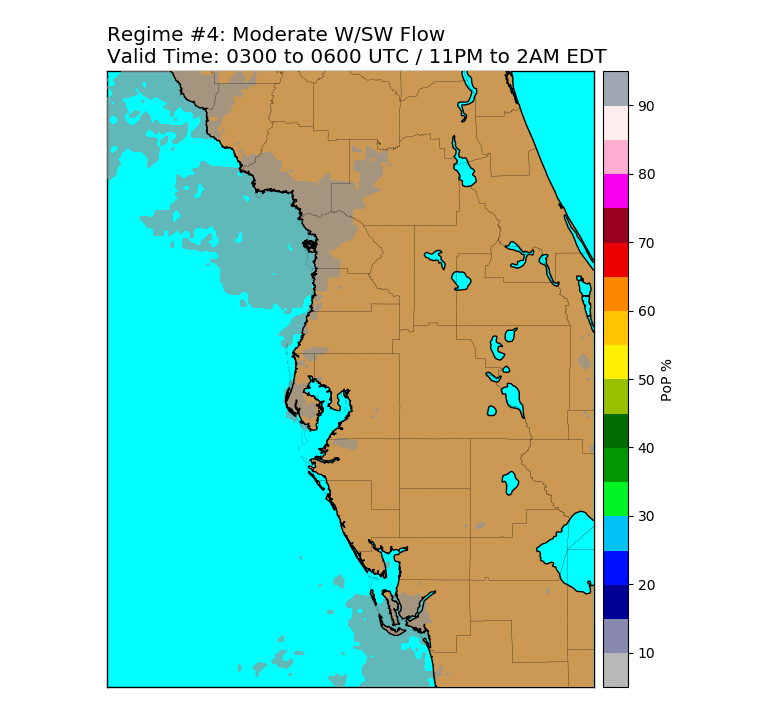
|
|
Regime 5 PoP Coverage: |
||||
24 Hour |
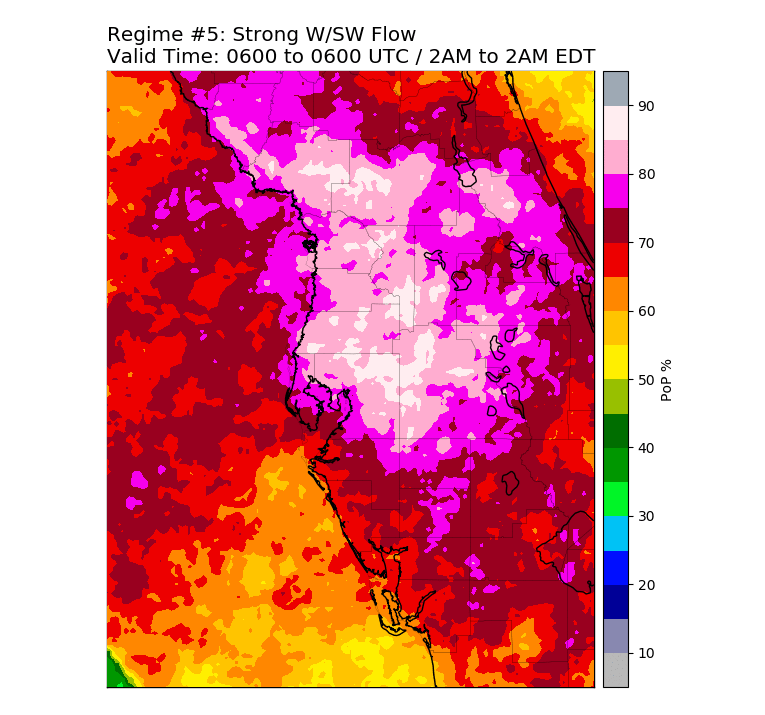
|
12 Hour |
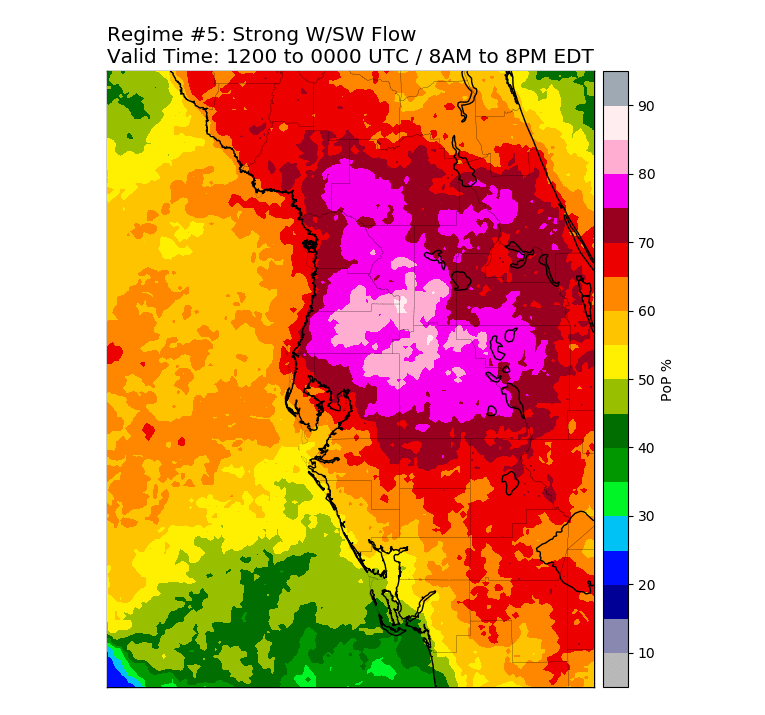
|
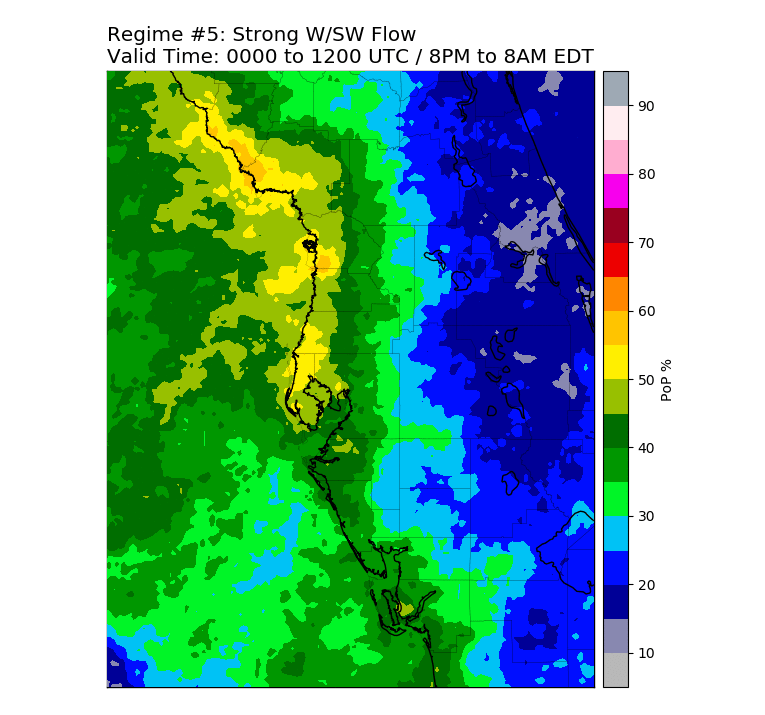
|
6 Hour |
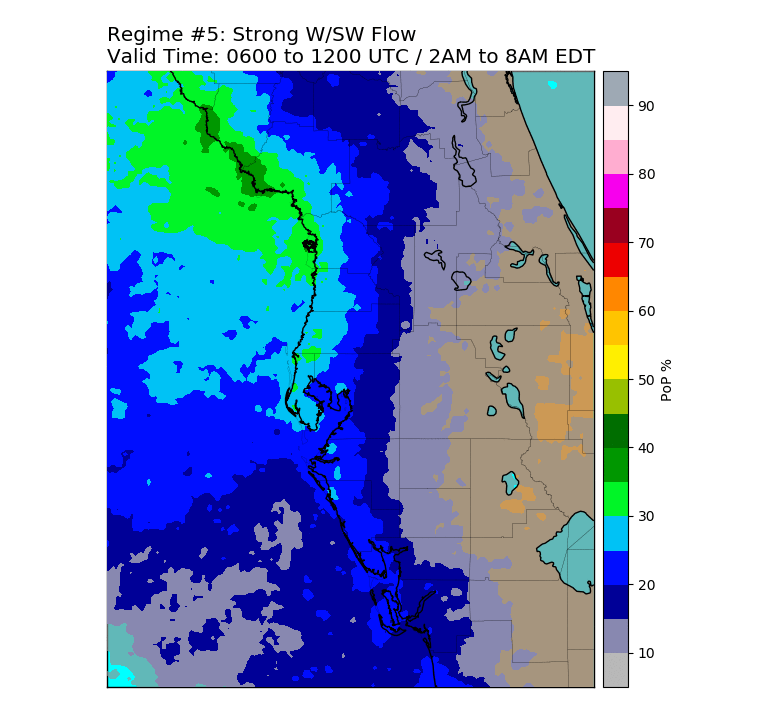
|
|
|
|
3 Hour |
|
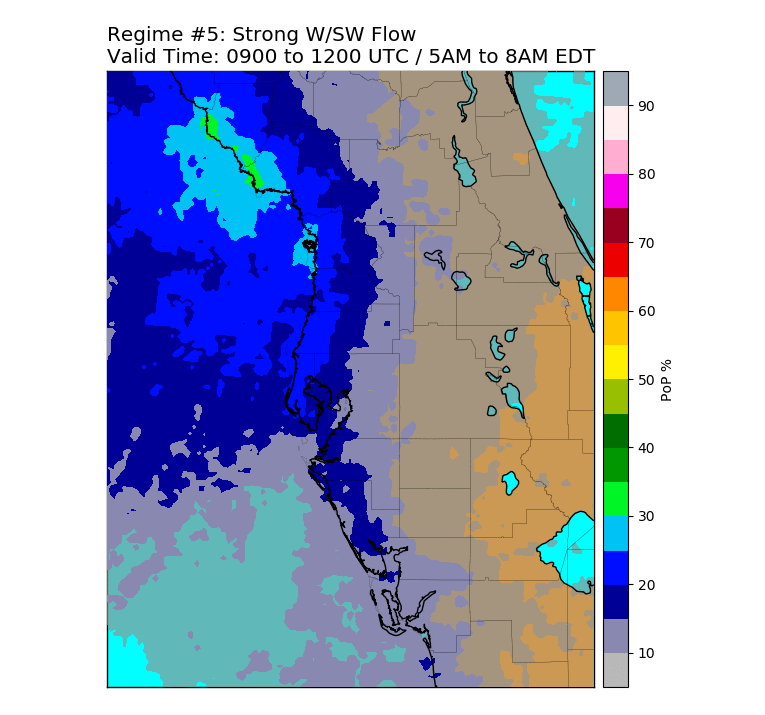
|
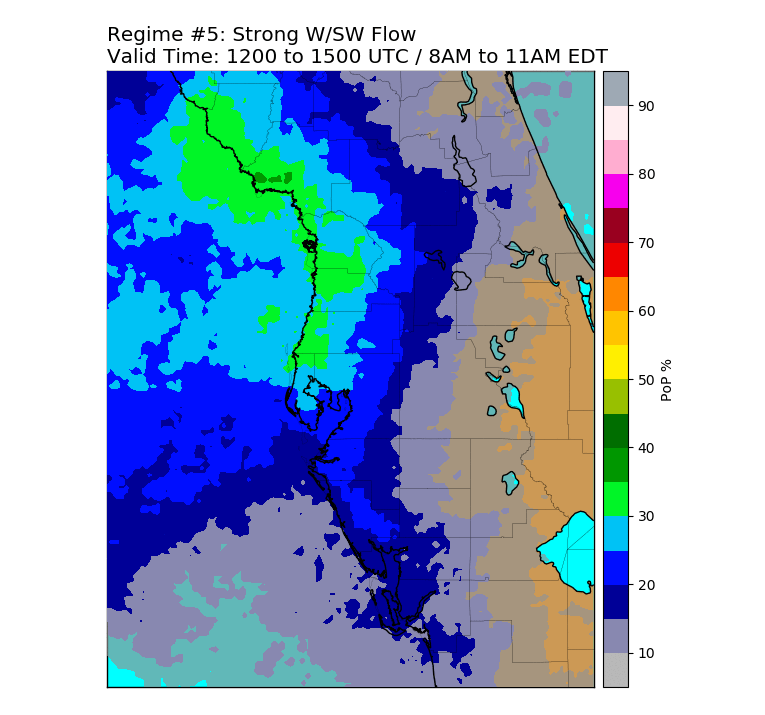
|
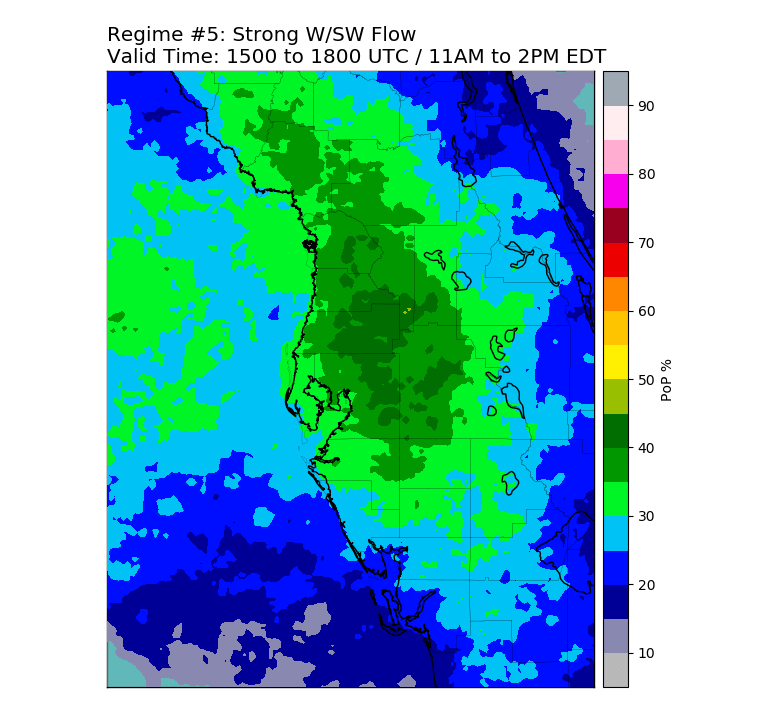
|
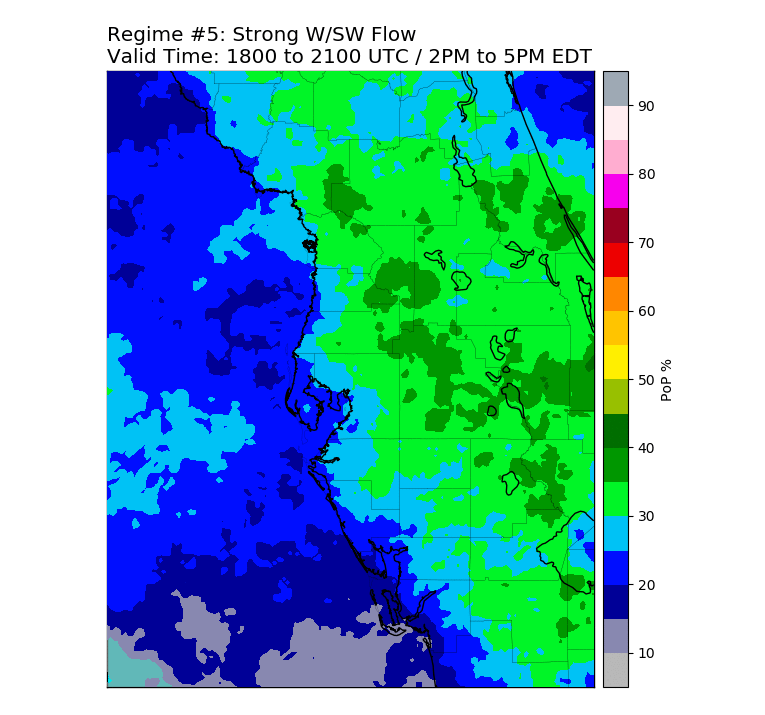
|
|
|
|
|
Regime 6 PoP Coverage: |
||||
24 Hour |
|
12 Hour |
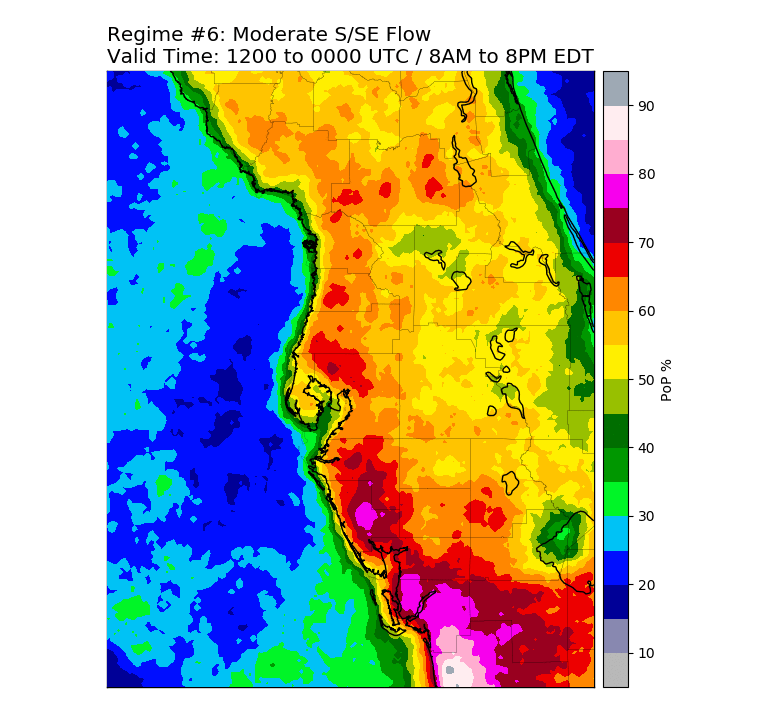
|
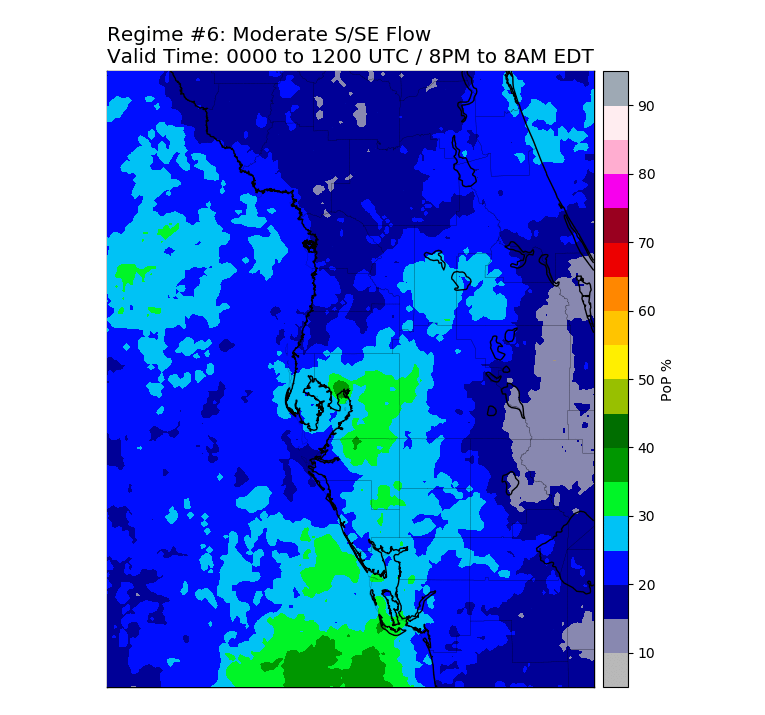
|
6 Hour |
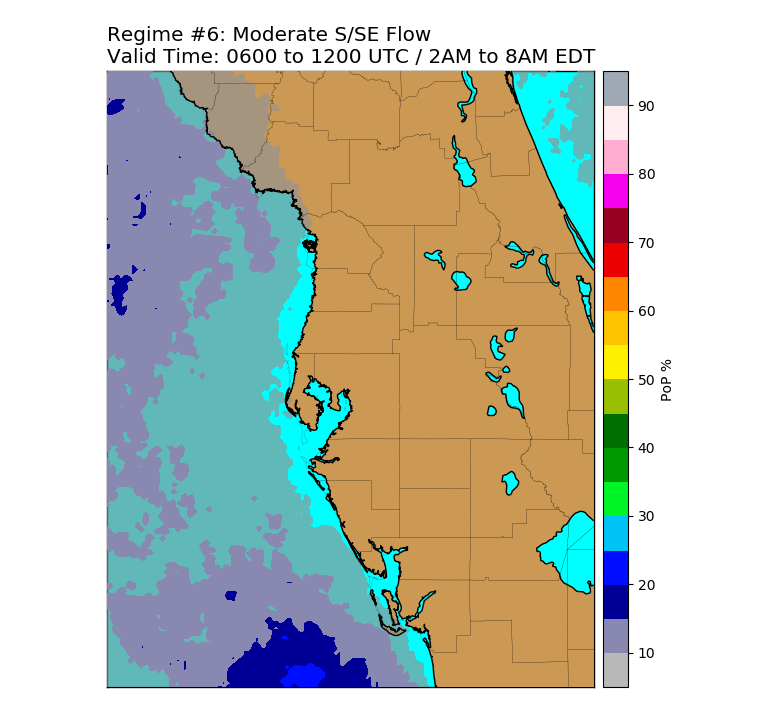
|
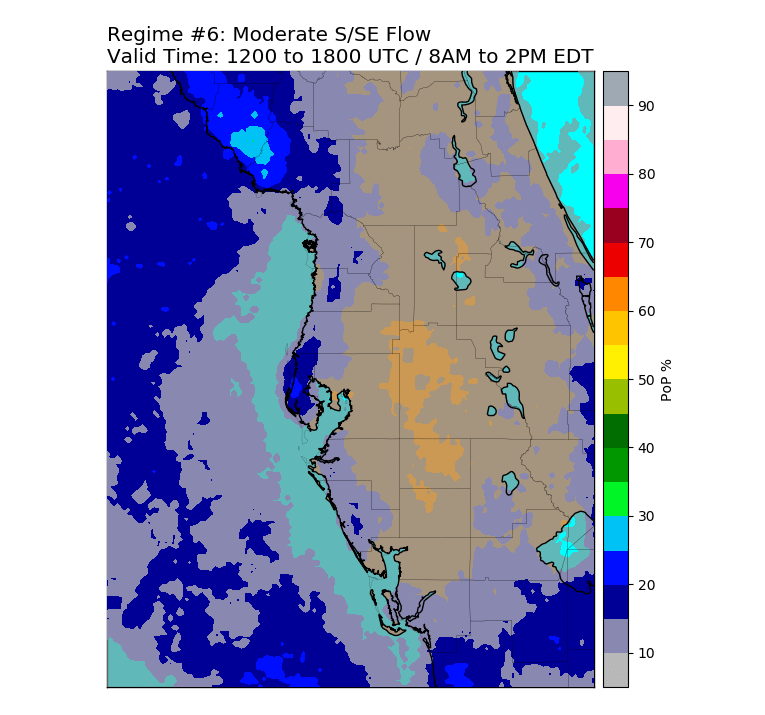
|
|
|
3 Hour |
|
|
|
|
|
|
|
|
|
Regime 7 PoP Coverage: |
||||
24 Hour |
|
12 Hour |
|
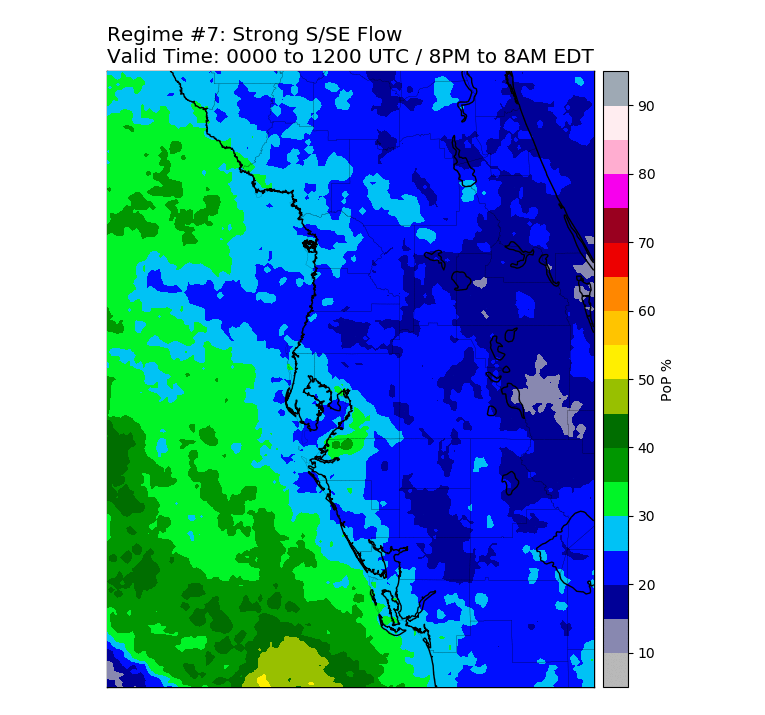
|
6 Hour |
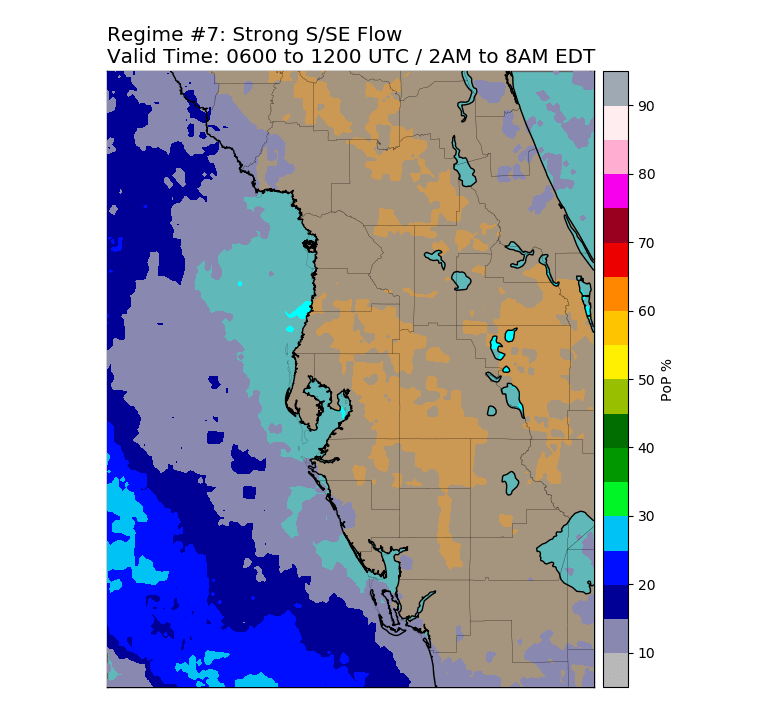
|
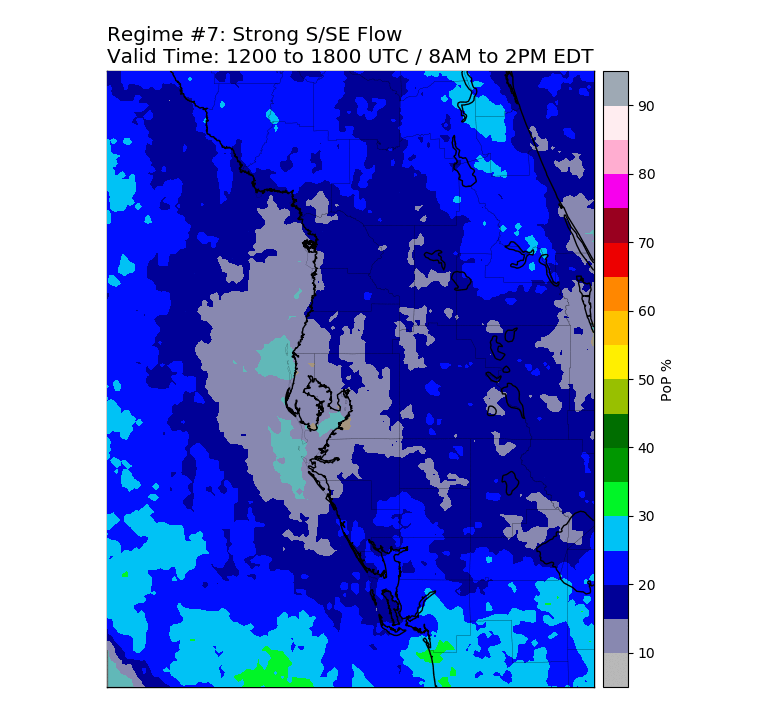
|
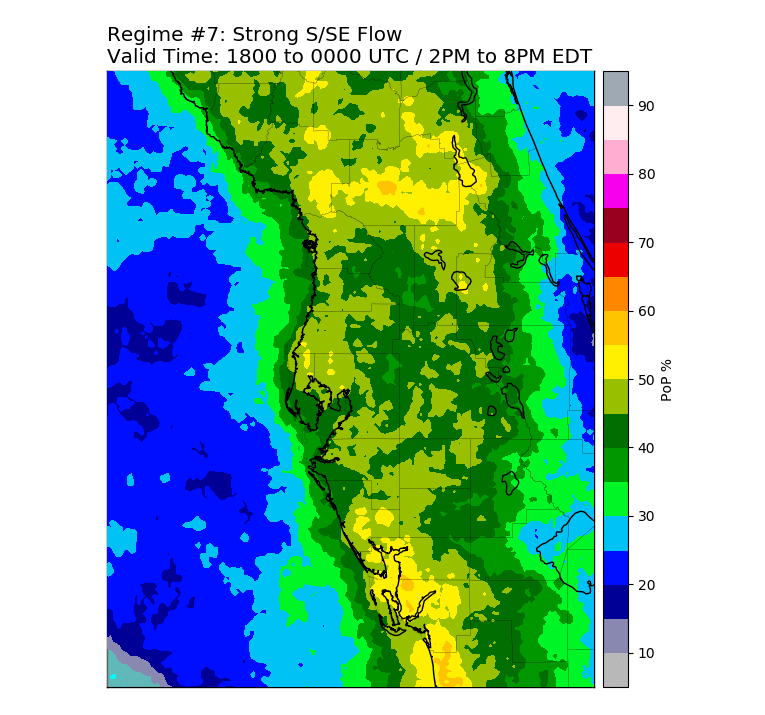
|
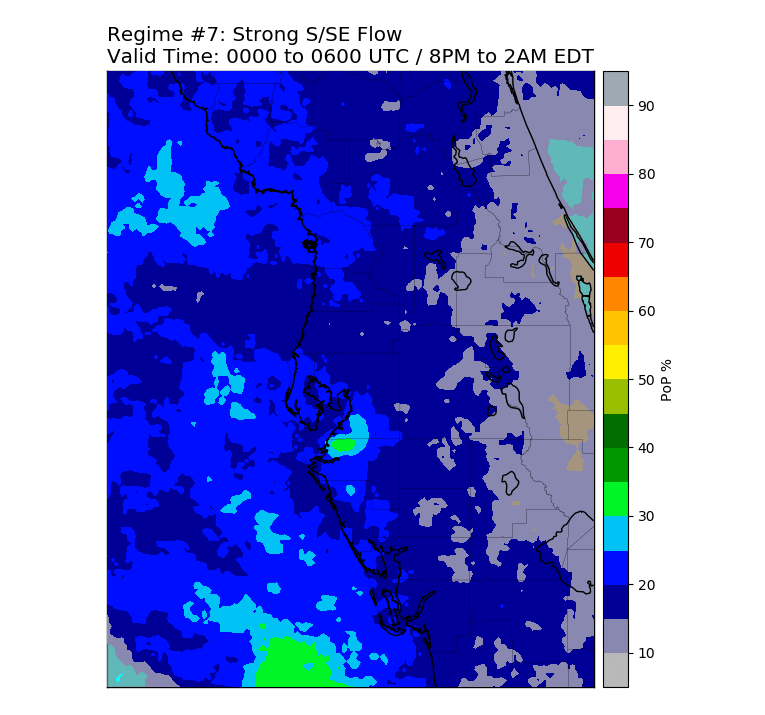
|
3 Hour |
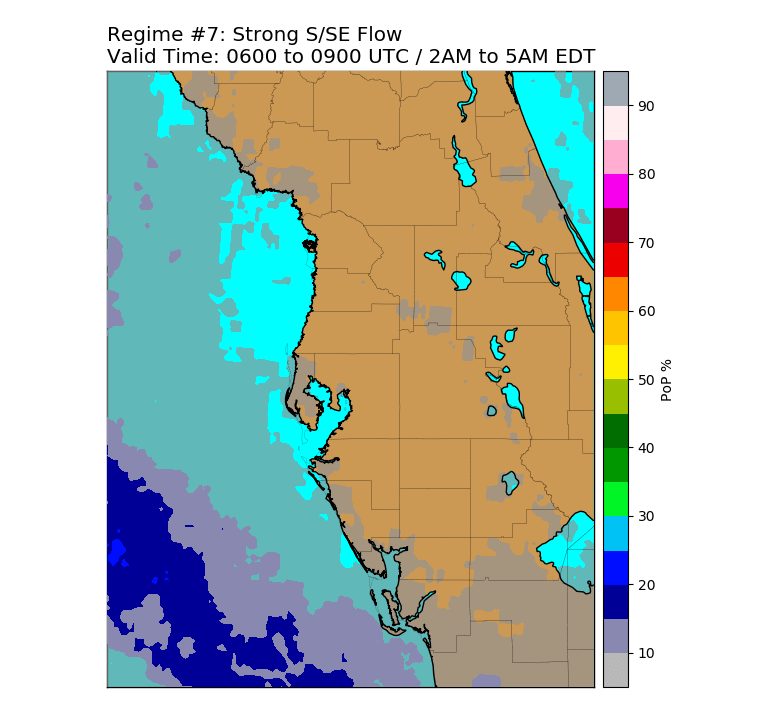
|
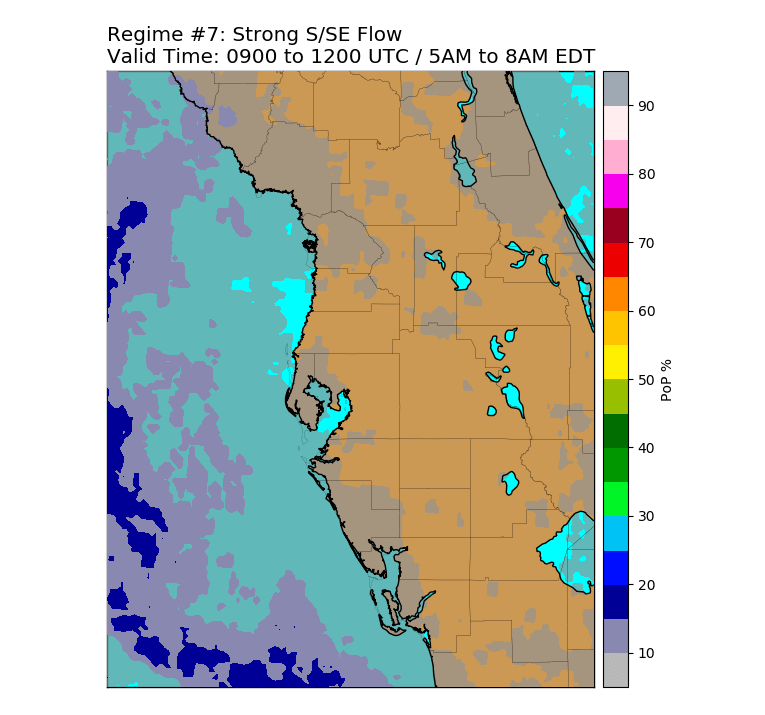
|
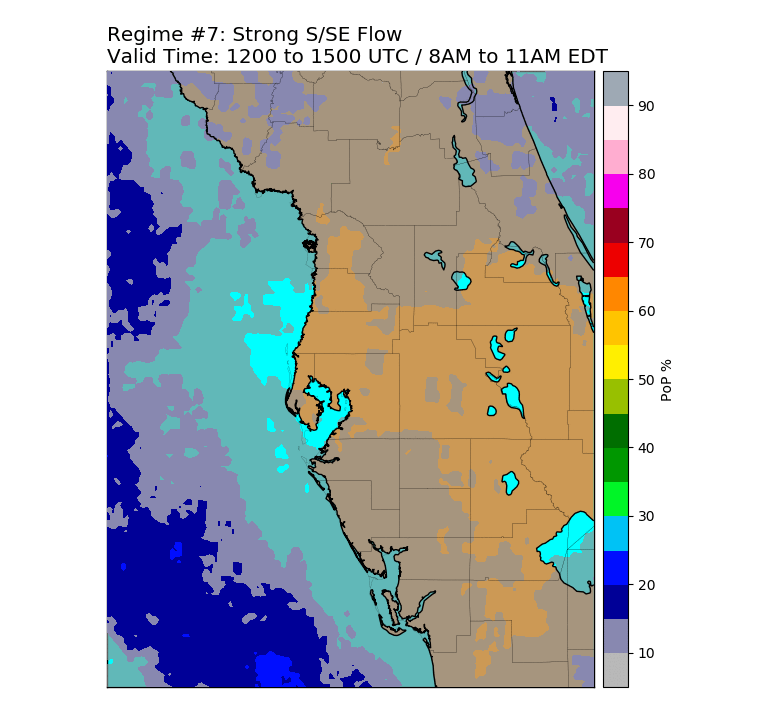
|
|
|
|
|
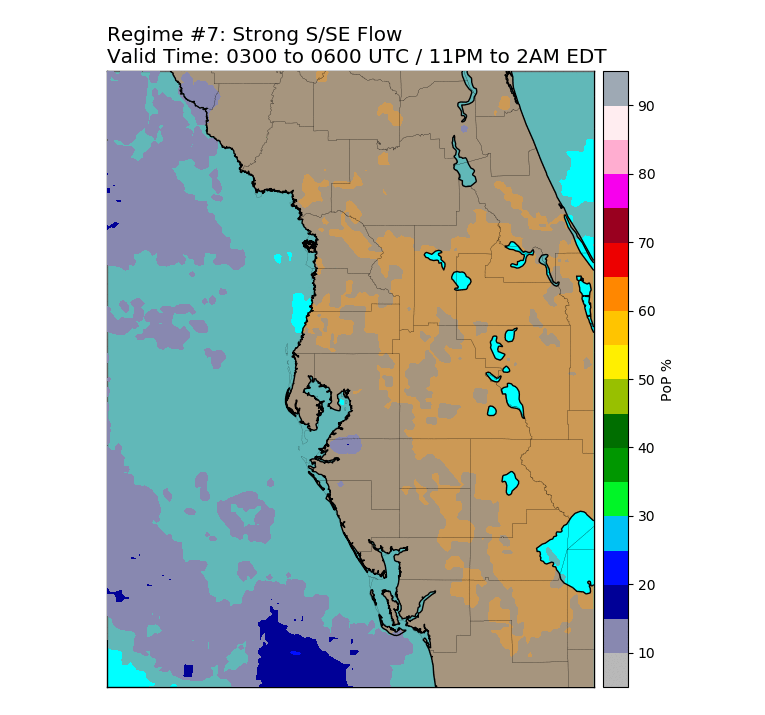
|
|
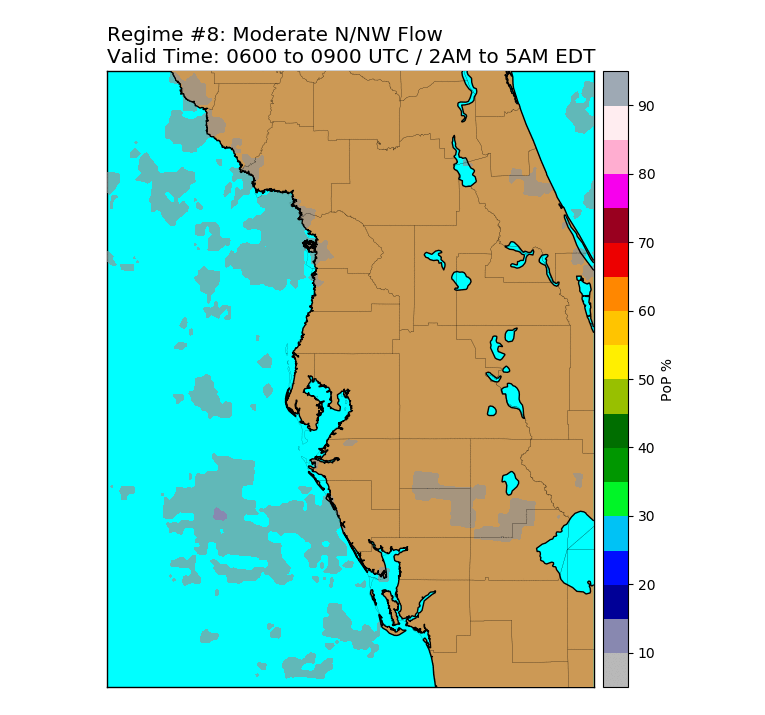
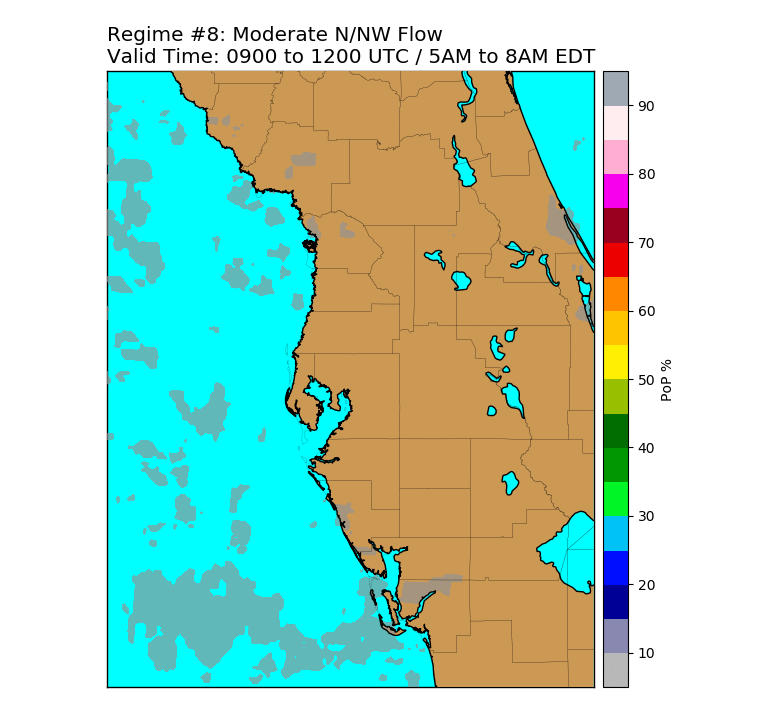
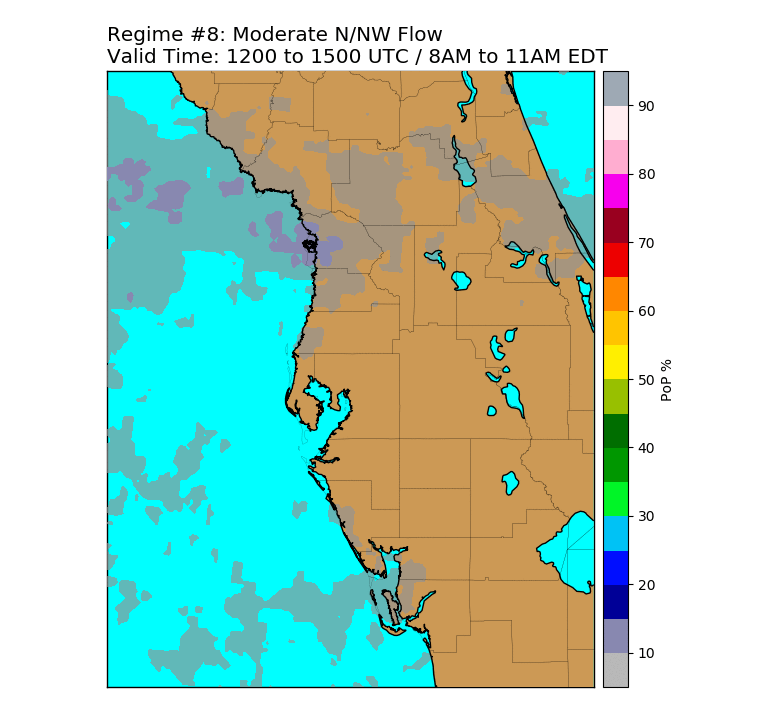
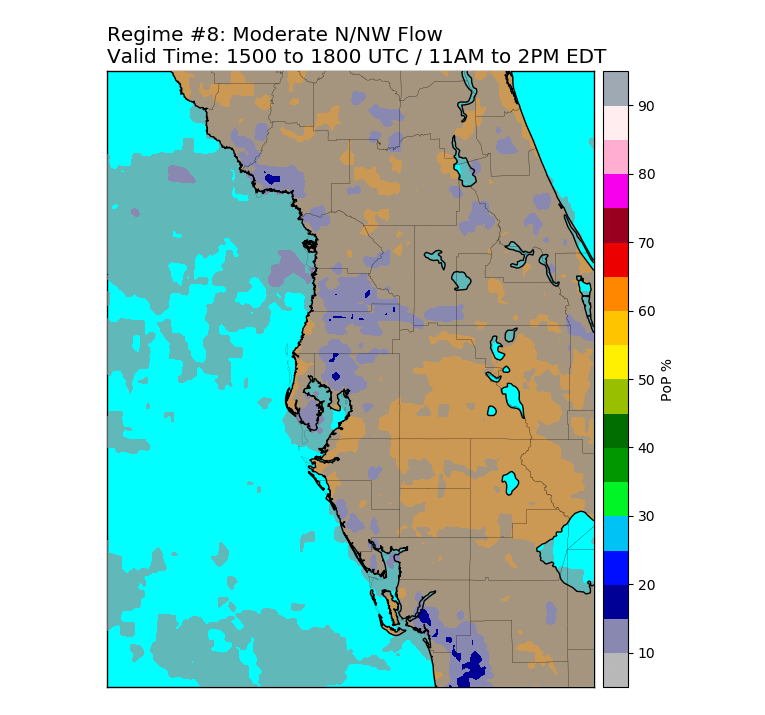
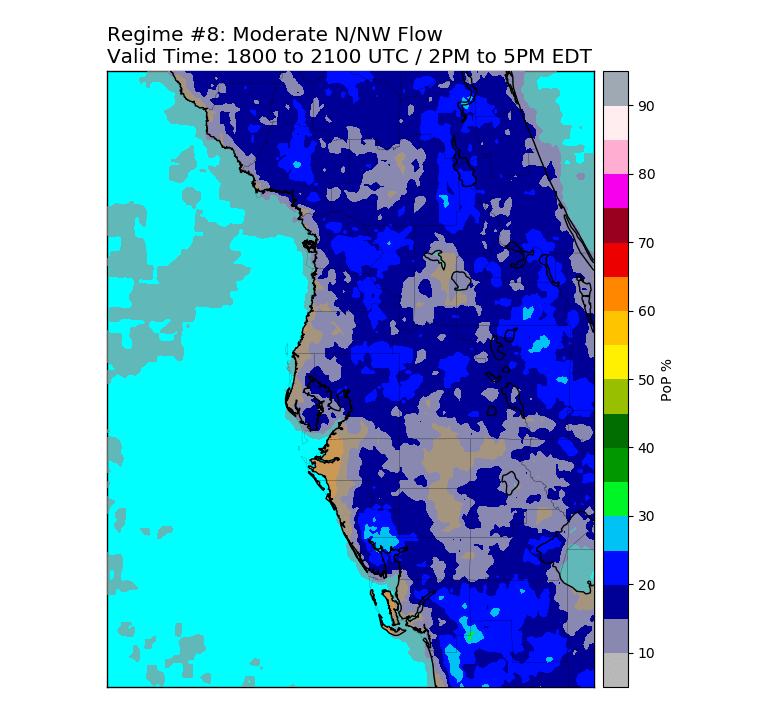
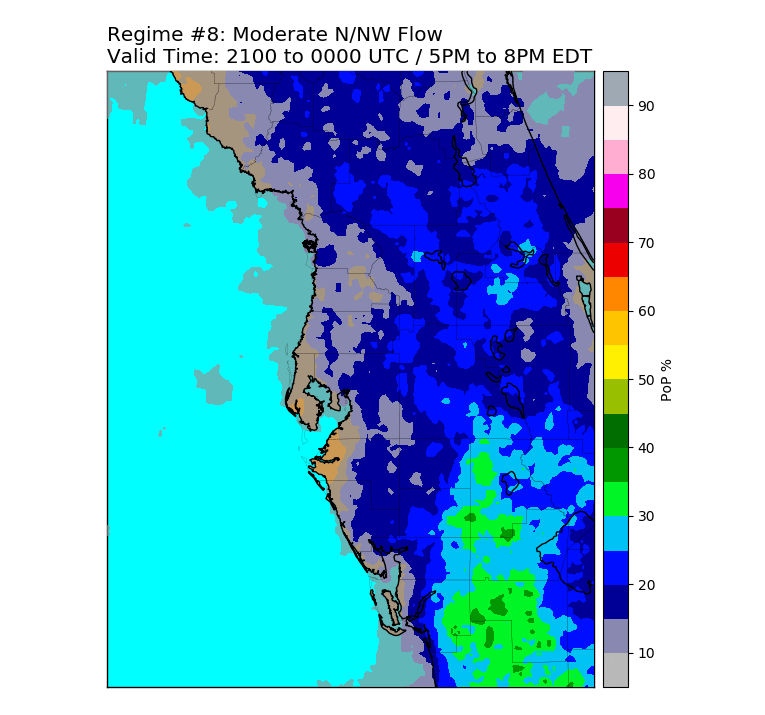
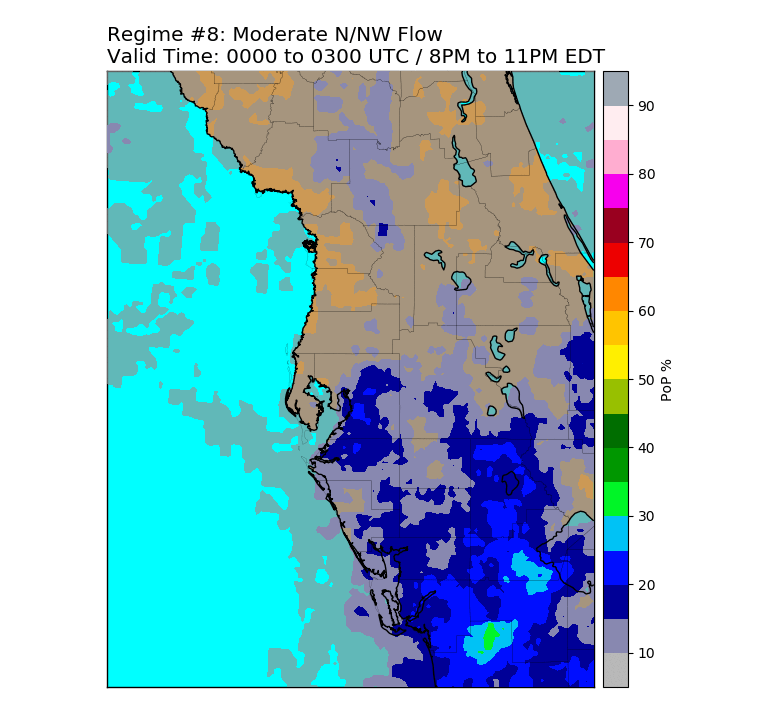
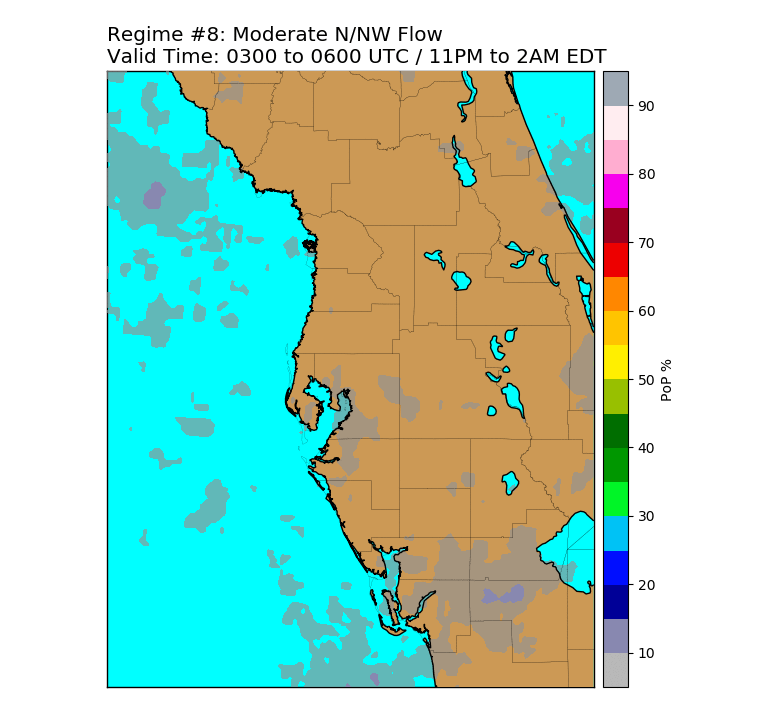
Regime 8 PoP Coverage: |
||||
24 Hour |
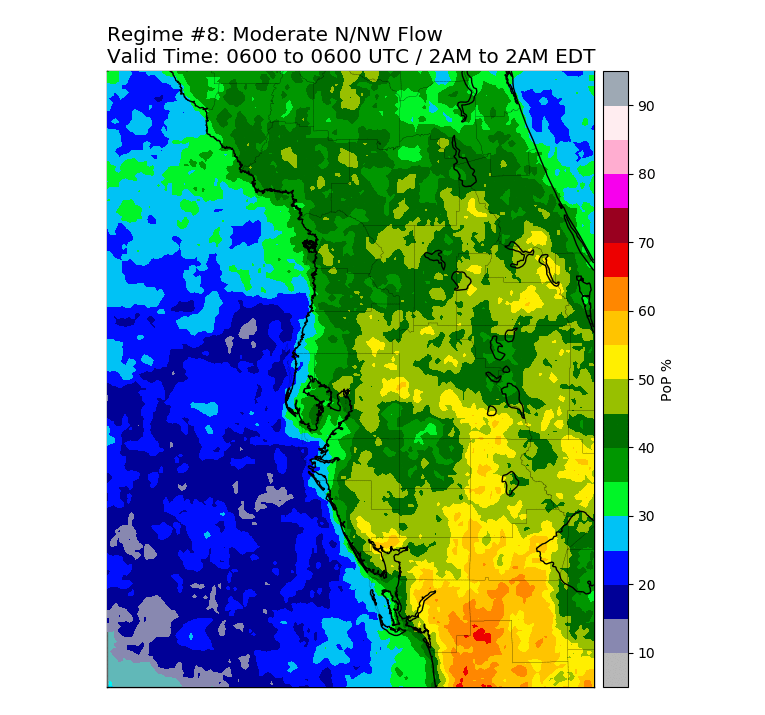
|
12 Hour |
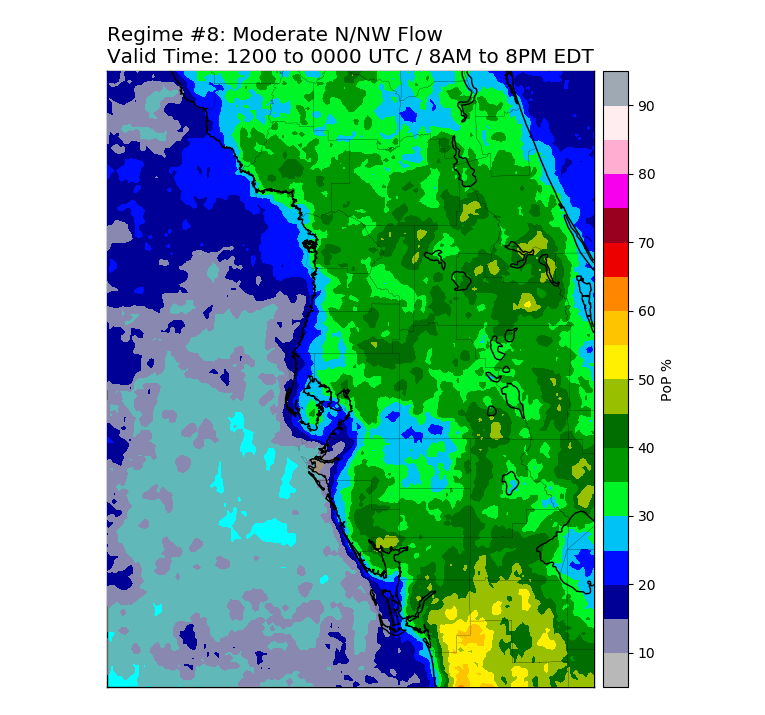
|
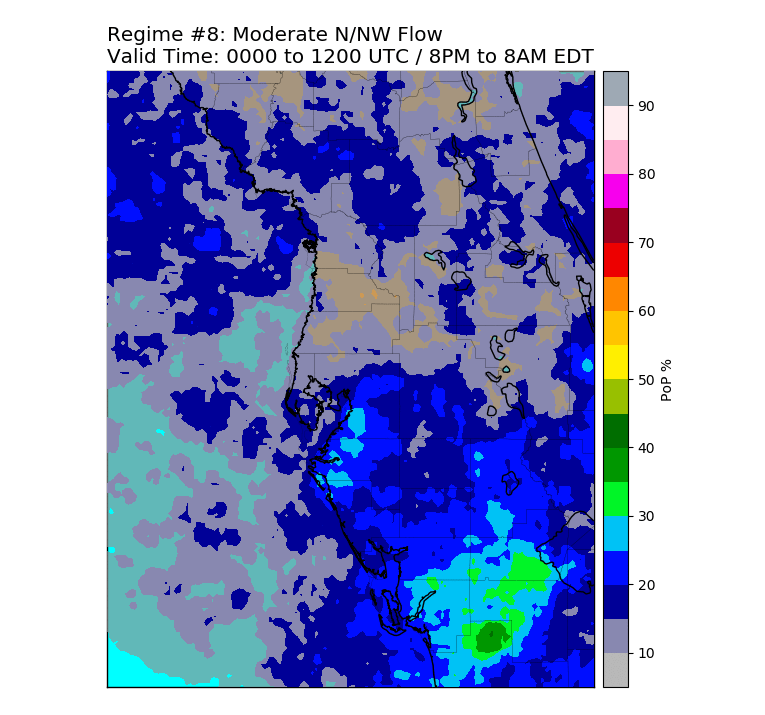
|
6 Hour |
|
|
|
|
3 Hour |
|
|
|
|
|
|
|
|
|