| West Central and Southwest Florida Climate Tables and Graphics for Summer 2019 |
||
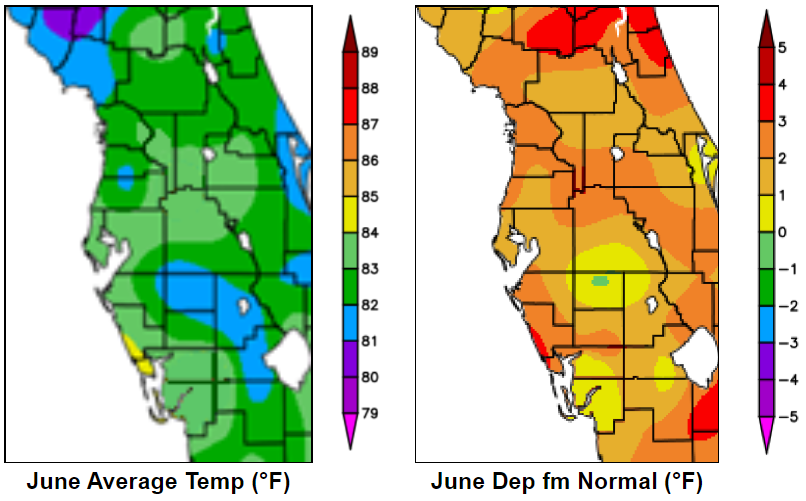
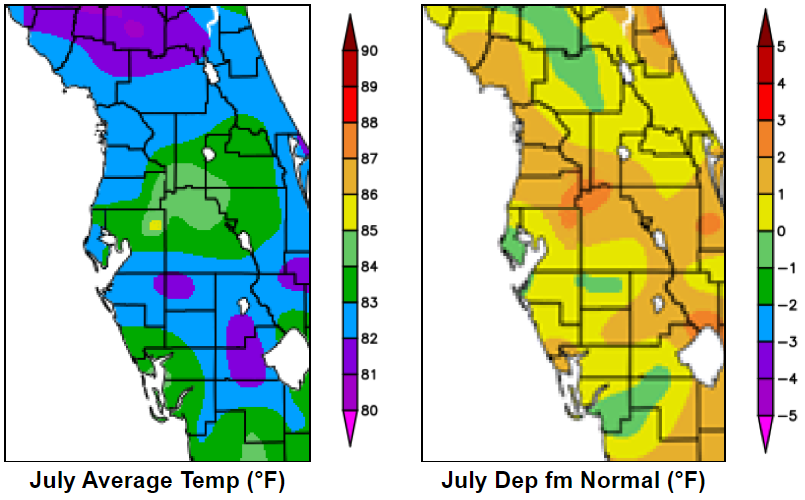
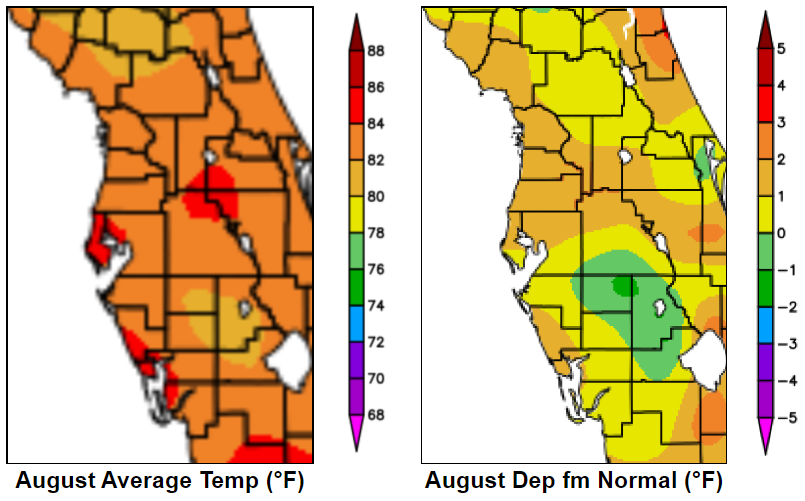
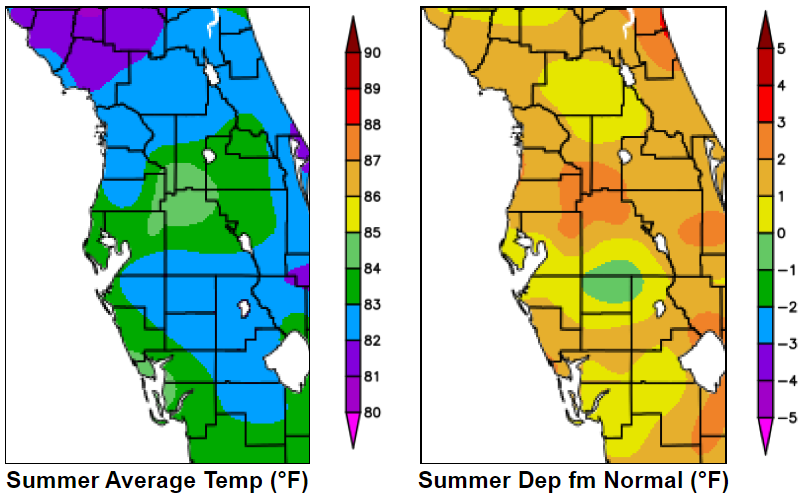
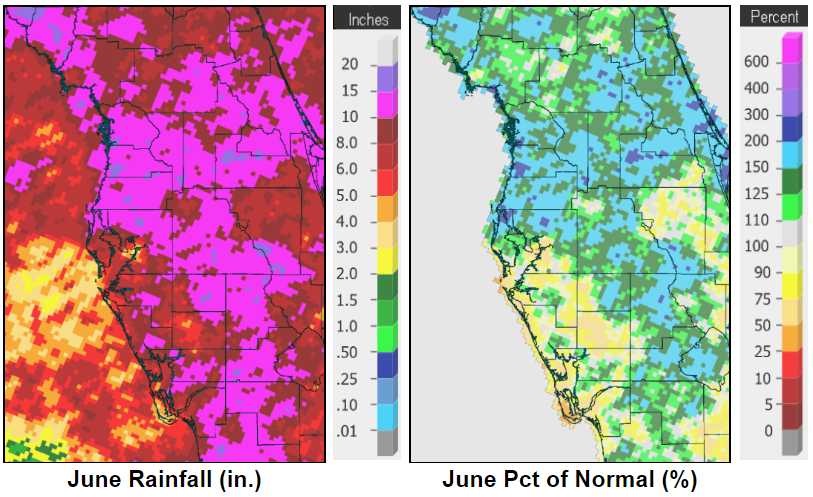
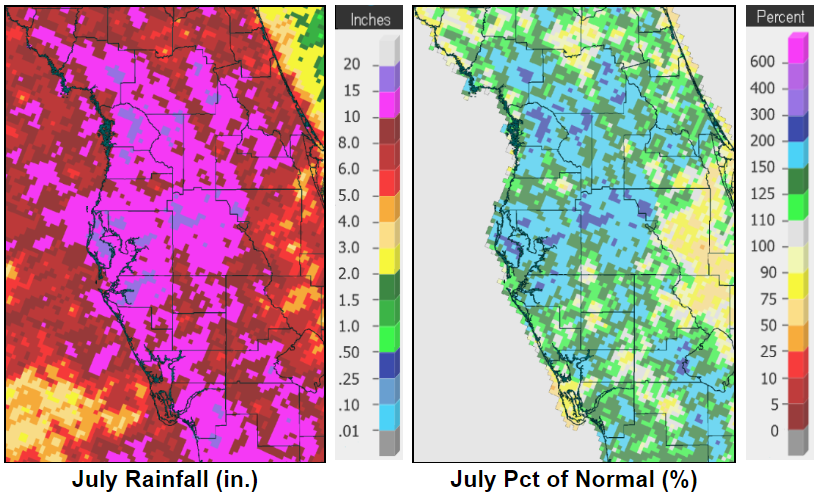
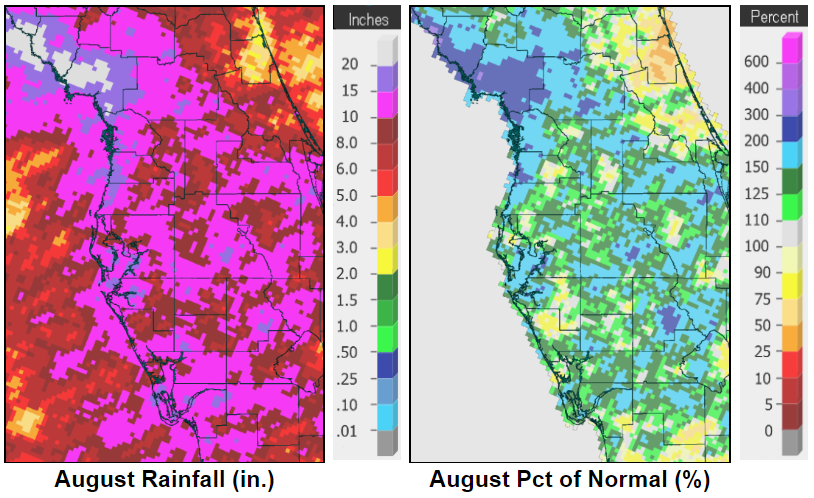
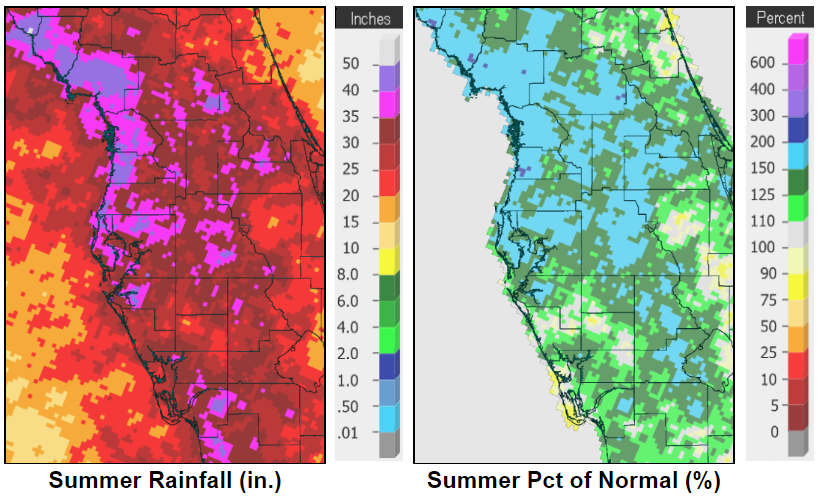
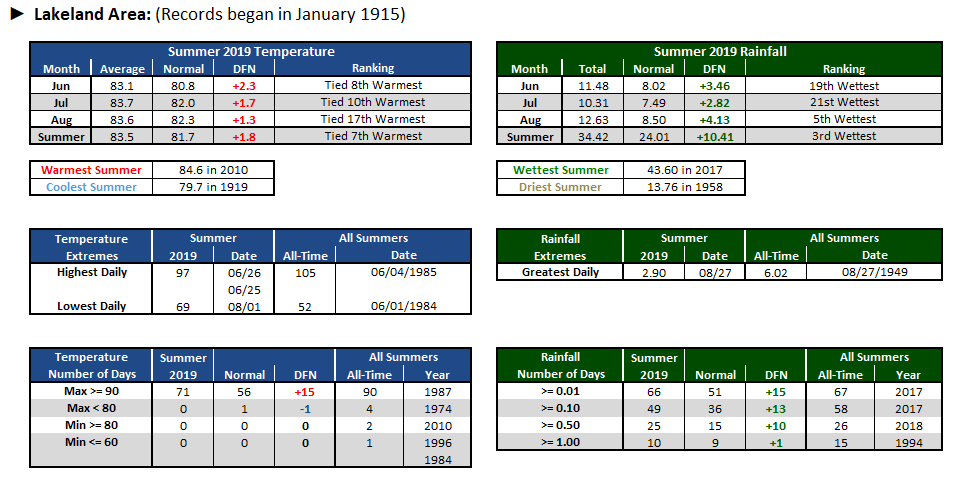
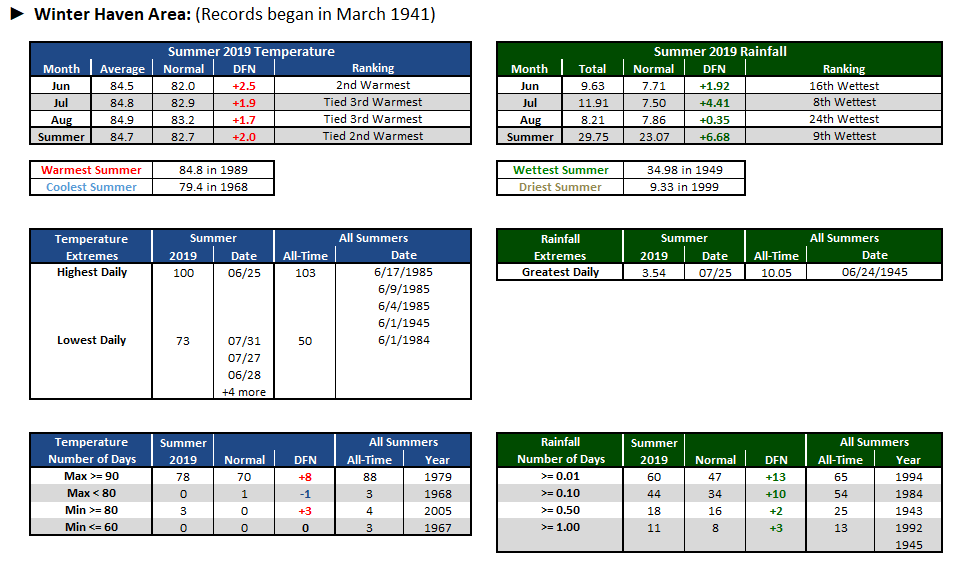
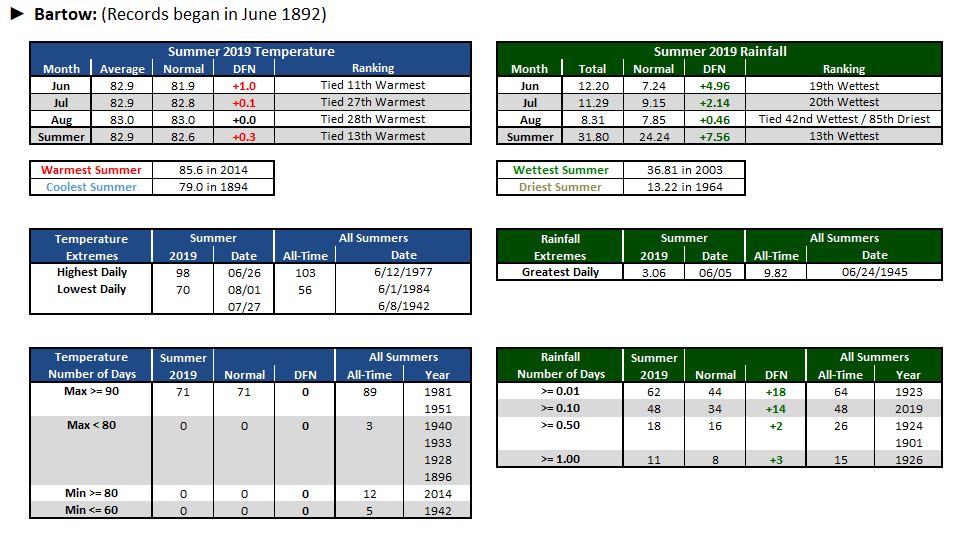
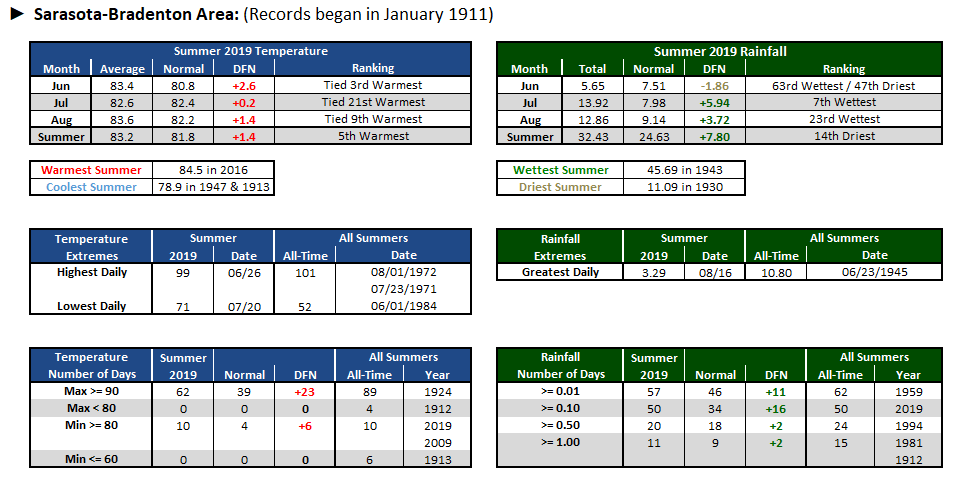
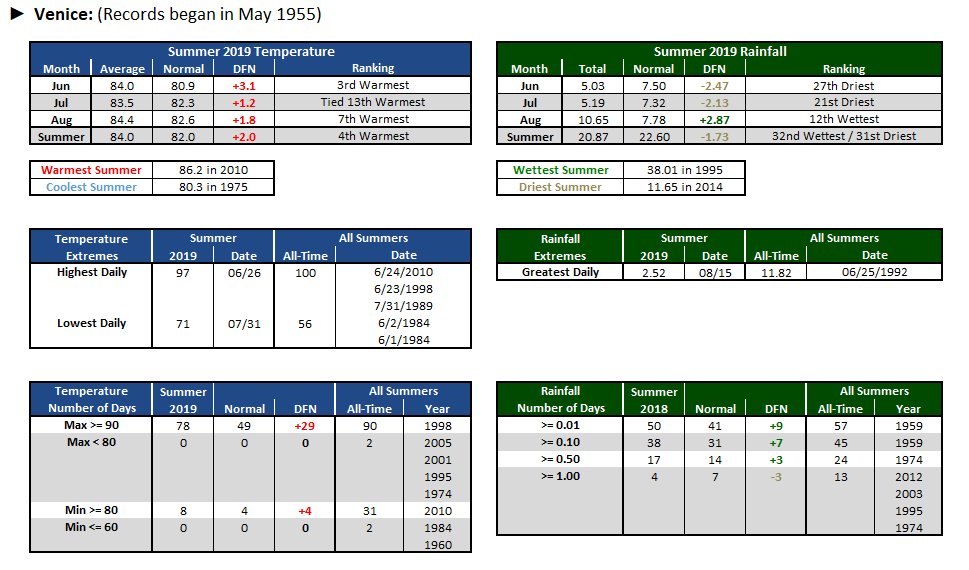
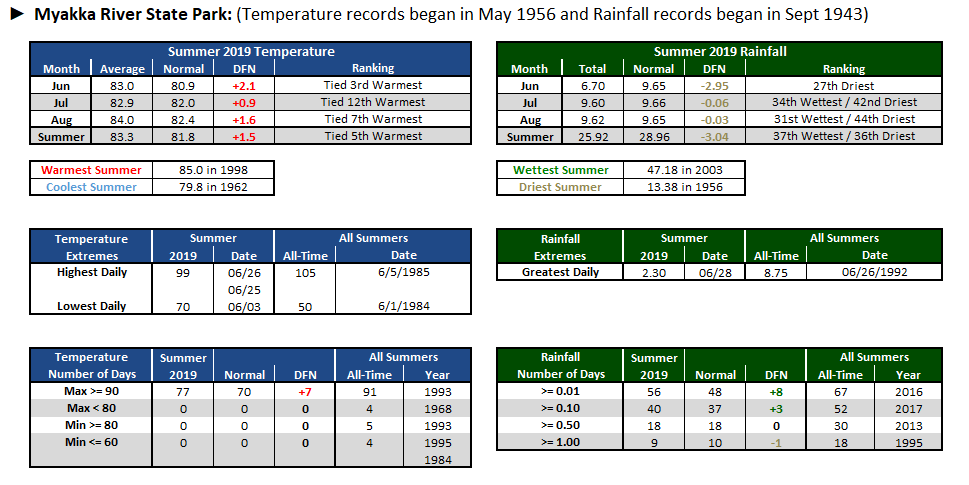
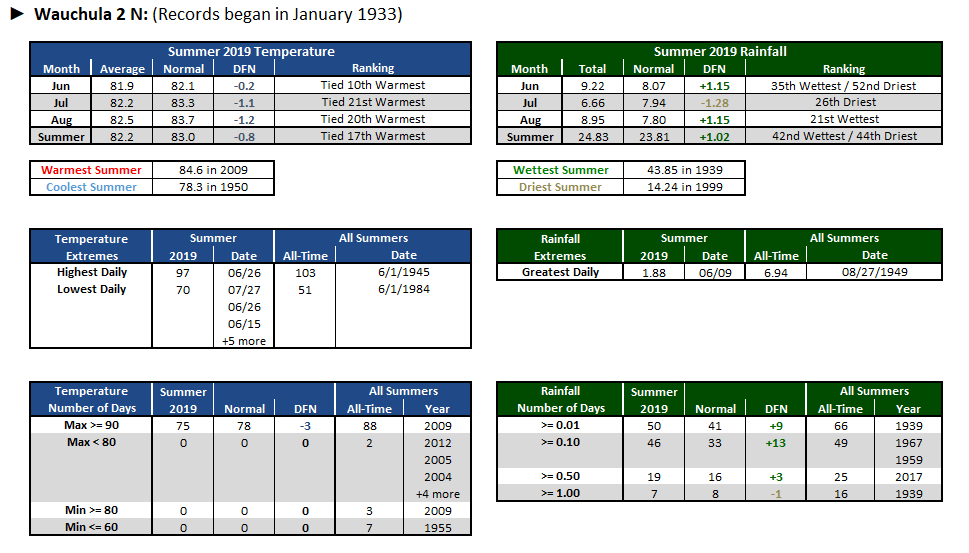
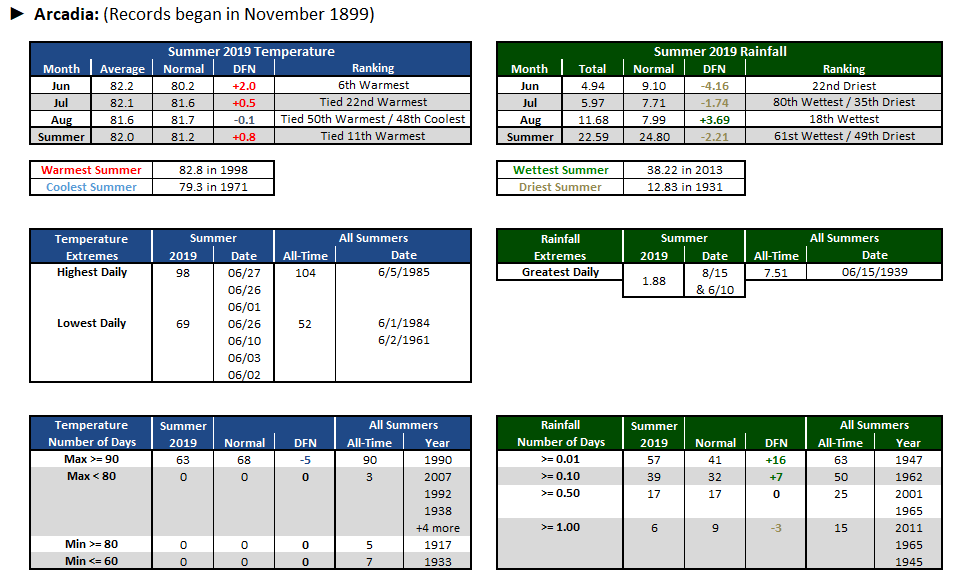
Summer 2019 (June/July/August) across West Central and Southwest Florida was generally warmer than normal with temperatures averaging in the lower to middle 80s, which was near normal to a little over 3 degrees above normal. Rainfall on the other hand was highly variable across the region with many areas over the southern interior seeing below normal rainfall for much of the Summer. Meanwhile many locations from the Tampa Bay area northward saw well above normal rainfall and a lot of this rainfall occurred during a one week period in August when a frontal boundary stalled across north Florida with deep moisture and a southwest to west flow bringing rounds of showers and thunderstorms. |
| Summer 2019 Temperature (°F) | Summer 2019 Rainfall (inches) | |||||||||
| Site | Average | Normal | DFN | Ranking | Site | Total | Normal | DFN | Ranking | |
| Arcadia | 82.0 | 81.2 | +0.8 | Tied 11th Warmest | Arcadia | 22.59 | 24.80 | -2.21 | 61st Wettest / 49th Driest | |
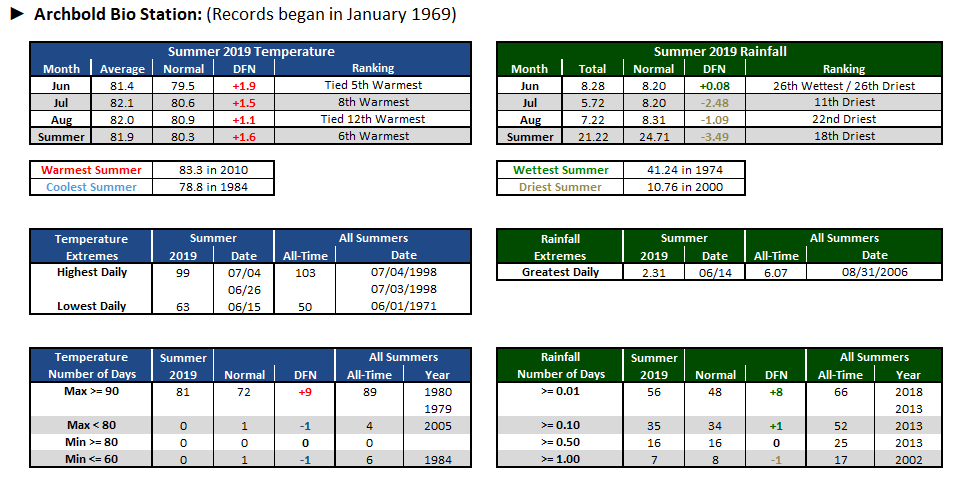
| Archbold | 81.9 | 80.3 | +1.6 | 6th Warmest | Archbold | 21.22 | 24.71 | -3.49 | 18th Driest | |
| Bartow | 82.9 | 82.6 | +0.3 | Tied 13th Warmest | Bartow | 31.80 | 24.24 | +7.56 | 13th Wettest | |
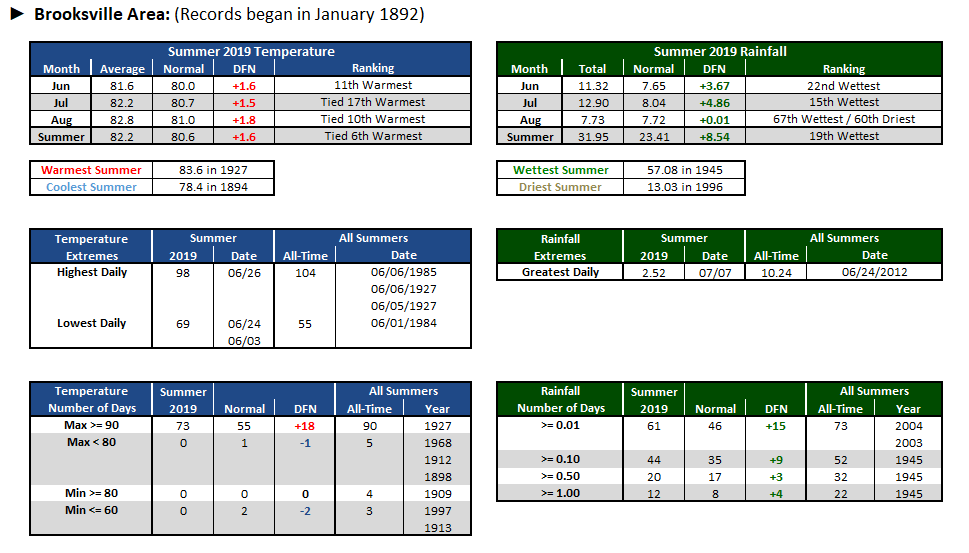
| Brooksville | 82.2 | 80.6 | +1.6 | Tied 6th Warmest | Brooksville | 31.95 | 23.41 | +8.54 | 19th Wettest | |
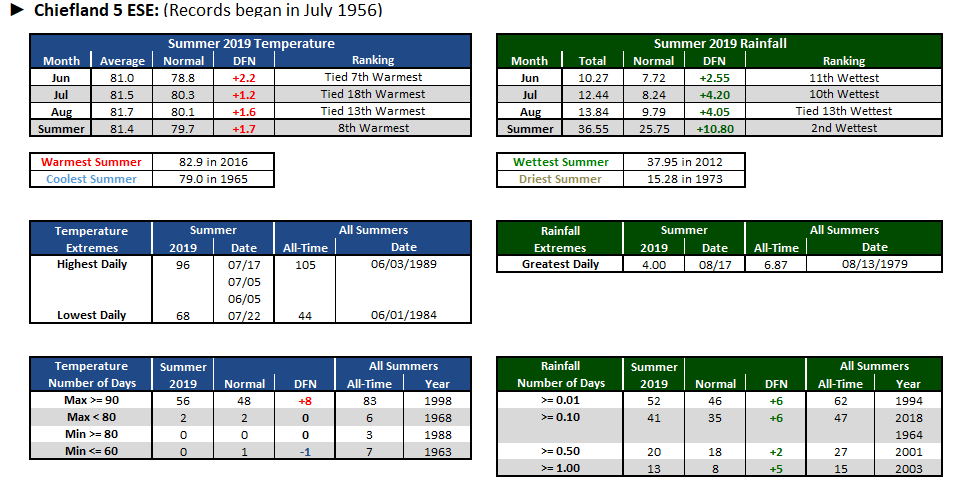
| Chiefland 5 ESE | 81.4 | 79.7 | +1.7 | 8th Warmest | Chiefland 5 ESE | 36.55 | 25.75 | +10.80 | 2nd Wettest | |
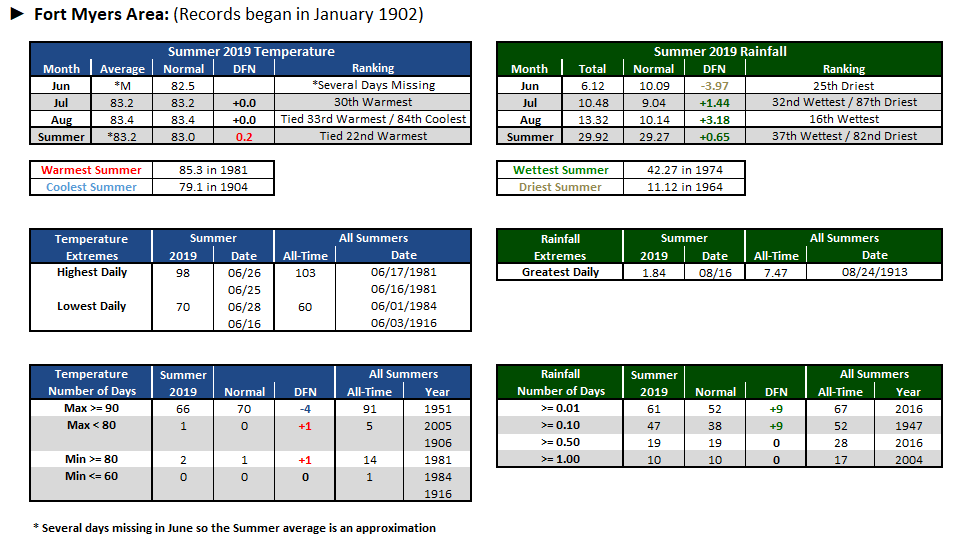
| Fort Myers | *83.2 | 83.0 | +0.2 | Tied 22nd Warmest | Fort Myers | 29.92 | 29.27 | +0.65 | 37th Wettest / 82nd Driest | |
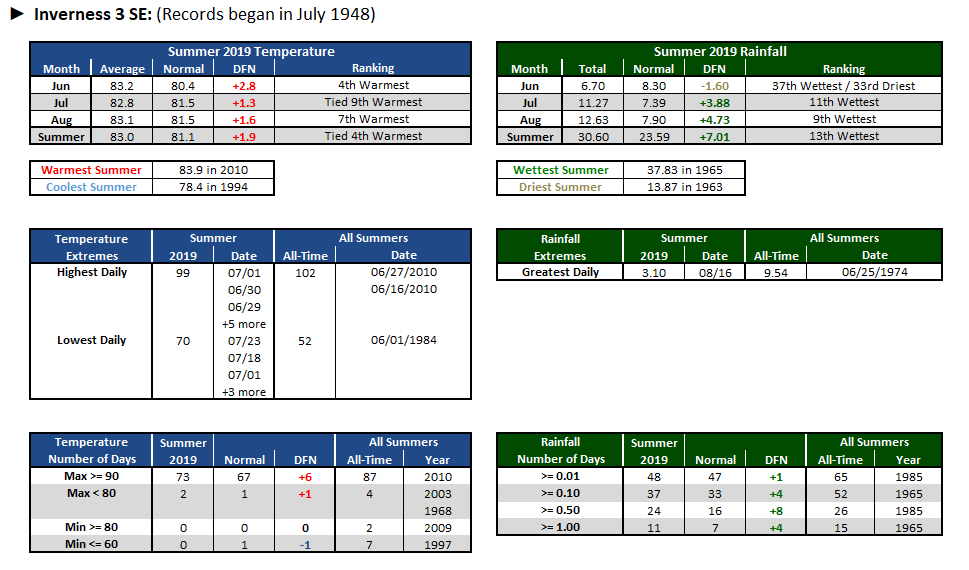
| Inverness 3 SE | 83.0 | 81.1 | +1.9 | Tied 4th Warmest | Inverness 3 SE | 30.60 | 23.59 | +7.01 | 13th Wettest | |
| Lakeland | 83.5 | 81.7 | +1.8 | Tied 7th Warmest | Lakeland | 34.42 | 24.01 | +10.41 | 3rd Wettest | |
| Myakka Rvr St Pk | 83.3 | 81.8 | +1.5 | Tied 5th Warmest | Myakka Rvr St Pk | 25.92 | 28.96 | -3.04 | 37th Wettest / 36th Driest | |
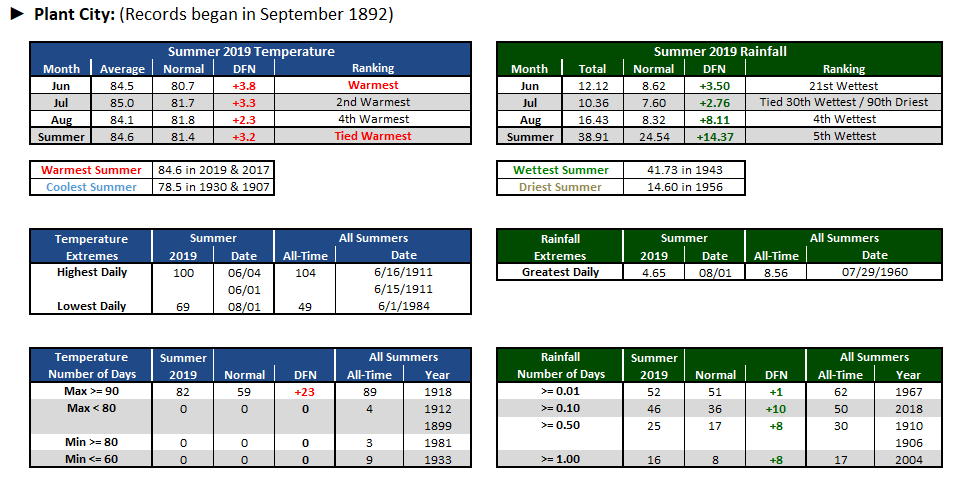
| Plant City | 84.6 | 81.4 | +3.2 | Tied Warmest | Plant City | 38.91 | 24.54 | +14.37 | 5th Wettest | |
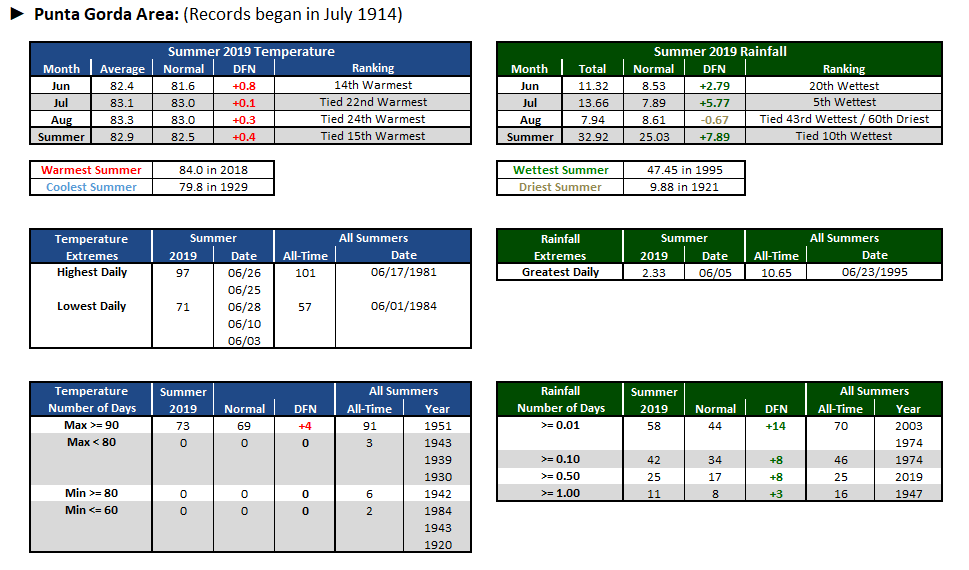
| Punta Gorda | 82.9 | 82.5 | +0.4 | Tied 15th Warmest | Punta Gorda | 32.92 | 25.03 | +7.89 | Tied 10th Wettest | |
| Sarasota-Bradenton | 83.2 | 81.8 | +1.4 | 5th Warmest | Sarasota-Bradenton | 32.43 | 24.63 | +7.80 | 14th Driest | |
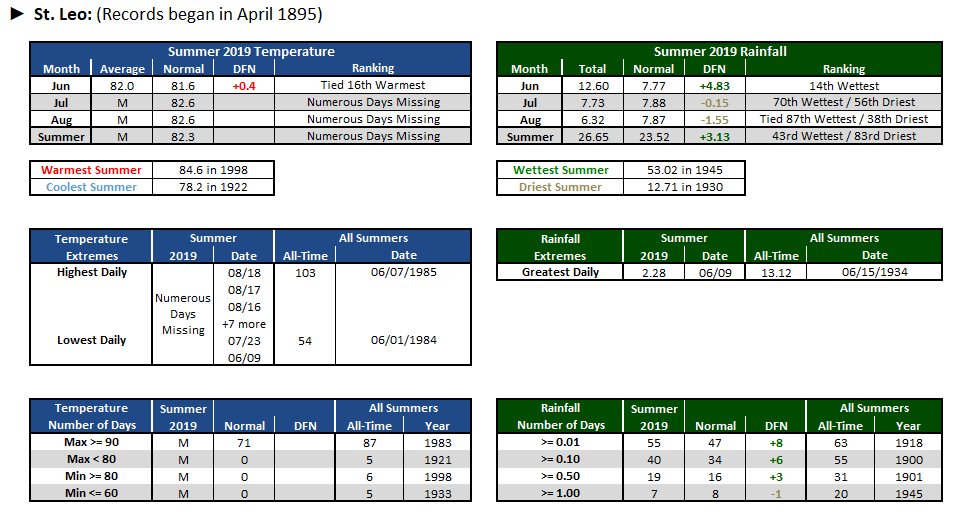
| St. Leo | M | 82.3 | M | Numerous Days Missing | St. Leo | 26.65 | 23.52 | +3.13 | 43rd Wettest / 83rd Driest | |
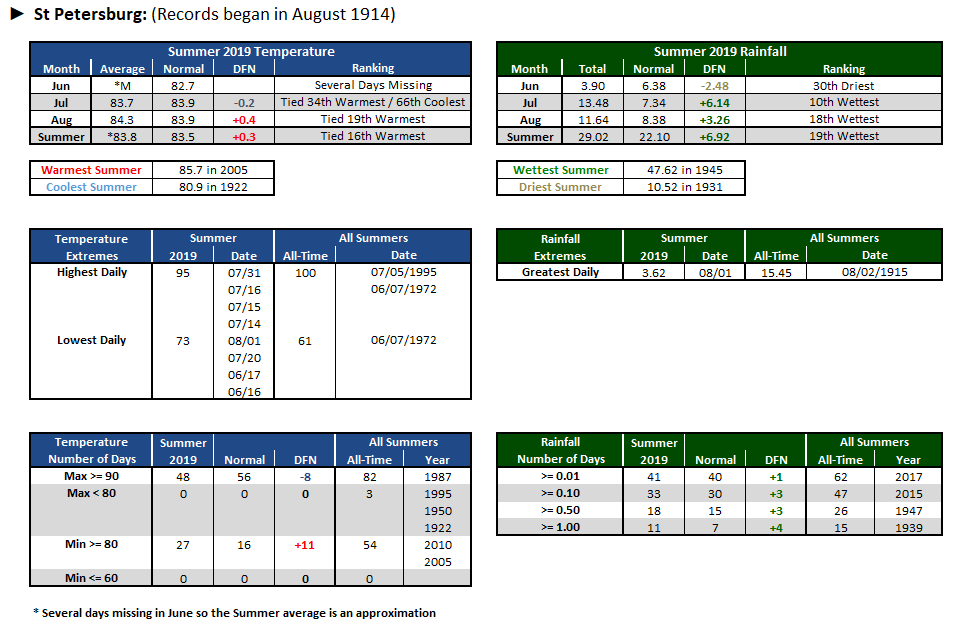
| St. Petersburg | *83.8 | 83.5 | M | Tied 16th Warmest | St. Petersburg | 29.02 | 22.10 | +6.92 | 19th Wettest | |
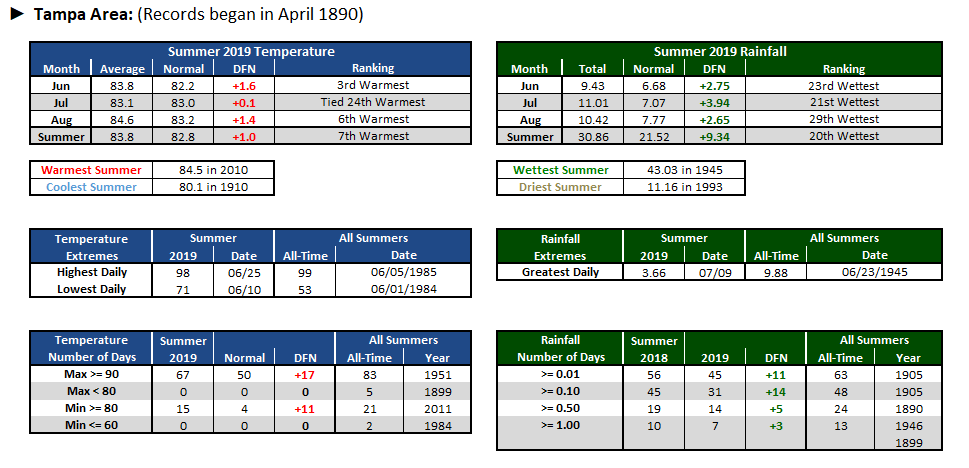
| Tampa | 83.8 | 82.8 | +1.0 | 7th Warmest | Tampa | 30.86 | 21.52 | +9.34 | 20th Wettest | |
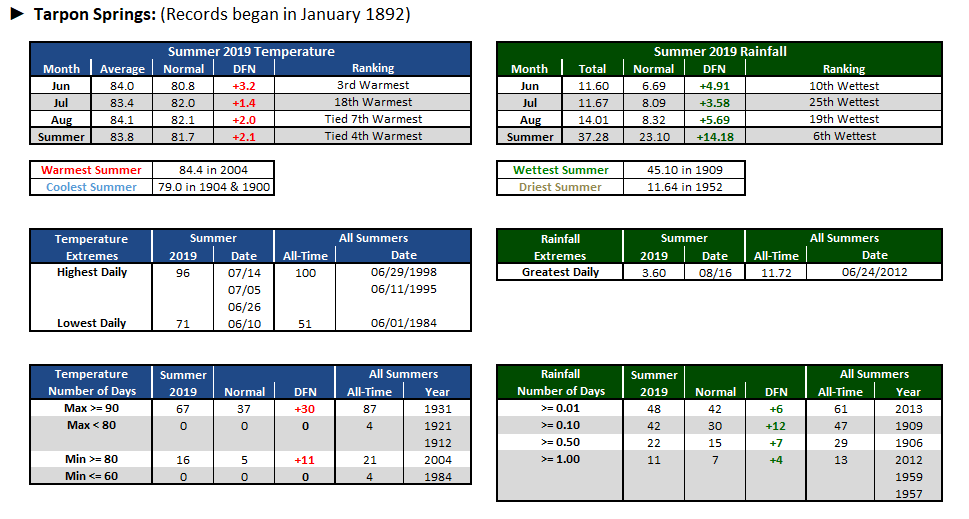
| Tarpon Springs | 83.8 | 81.7 | +2.1 | Tied 4th Warmest | Tarpon Springs | 37.28 | 23.10 | +14.18 | 6th Wettest | |
| Venice | 84.0 | 82.0 | +2.0 | 4th Warmest | Venice | 20.87 | 22.60 | -1.73 | 32nd Wettest / 31st Driest | |
| Wauchula 2 N | 82.2 | 83.0 | -0.8 | Tied 17th Warmest | Wauchula 2 N | 24.83 | 23.81 | +1.02 | 42nd Wettest / 44th Driest | |
| Winter Haven | 84.7 | 82.7 | +2.0 | Tied 2nd Warmest | Winter Haven | 29.75 | 23.07 | +6.68 | 9th Wettest | |
Click on a "Site" name above for more detailed information |
All images on this page can be magnified by left clicking on them, and resized back to original size with a second left click. |
|
 |
 |
 |
 |
 |
 |
 |
 |
All images on this page can be magnified by left clicking on them, and resized back to original size with a second left click. |
|
 |
|
| (Back to Top) |
|
 |
|
| (Back to Top) |
|
 |
|
| (Back to Top) |
|
 |
|
| (Back to Top) |
|
 |
|
| (Back to Top) |
|
 |
|
| (Back to Top) |
|
 |
|
| (Back to Top) |
|
 |
|
| (Back to Top) |
|
 |
|
| (Back to Top) |
|
 |
|
| (Back to Top) |
|
 |
|
| (Back to Top) |
|
 |
|
| (Back to Top) |
|
 |
|
| (Back to Top) |
|
 |
|
| (Back to Top) |
|
 |
|
| (Back to Top) |
|
 |
|
| (Back to Top) |
|
 |
|
| (Back to Top) |
|
 |
|
| (Back to Top) |
|
 |
|
| (Back to Top) |
|