
Strong to severe thunderstorms will continue tonight across portions of the Ohio Valley into the Mid-Atlantic. Heavy rains may bring an isolated flash flooding threat over the central Appalachians, particularly in West Virginia. Moderate to heavy snow will continue over portions of northern Minnesota and the Upper Peninsula of Michigan through Tuesday morning. Read More >
| Overview: | ||
|
Please note: this review and the data provided are preliminary. They are subject to updates and corrections as appropriate. The National Hurricane Center is responsible for conducting the official post-analysis of all tropical cyclones. Once compiled, the Tropical Cyclone Report is posted here. |
||
| Most images in the tabs below can be magnified by clicking, and resized back to original size with a second click. |
||
Rainfall: |
||||
The images below show the rainfall analysis for West Central and Southwest Florida for the 24-hour period of 8 AM EDT August 4, 2024, to 8 AM EDT August 5, 2024 when most of the heavy rain fell, and for the 72-hour period of 8 AM EDT August 3, 2024, to 8 AM EDT August 6, 2024 which covers the entire event. Please note, these rainfall analysis graphics may contain errors and not all data may be considered official. Also, a detailed listing of rainfall amounts for sites across the region can be found within our Post Tropical Cyclone Reports page. |
||||
24-Hr Analysis with Point Values 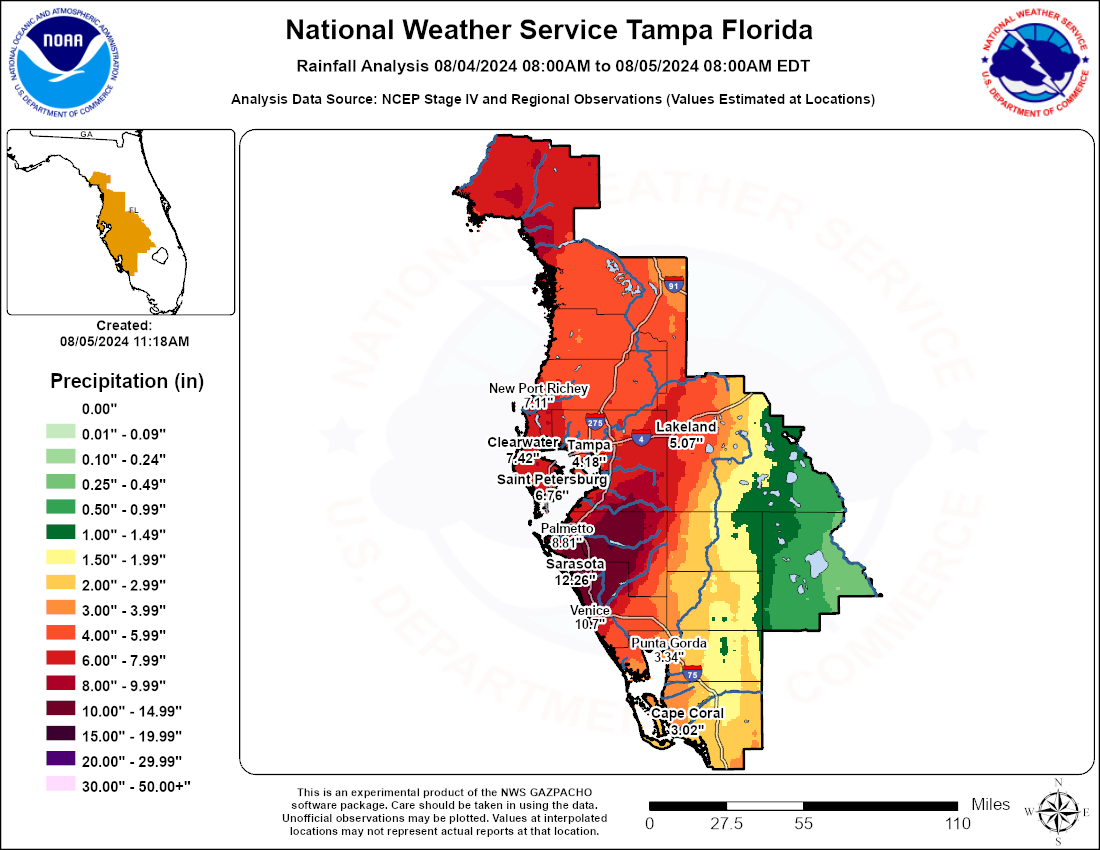 |
24-Hr Analysis without Point Values 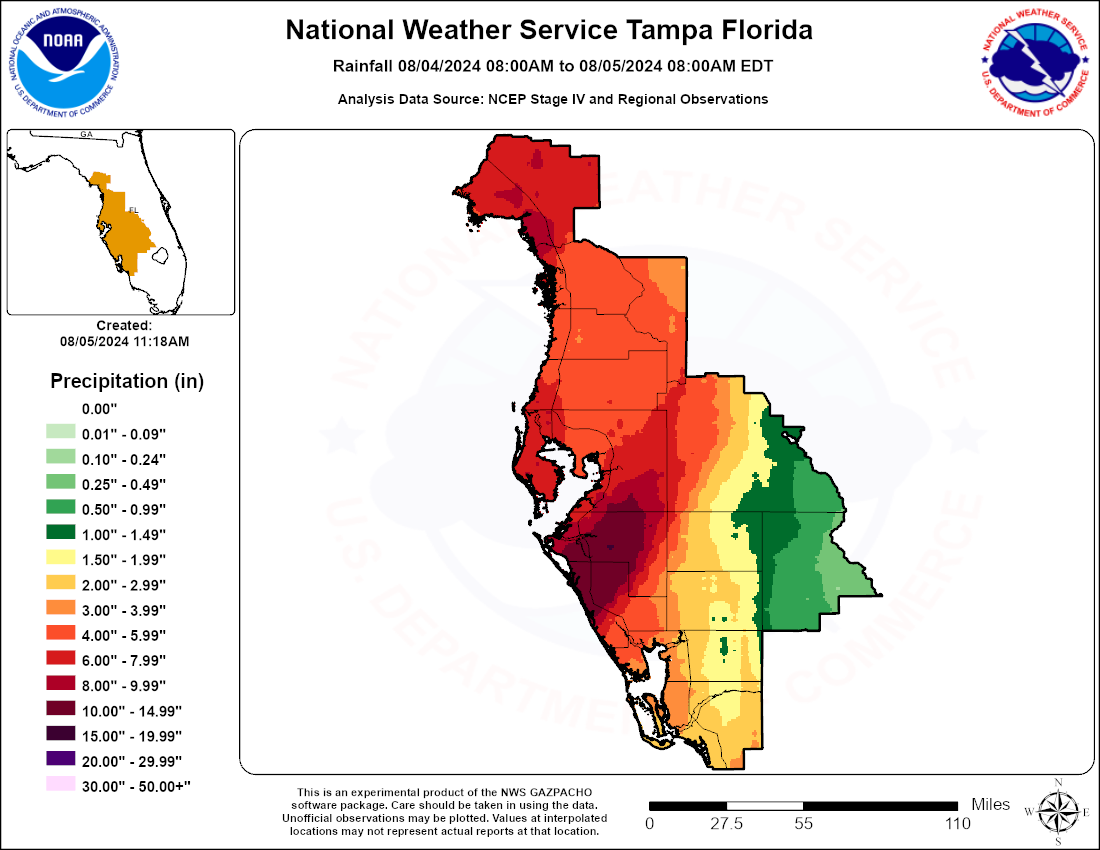 |
24-Hr Annual Exceedance Probability*
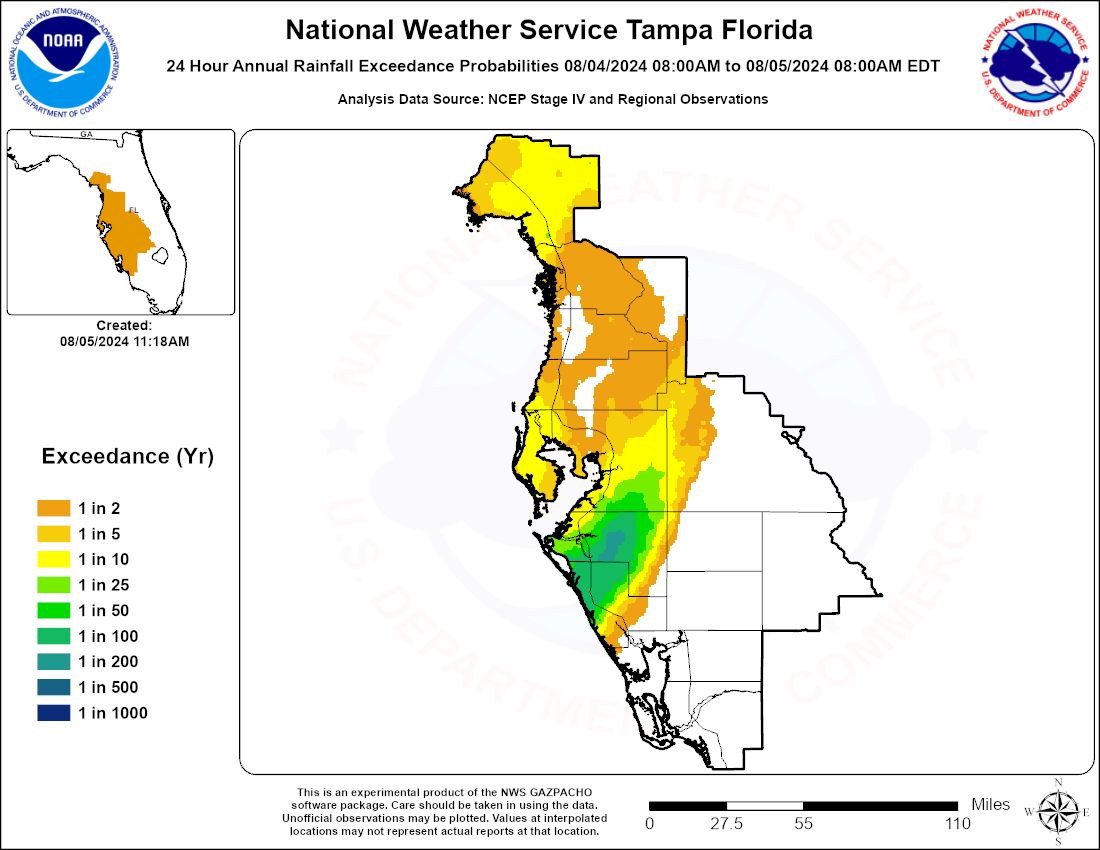 |
||
72-Hr Analysis with Point Values 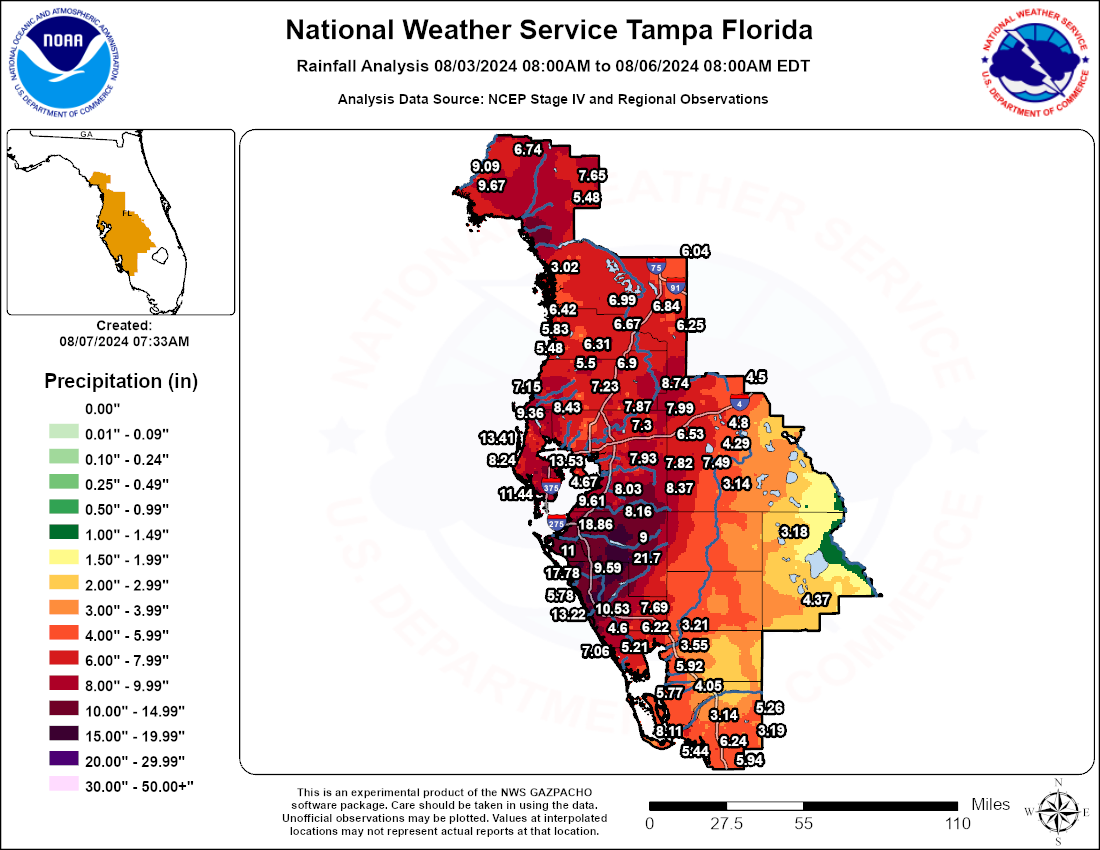 |
72-Hr Analysis without Point Values 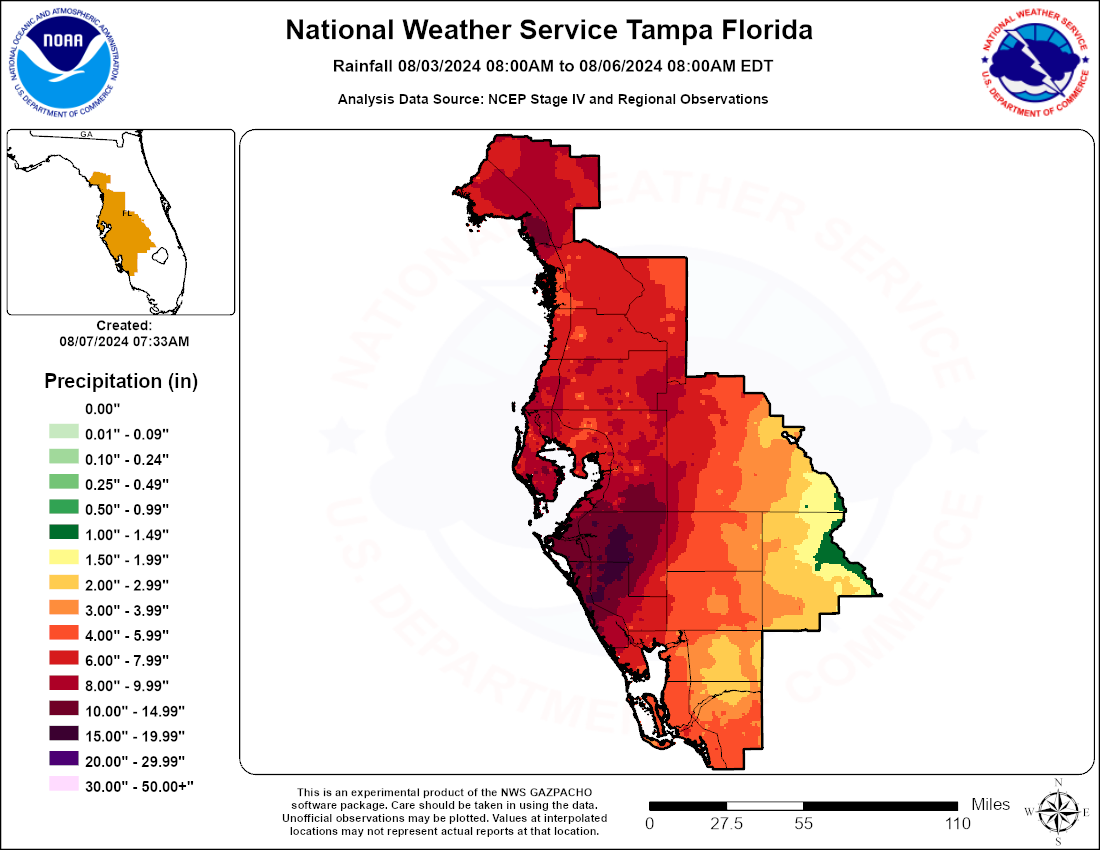 |
72-Hr Annual Exceedance Probability*
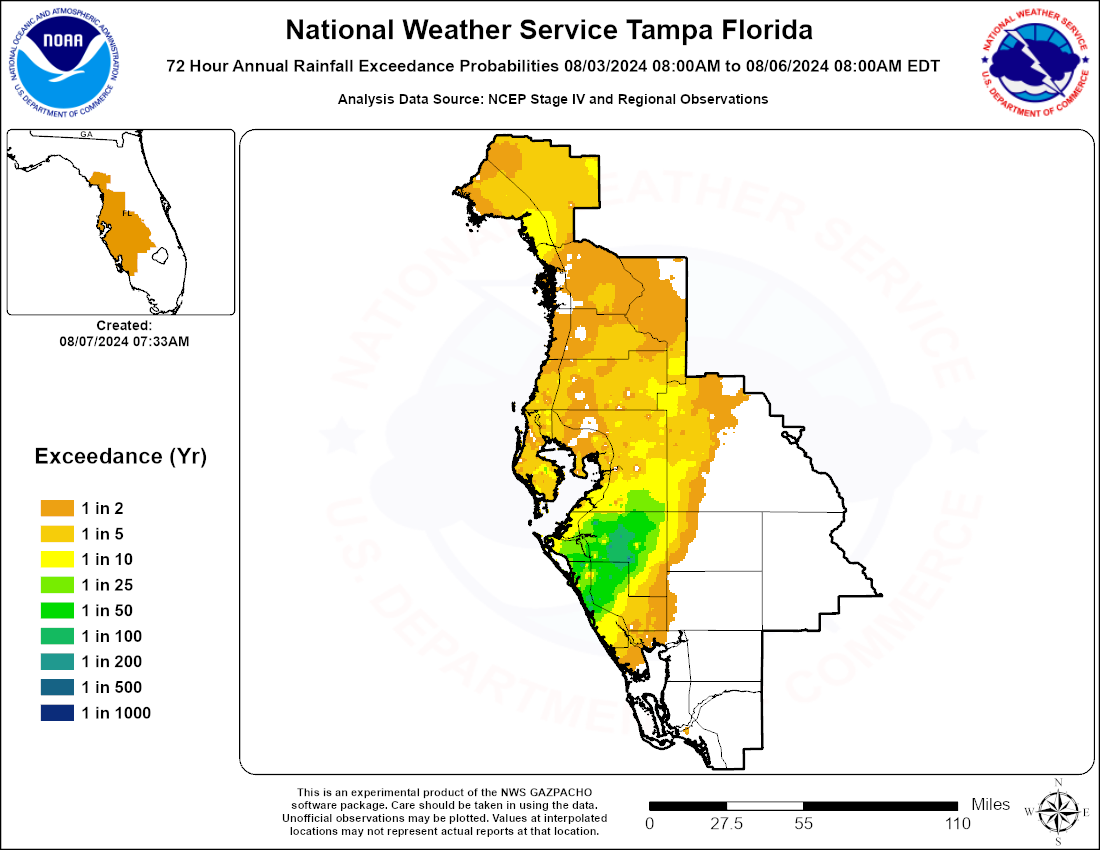 |
||
* |
What is Annual Exceedance Probability (AEP)? Annual Exceedance Probability (AEP) is the probability associated with exceeding a given rainfall amount for a specified duration and at a given location in any given year at least once. Therefore, looking at the 24-hour Annual Exceedance Probability image above we see that in parts of central Manatee County that the AEP is 1 in 200 (dark green area). In other words, the annual chance of seeing this much rain in 24 hours is 0.5%. |
|||
A zoomable rainfall analysis in a GIS format can be viewed at Hurricane Debby - NWS Field GIW/GIS Mutual Aid.
Flooding: |
||
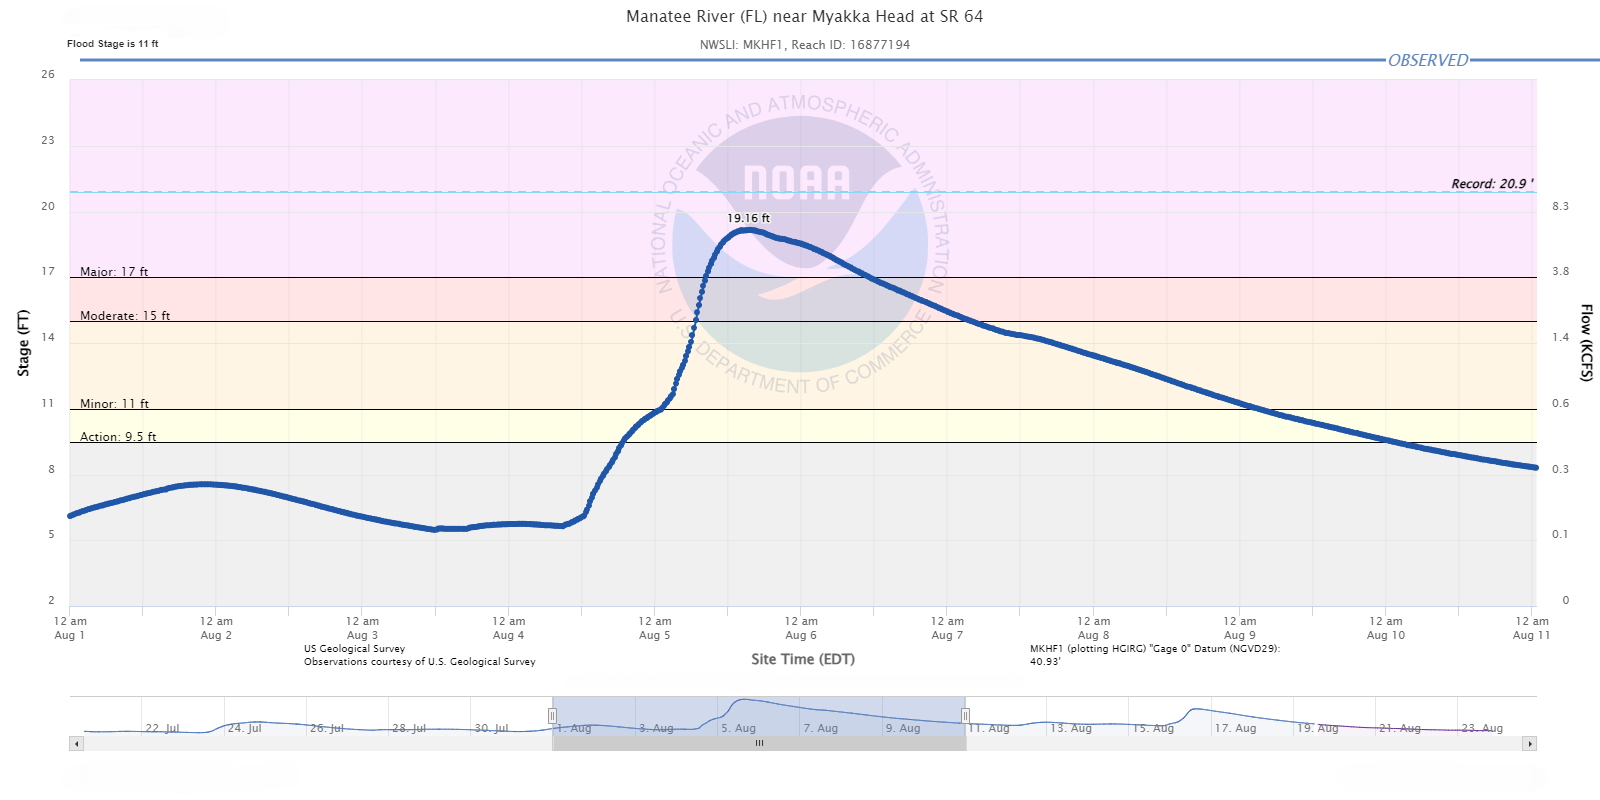
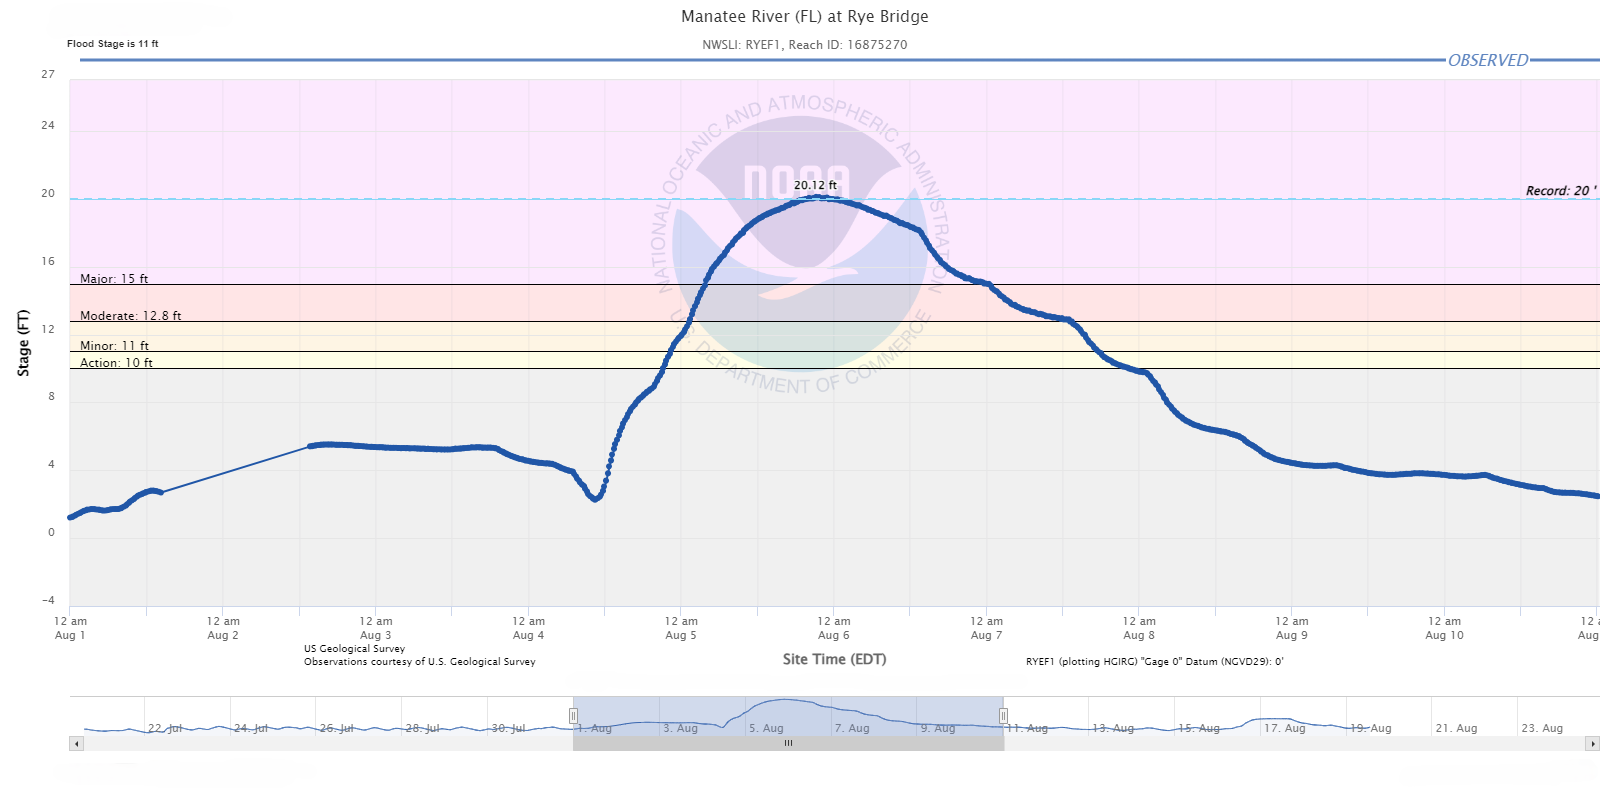
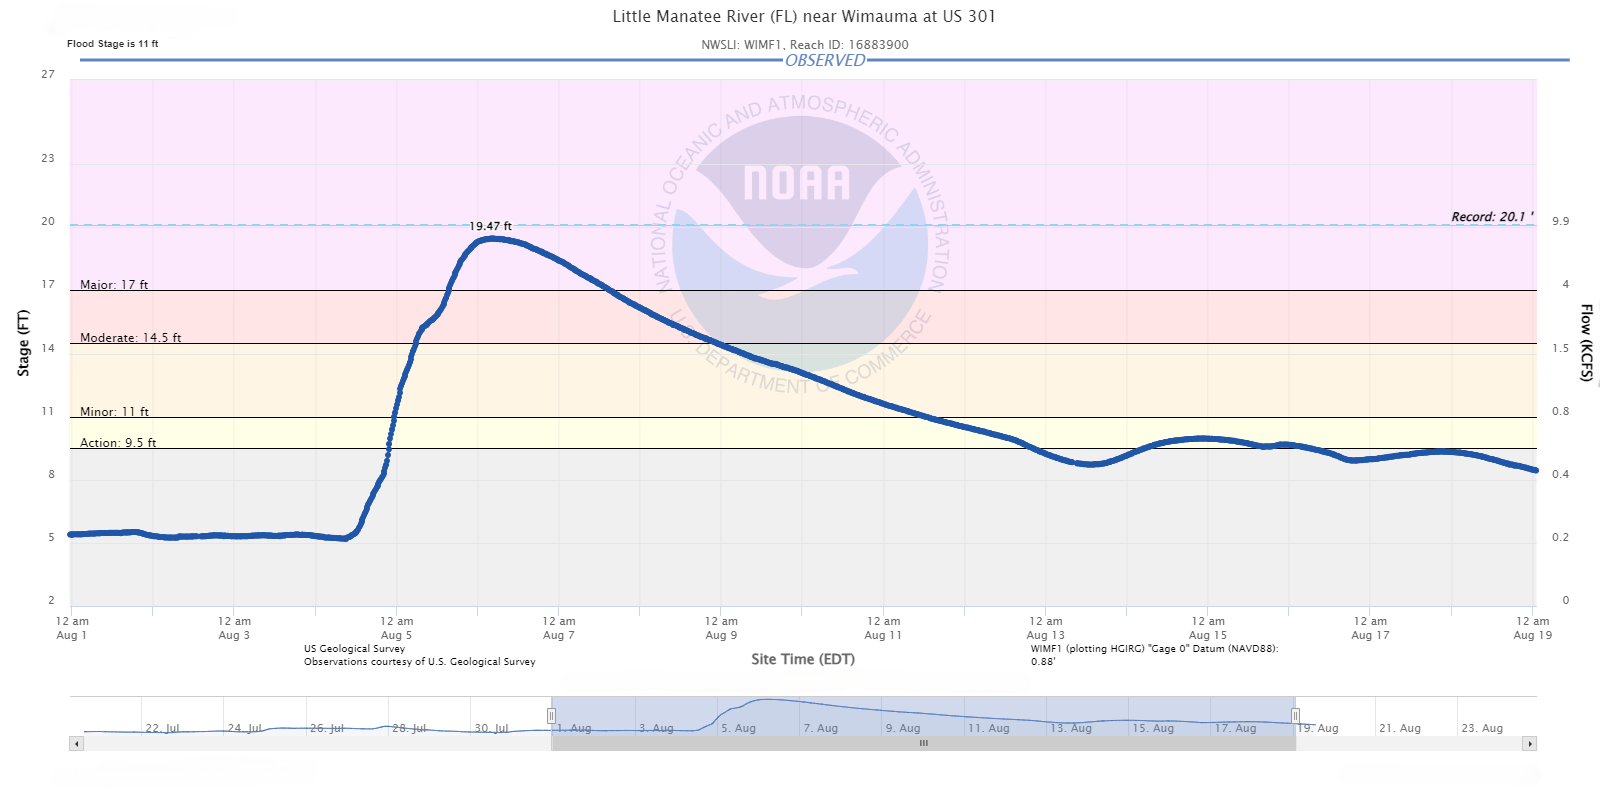
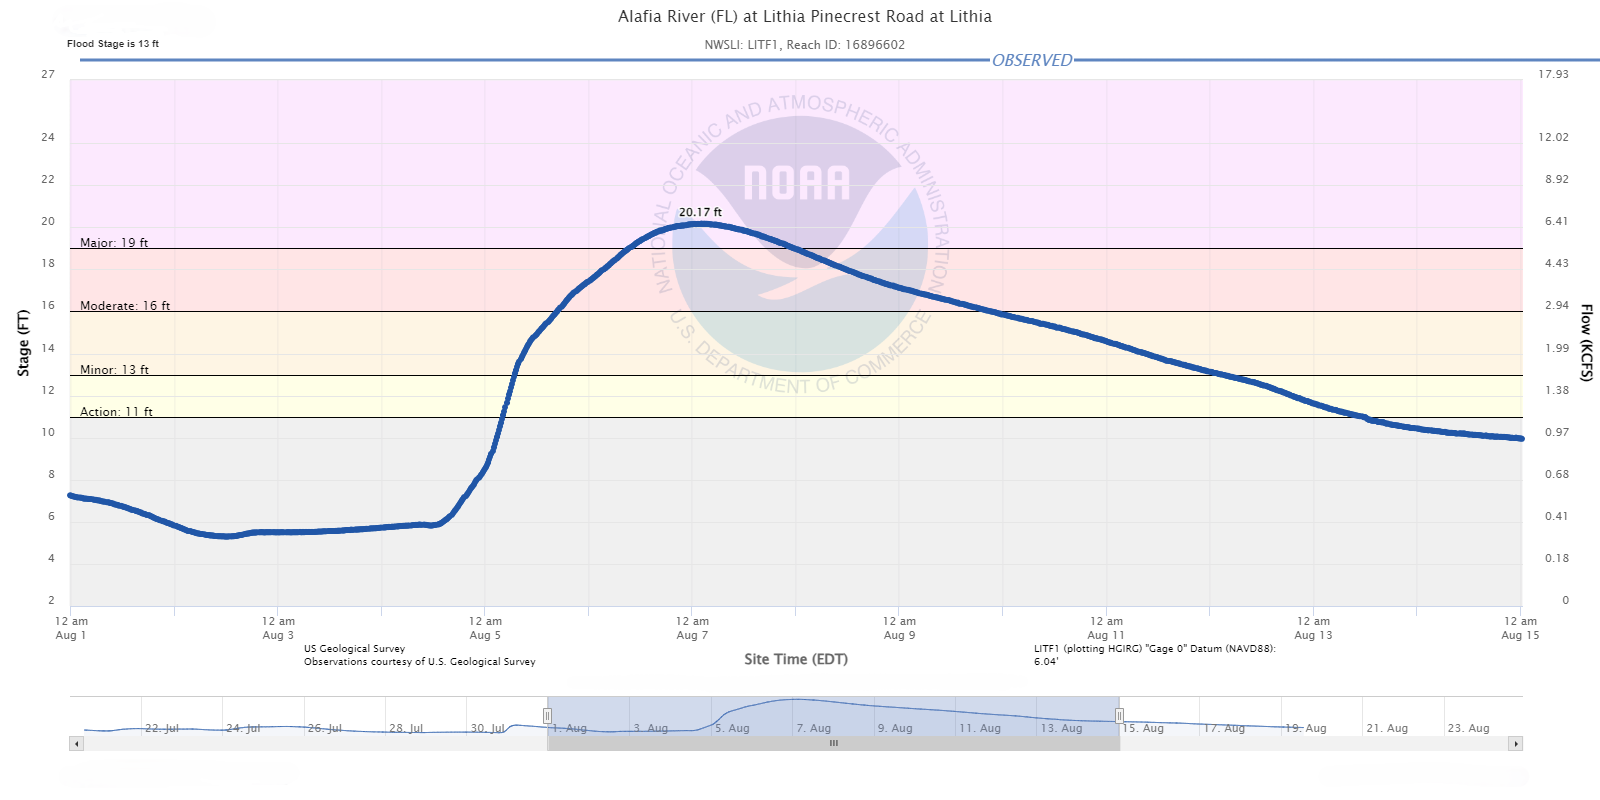
Heavy rainfall caused signficant flooding in portions of Manatee and Sarasota Counties and sent rivers in and around this area into Major Flooding. |
||
Centre Lake Subdivision
.JPG)
|
Centre Lake Subdivision
.JPG)
|
|
Golf Course Road
.JPG)
|
Golf Course Road
.JPG)
|
|
Gamble Creek
.JPG)
|
Tallevast Road
.JPG)
|
|
River Gauges: |
||
Manatee River near Myakka Head at SR 64
|
Manatee River at Rye Bridge
|
|
Little Manatee River near Wimauma at US 301
|
Alafia River at Lithia Pinecrest Road at Lithia
|
|
Winds: |
||
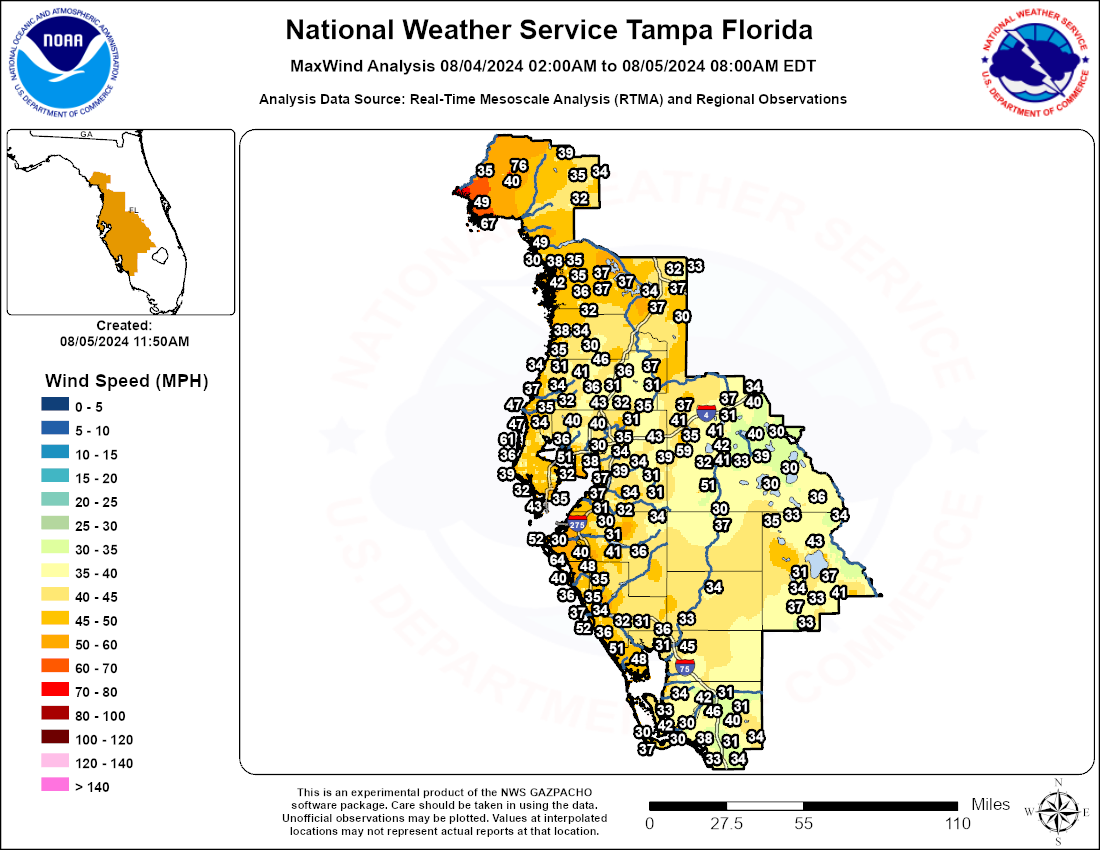
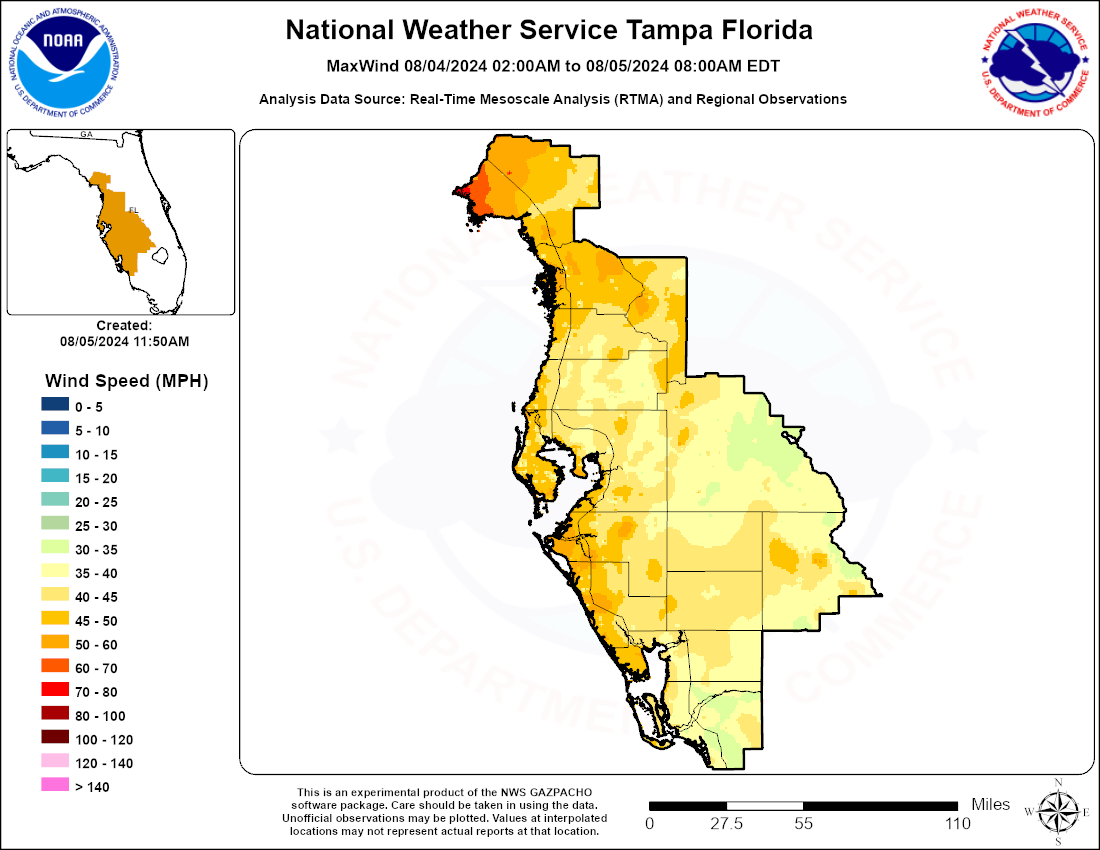
There were also some strong wind gusts associated with Debby. Observed peak winds across West Central and Southwest Florida reached Tropical Storm Force in many locations. Portions of Levy County in the Florida Big Bend reported strong tropical-storm force winds, with isolated gusts to hurricane-force. A detailed listing of wind gusts for sites across the region can be found within our Post Tropical Cyclone Reports page. |
||
Analysis with Point Values
 |
Analysis without Point Values
 |
|
| Please note, this Preliminary Wind Gust analysis may contain errors and not all data may be considered official. |
||
A zoomable wind gust analysis in a GIS format can be viewed at Hurricane Debby - NWS Field GIW/GIS Mutual Aid.