| Probabilistic Decision Support Forecast, Percentile, and Probability Graphics |
| These graphics are updated at least twice per day, shortly after 415 AM/415 PM. They can be magnified (enlarged) by left clicking on them, and resized back to original size with a second click. |
About
|
The probabilistic products are intended to provide a range of possibilities. This complements the existing NWS forecast in order to better communicate forecast uncertainties before and during weather events. For example, you may see your local forecast saying low temperature of 34°F. This is the official NWS forecast, but there is still uncertainty.
Click on an image below for an interpretation of the different types of graphics.
|
Expected High Temperature (°F)
These maps are the official NWS high temperature forecast in degrees Fahrenheit during the time period shown on the graphic. These high temperatures are determined by NWS forecasters to be the most likely outcome based on evaluation of data from computer models, satellite, radar, and other observations.
Day 1 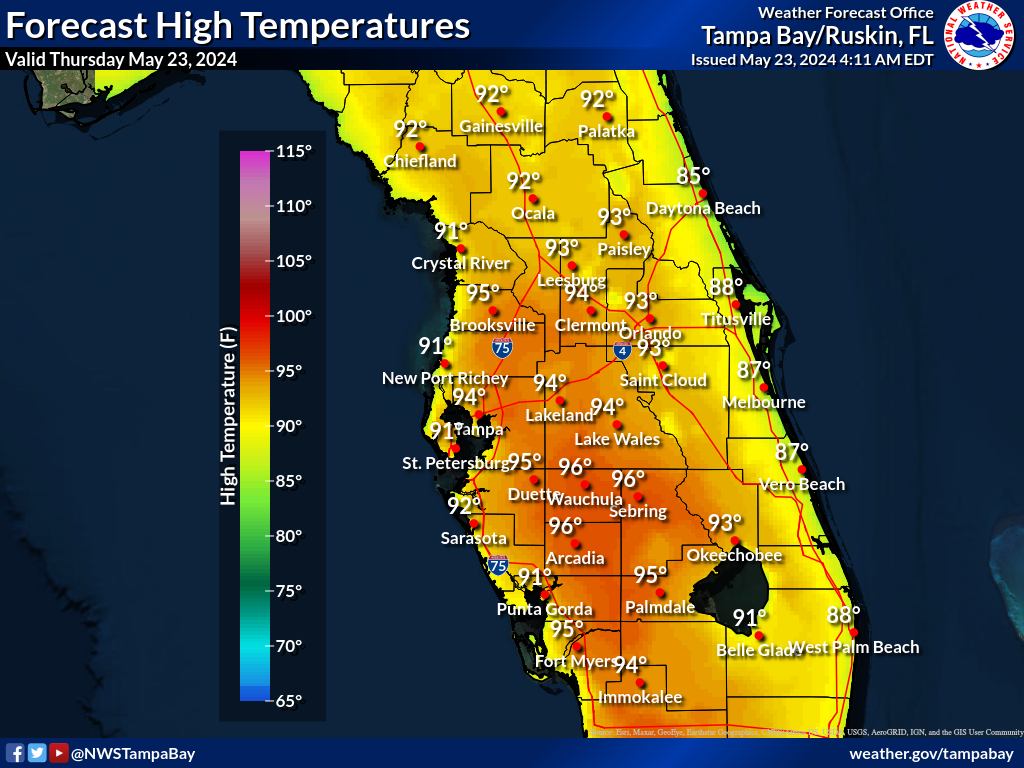 |
Day 2 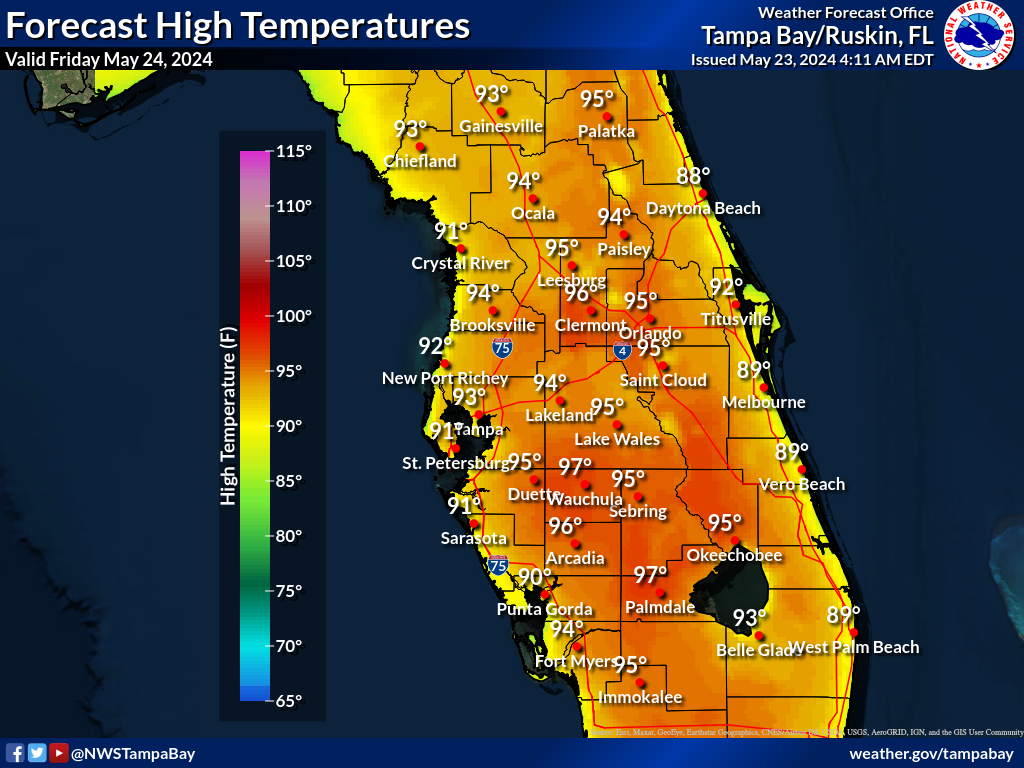 |
Day 3 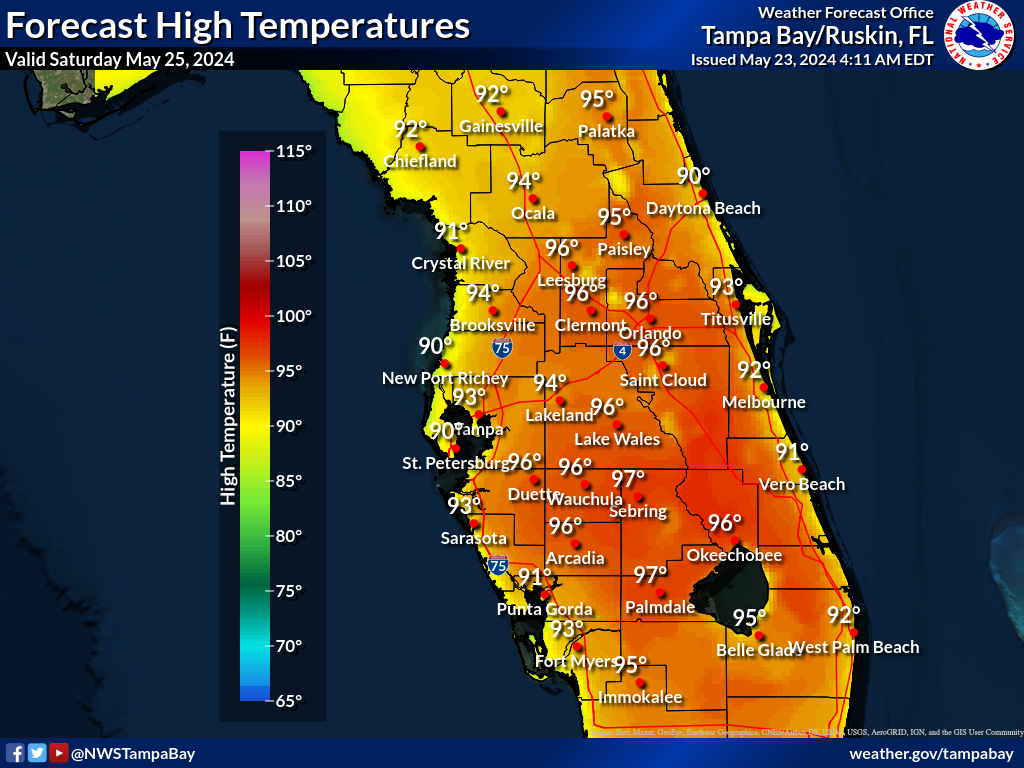 |
Day 4 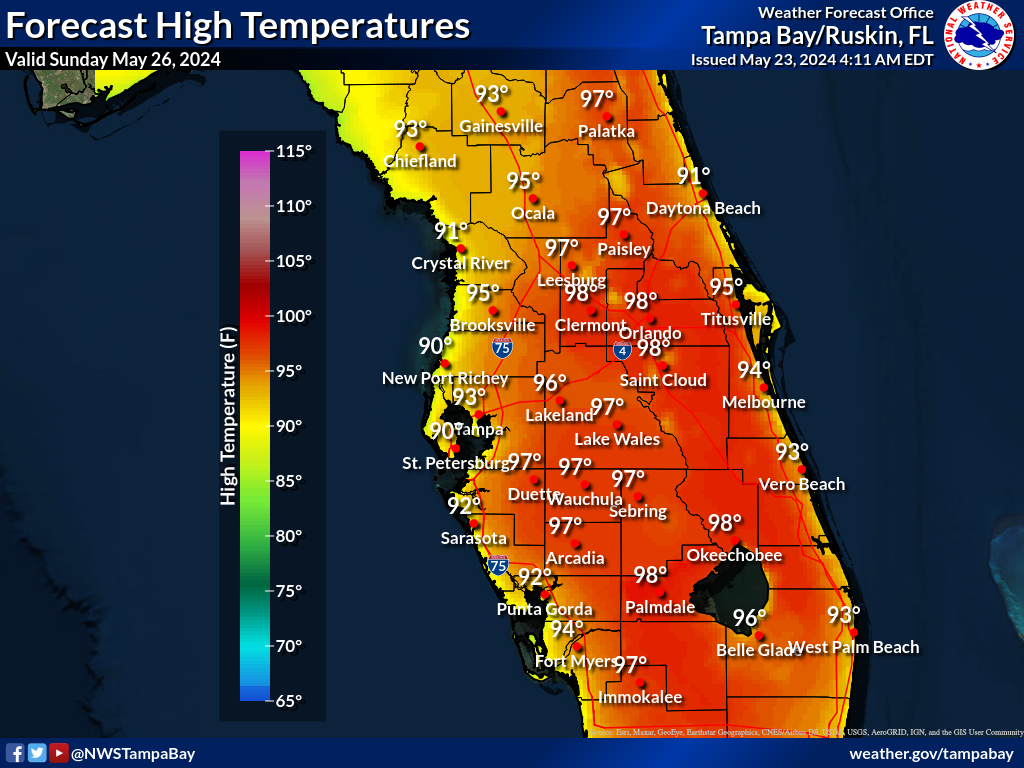 |
Day 5 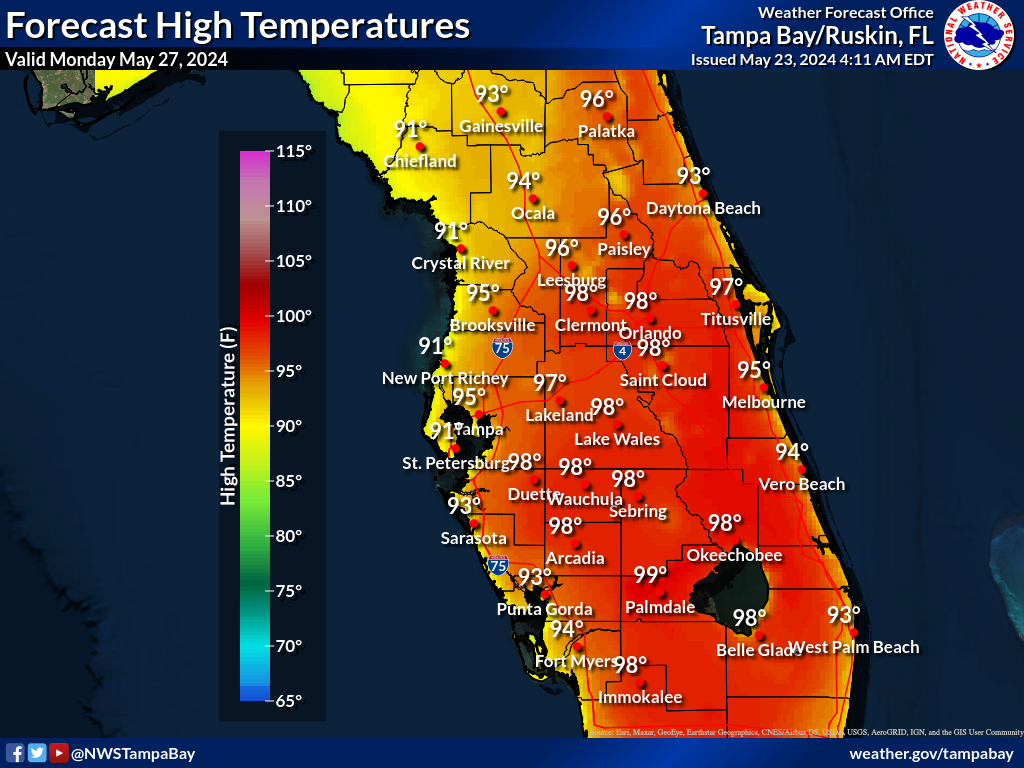 |
Day 6 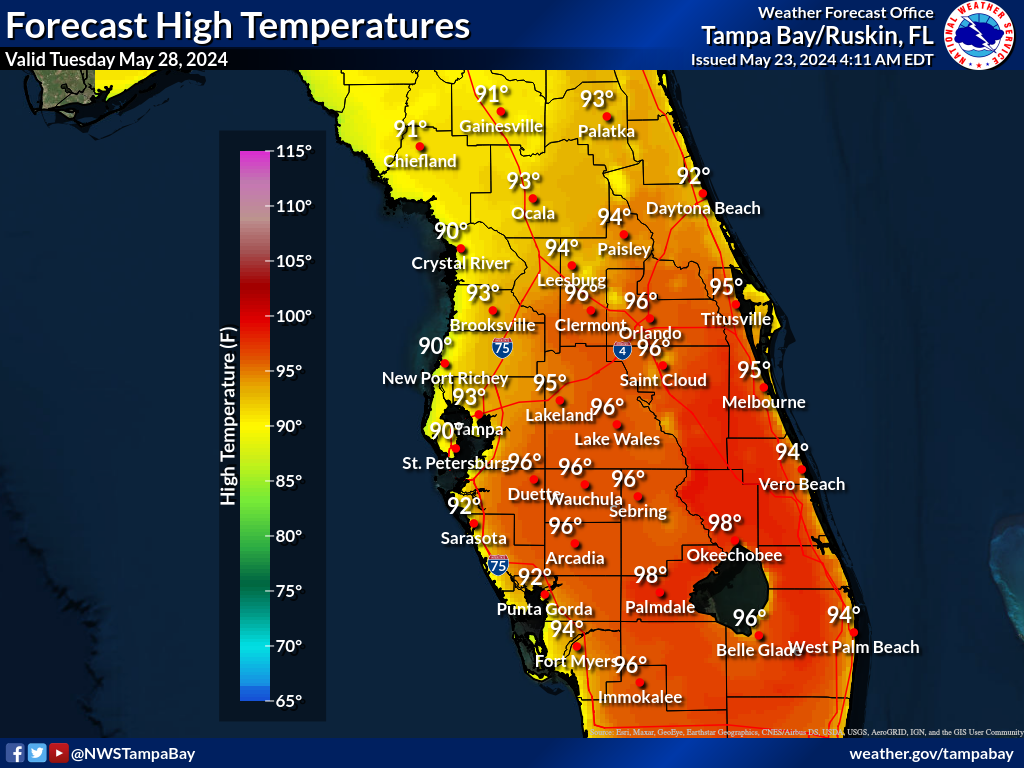 |
Day 7 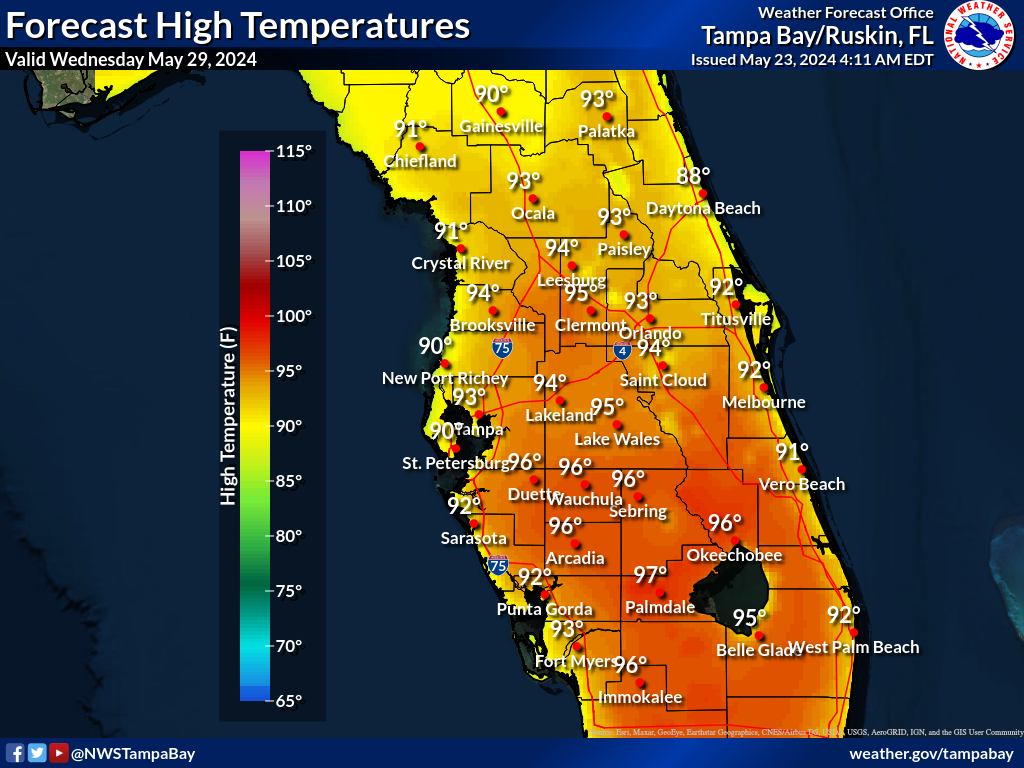 |
Warmest Possible High Temperature (°F)
These maps depict a reasonable upper-end high temperature for the time period shown on the graphic, based on many computer model simulations of possible high temperatures. These higher temperatures are an unlikely scenario, with only a 1 in 10, or 10% chance that a temperature higher than this will occur, and a 9 in 10, or 90% chance that the temperatures will be lower. These temperatures can help serve as an upper-end scenario for planning purposes.
Day 1 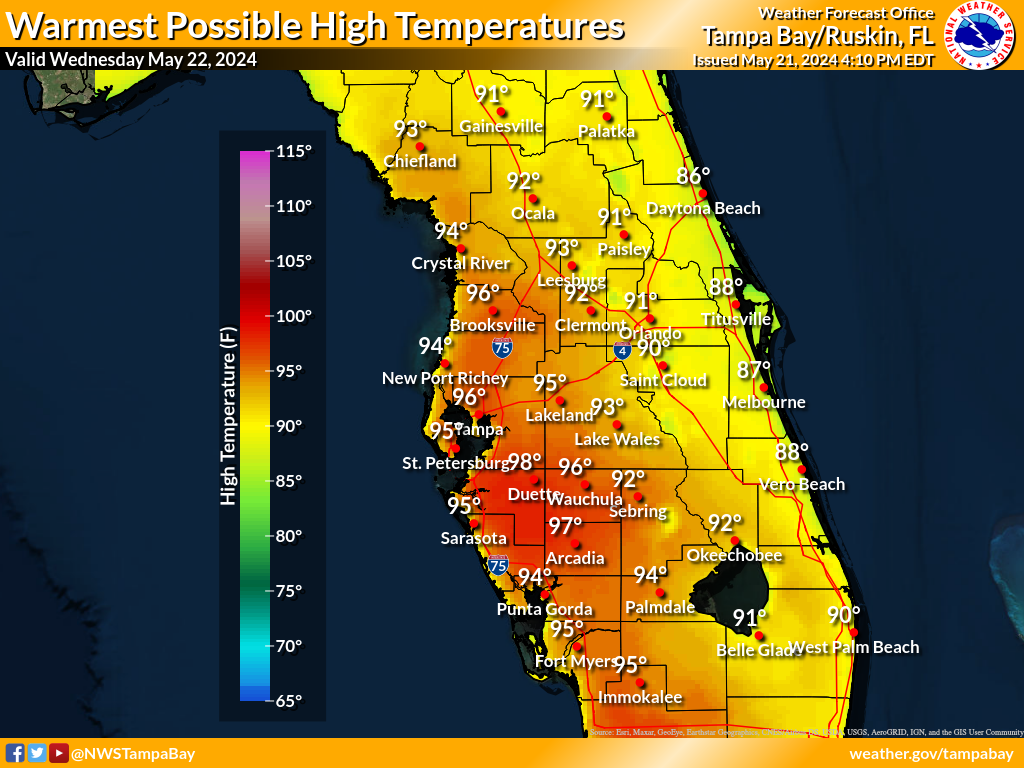 |
Day 2 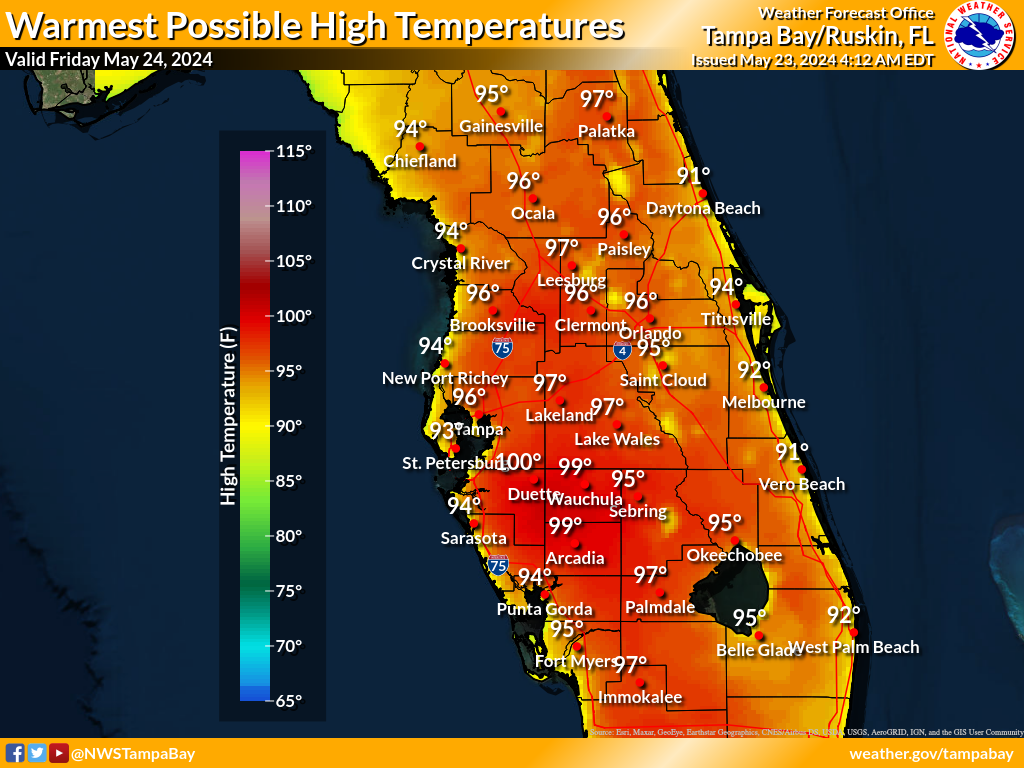 |
Day 3 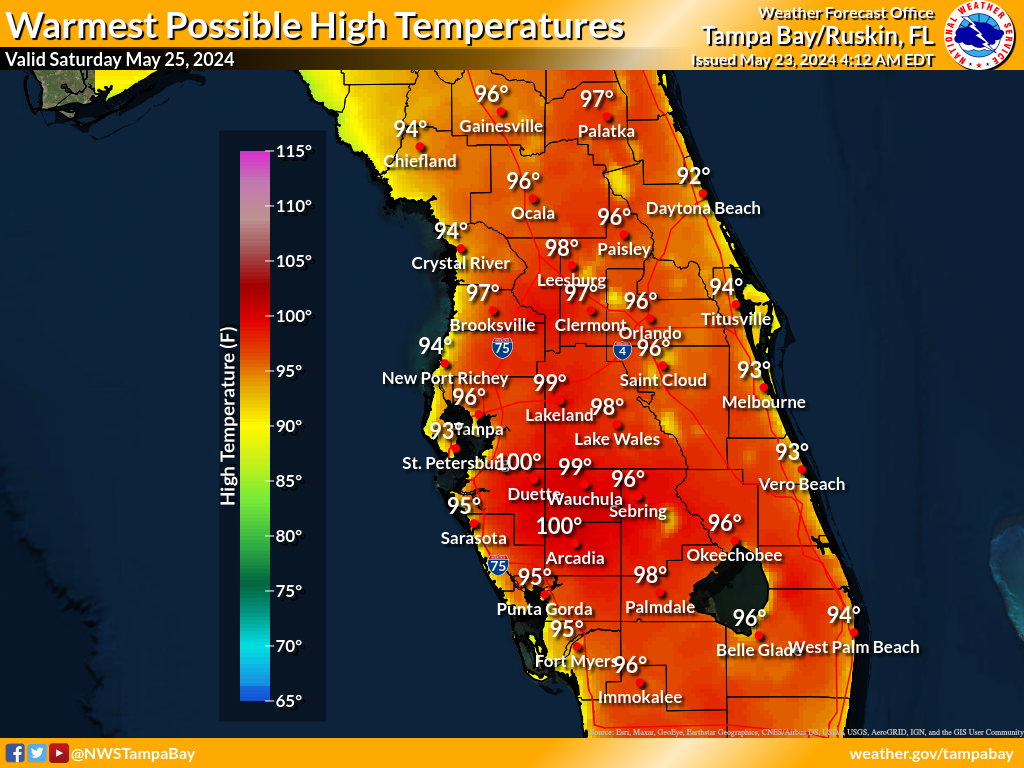 |
Day 4 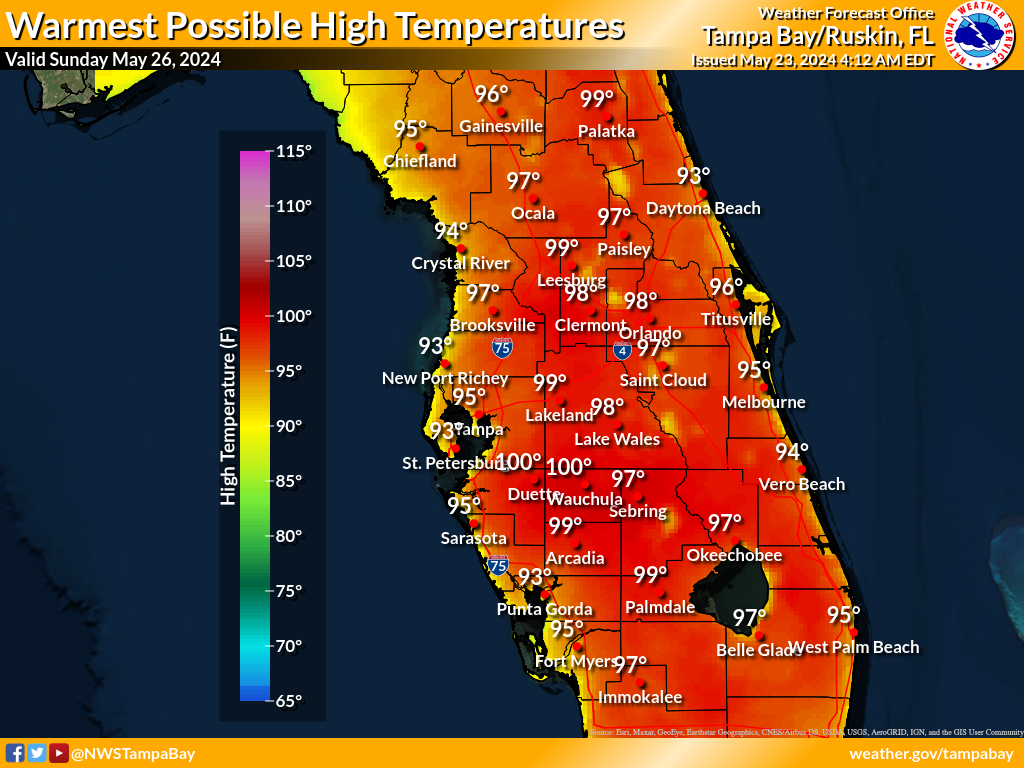 |
Day 5 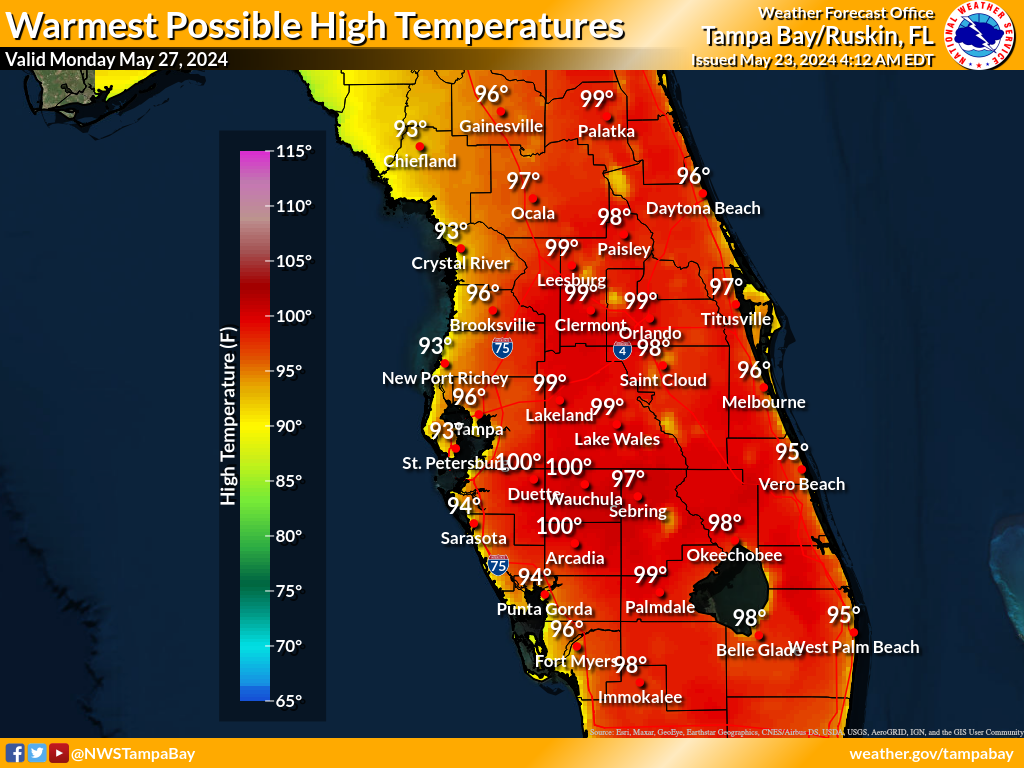 |
Day 6 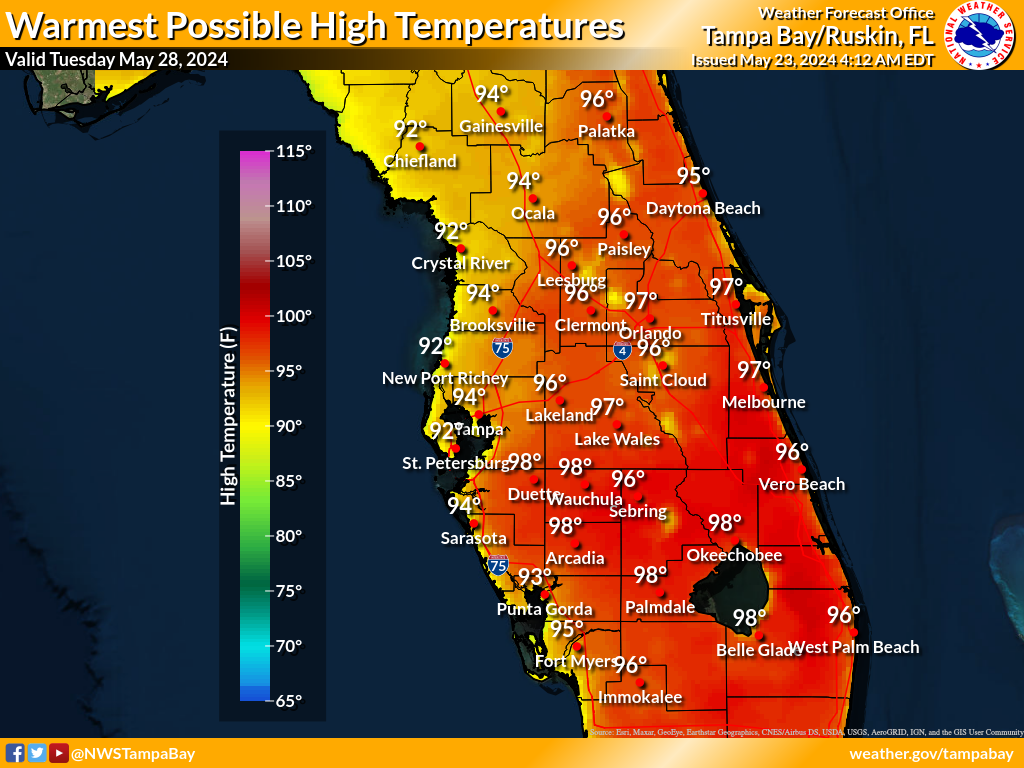 |
Day 7 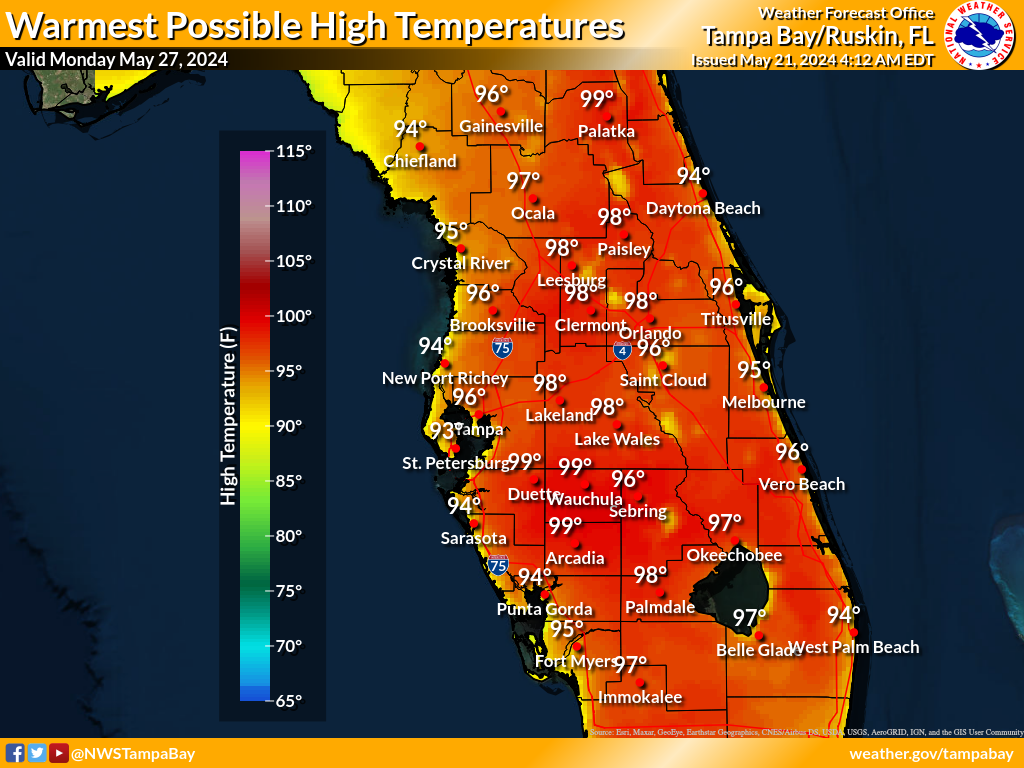 |
Coolest Possible High Temperature (°F)
These maps depict a reasonable lower-end high temperature for the time period shown on the graphic, based on many computer model simulations of possible high temperatures. These lower temperatures are an unlikely scenario, with a 9 in 10, or 90% chance that a higher temperature will occur, and only a 1 in 10, or 10% chance that the temperatures will be lower. These temperatures can help serve as a lower-end scenario for planning purposes.
Day 1 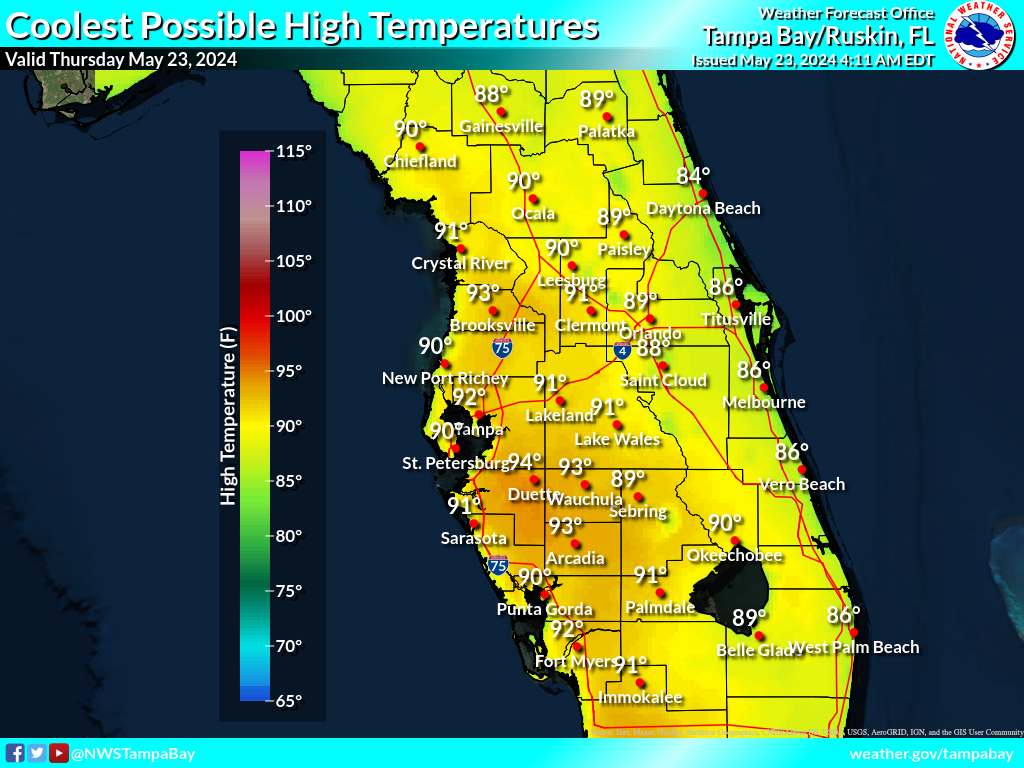 |
Day 2 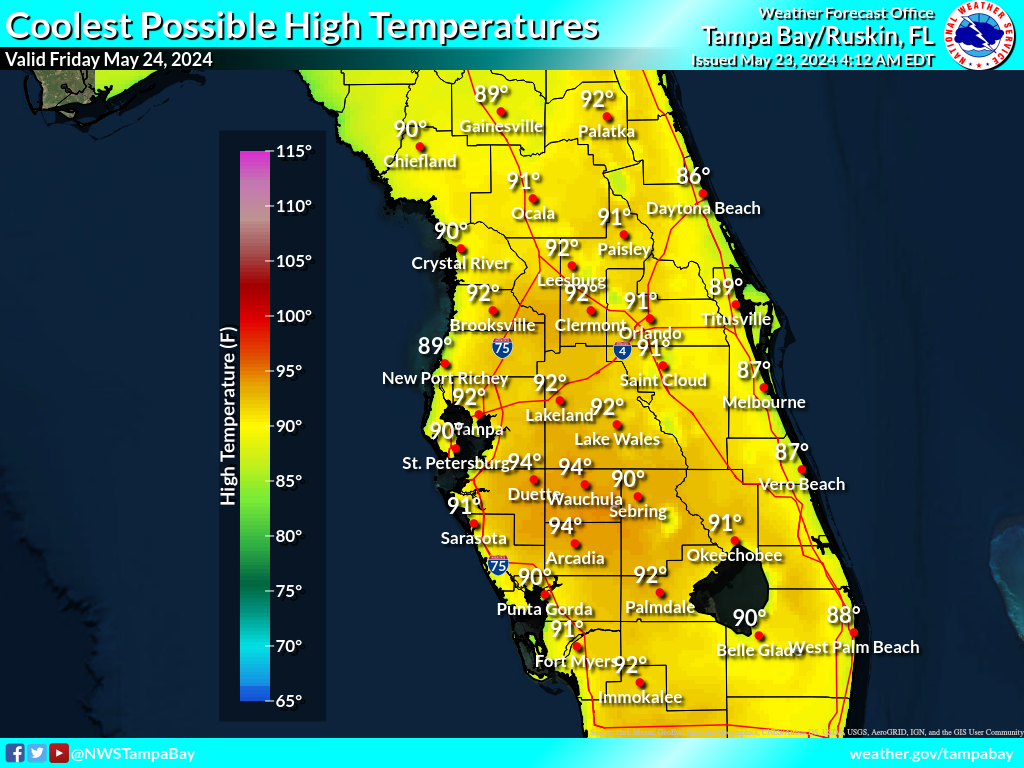 |
Day 3 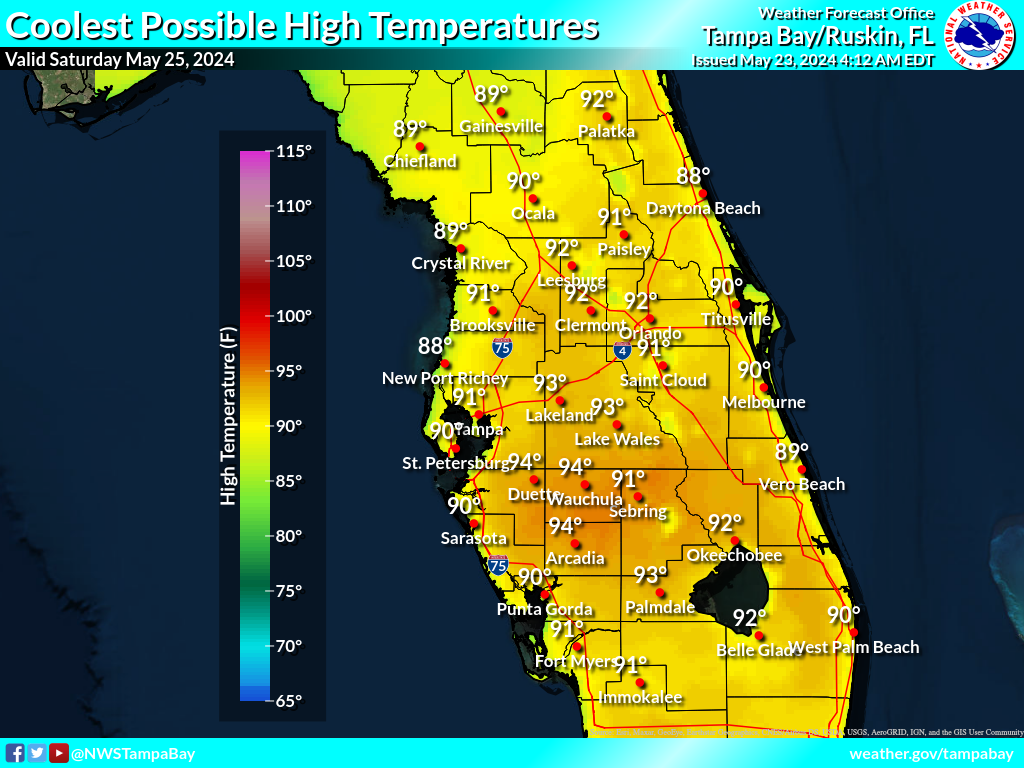 |
Day 4 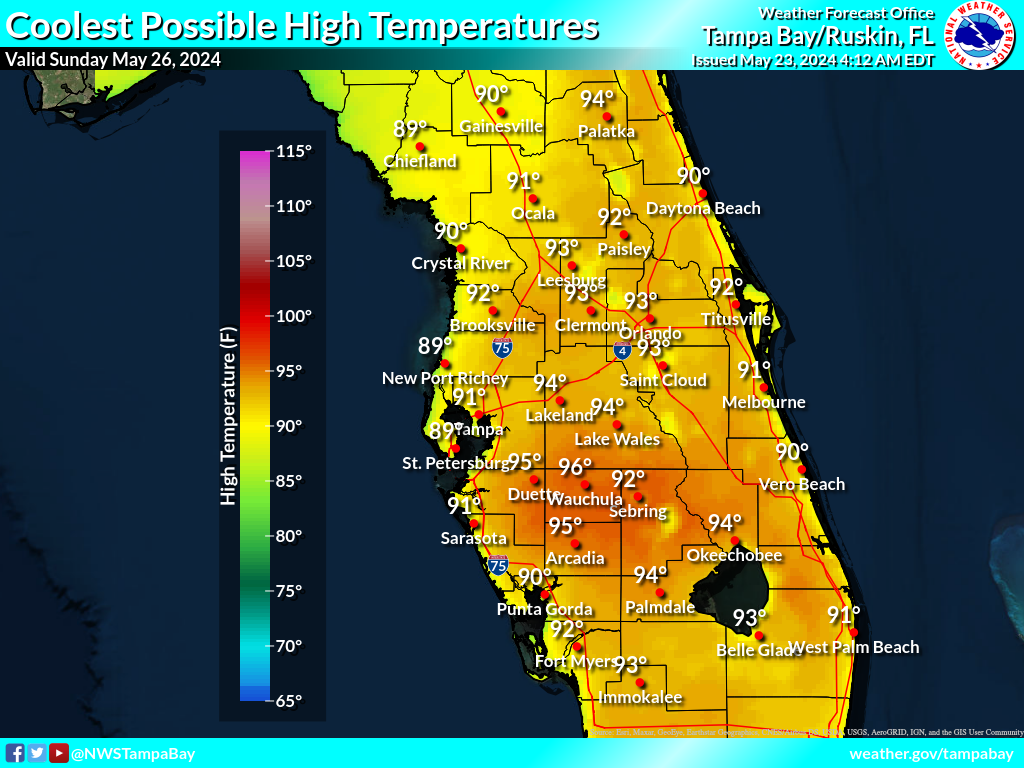 |
Day 5 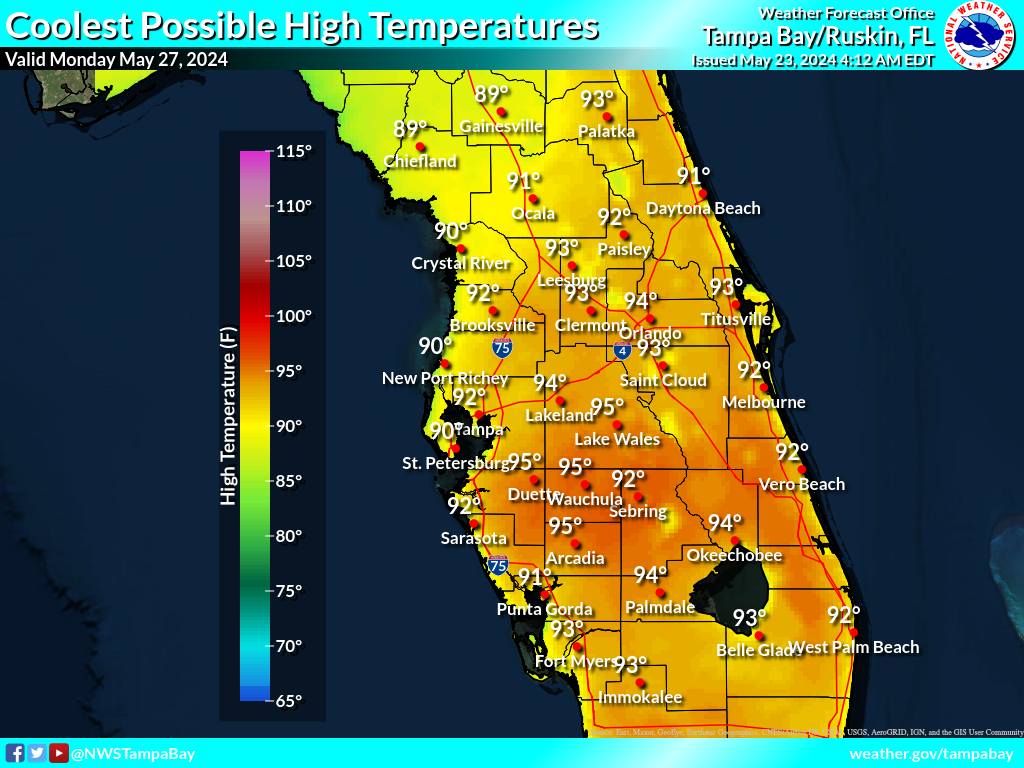 |
Day 6 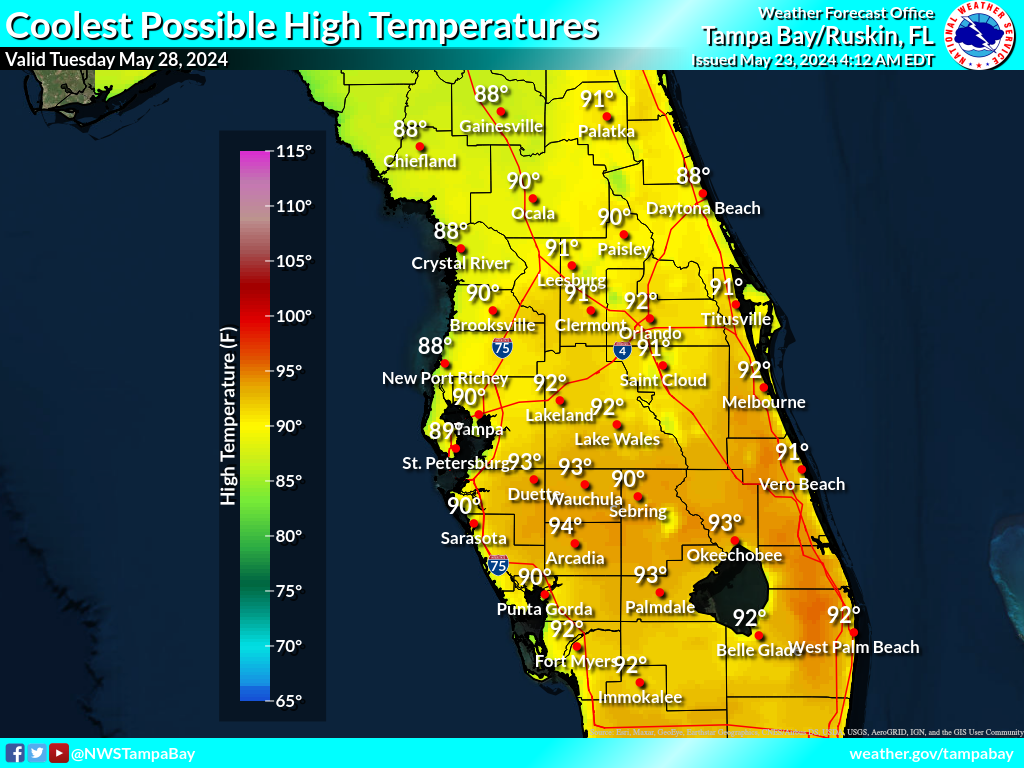 |
Day 7 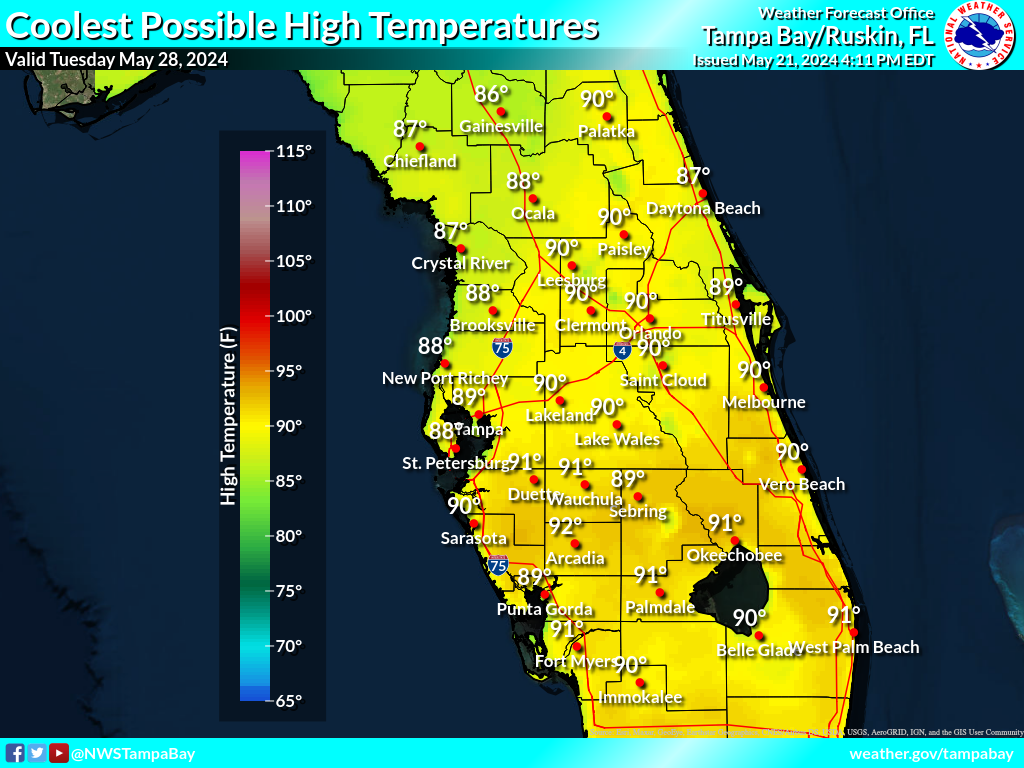 |
Expected Low Temperature (°F)
These maps are the official NWS low temperature forecast in degrees Fahrenheit during the time period shown on the graphic. These low temperatures are determined by NWS forecasters to be the most likely outcome based on evaluation of data from computer models, satellite, radar, and other observations.
Night 1 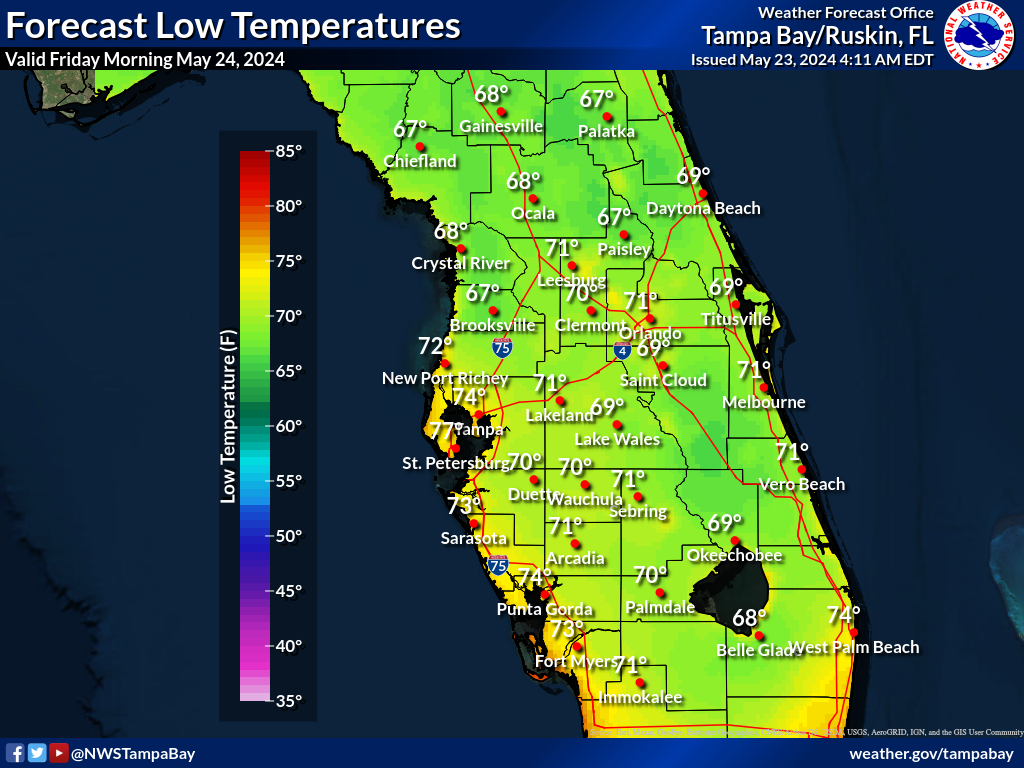 |
Night 2 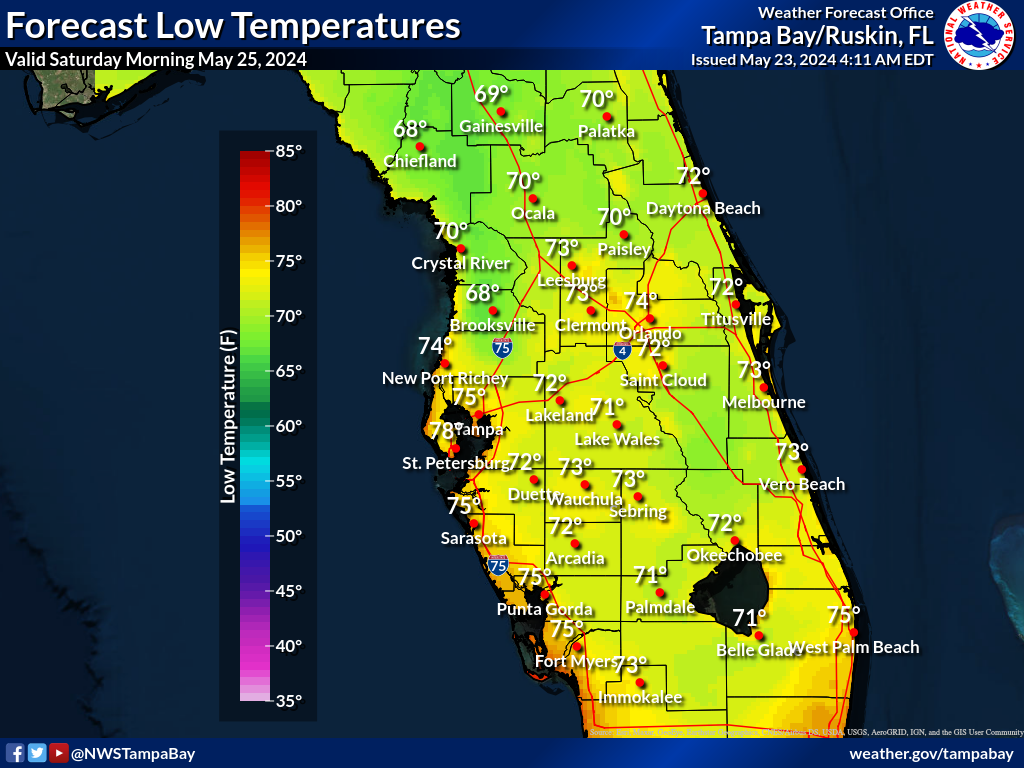 |
Night 3 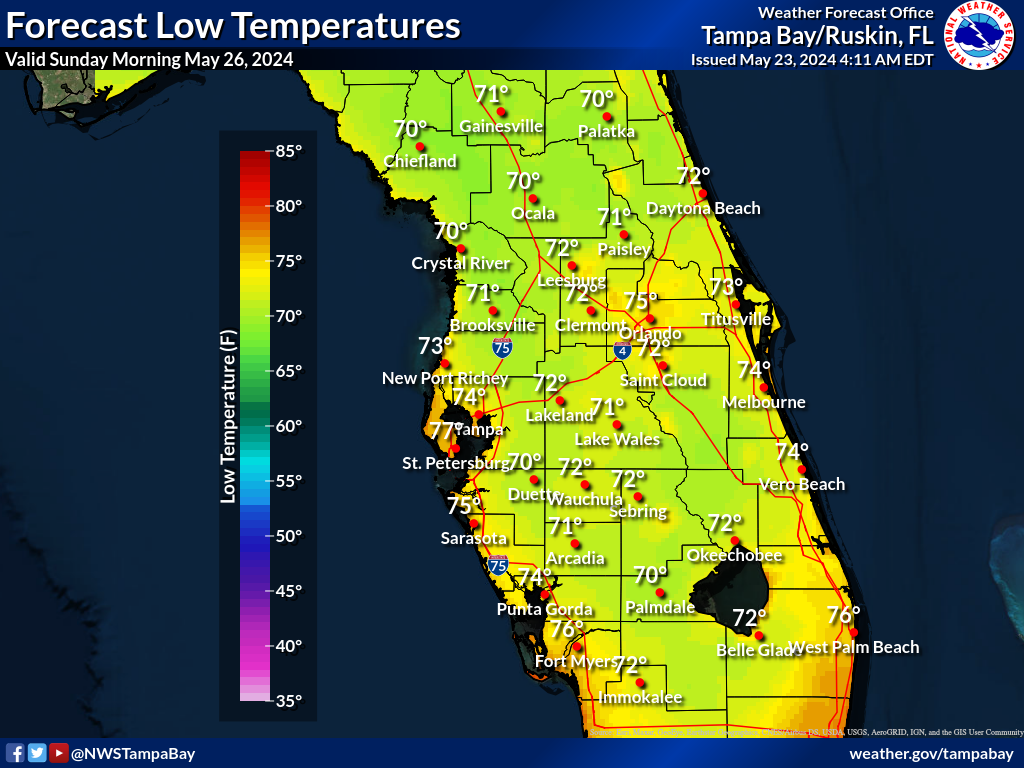 |
Night 4 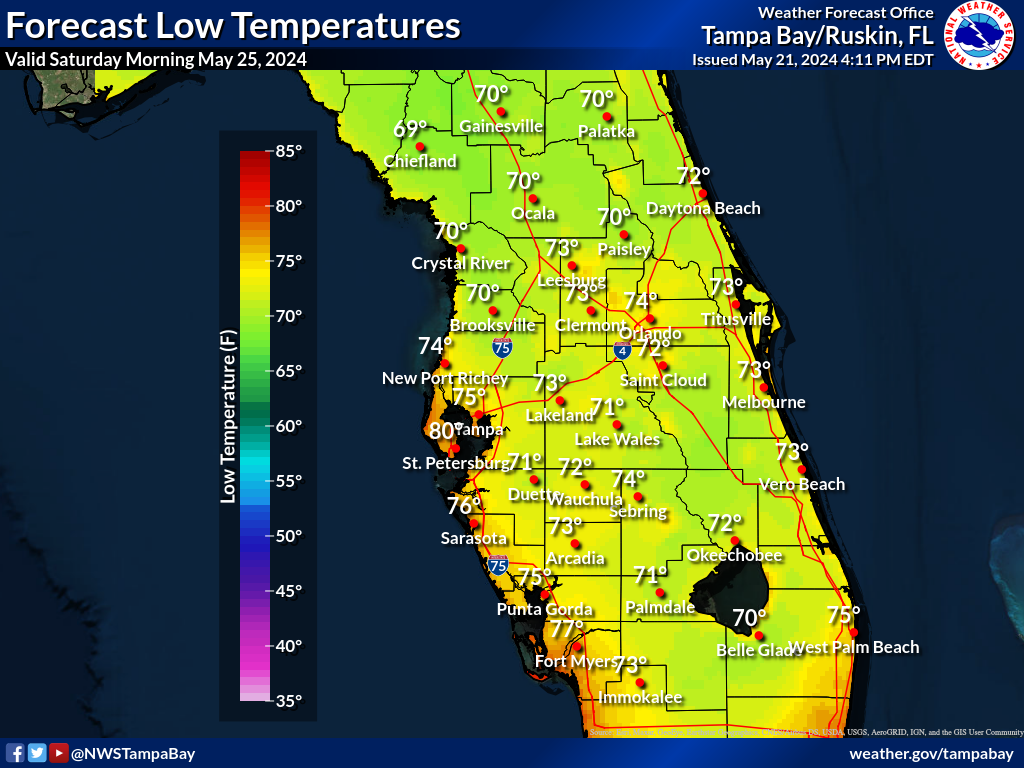 |
Night 5 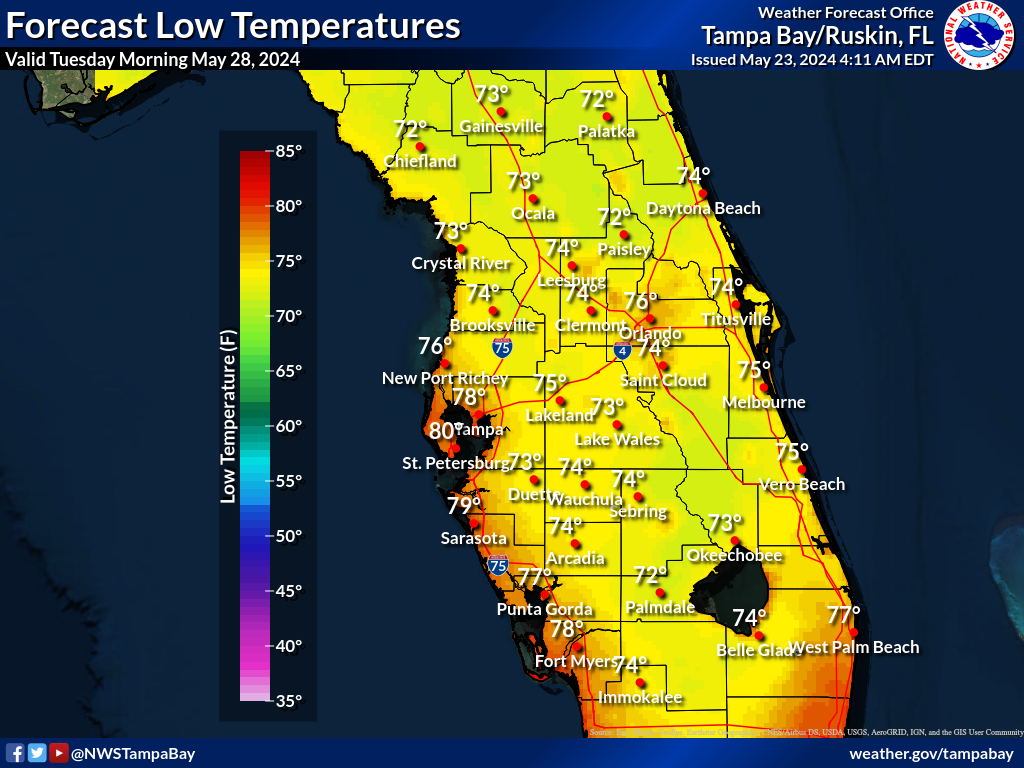 |
Night 6 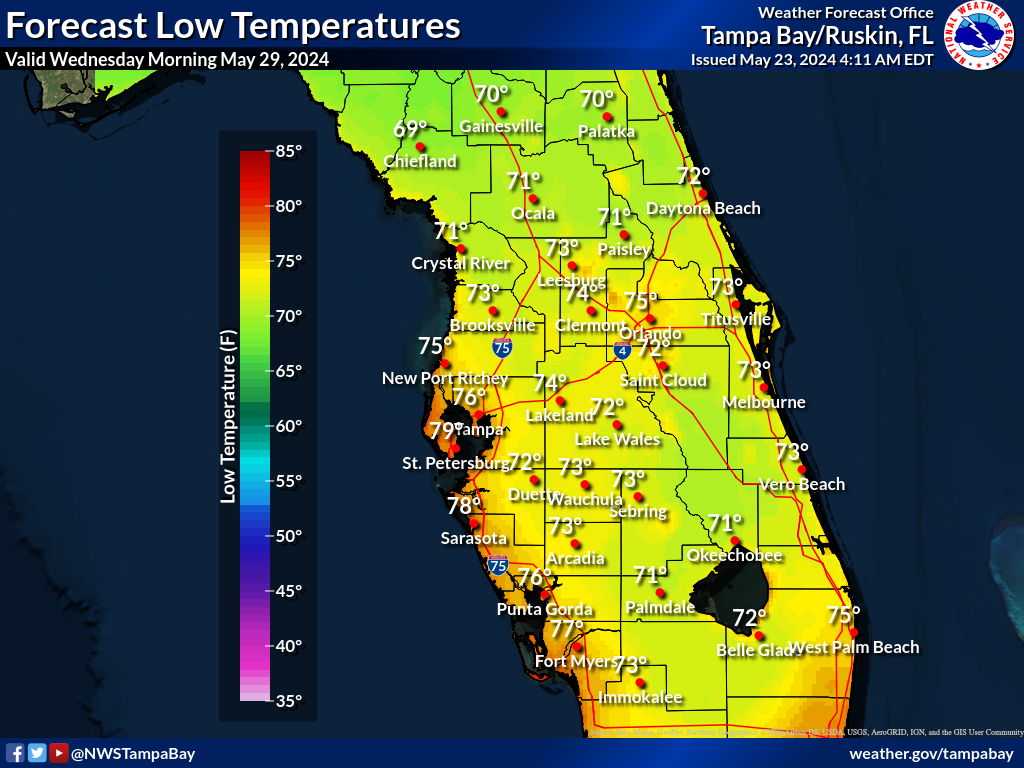 |
Night 7 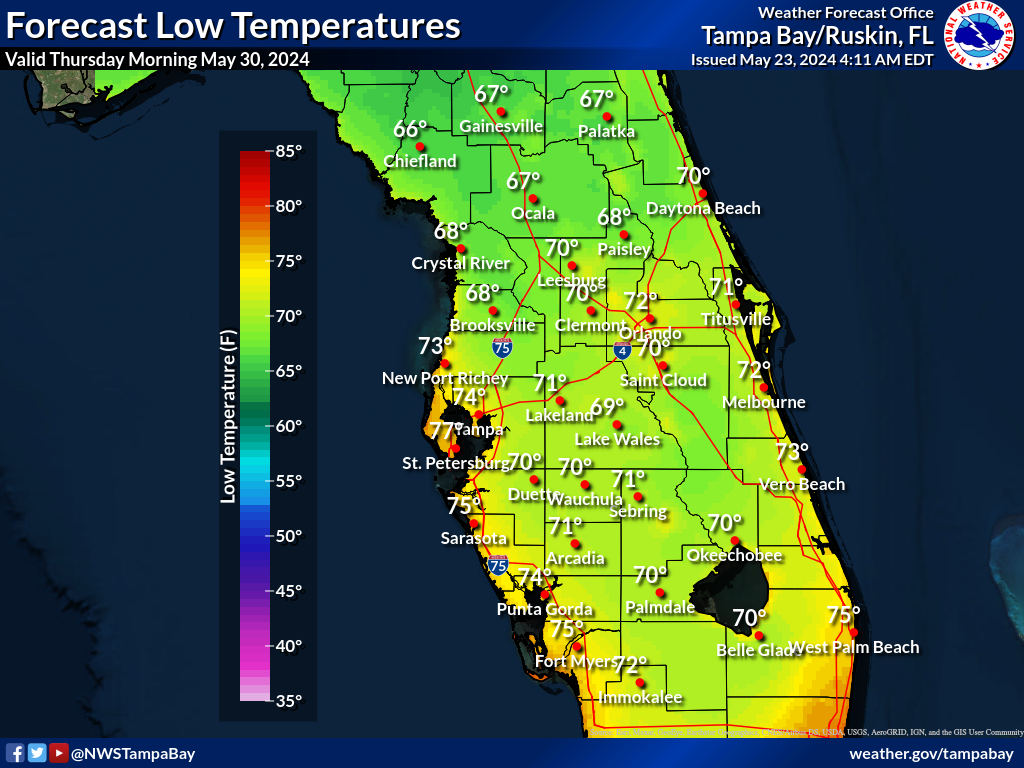 |
Warmest Possible Low Temperature (°F)
These maps depict a reasonable upper-end low temperature for the time period shown on the graphic, based on many computer model simulations of possible low temperatures. These higher temperatures are an unlikely scenario, with only a 1 in 10, or 10% chance that a temperature higher than this will occur, and a 9 in 10, or 90% chance that the temperatures will be lower. These temperatures can help serve as an upper-end scenario for planning purposes.
Night 1 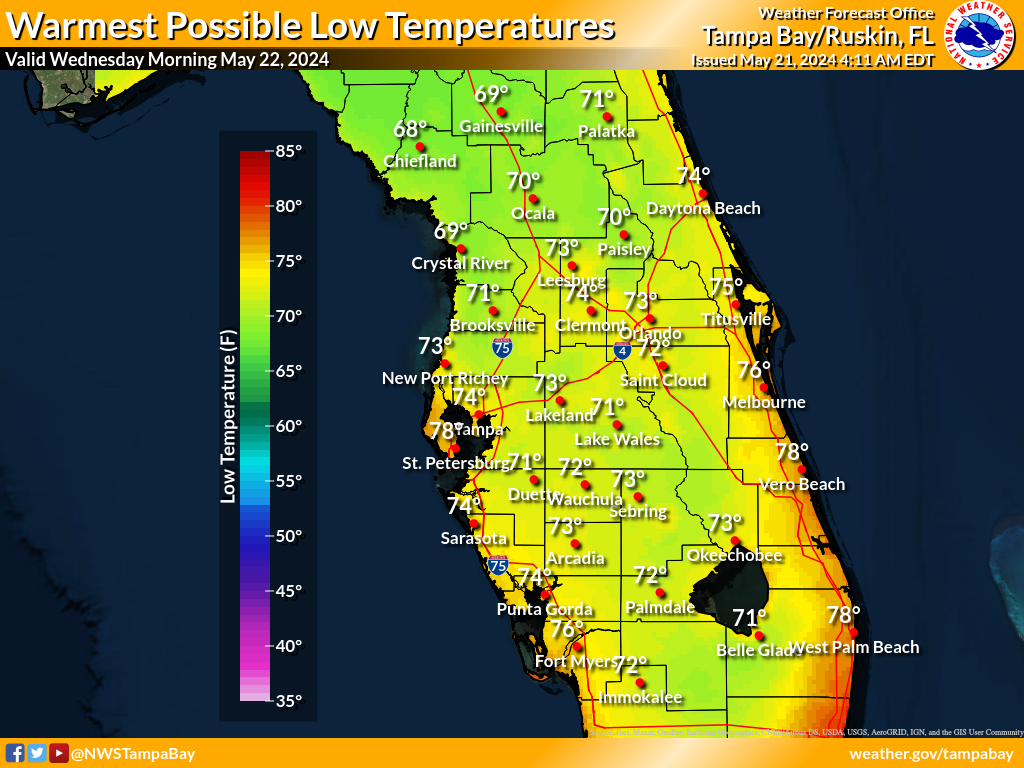 |
Night 2 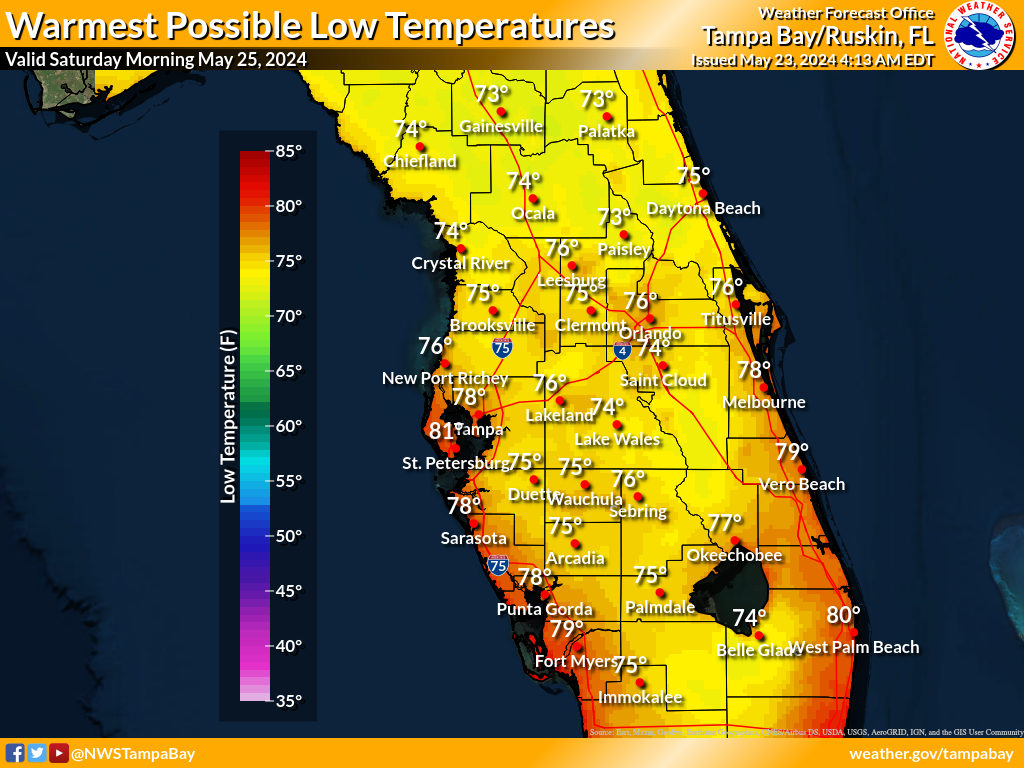 |
Night 3 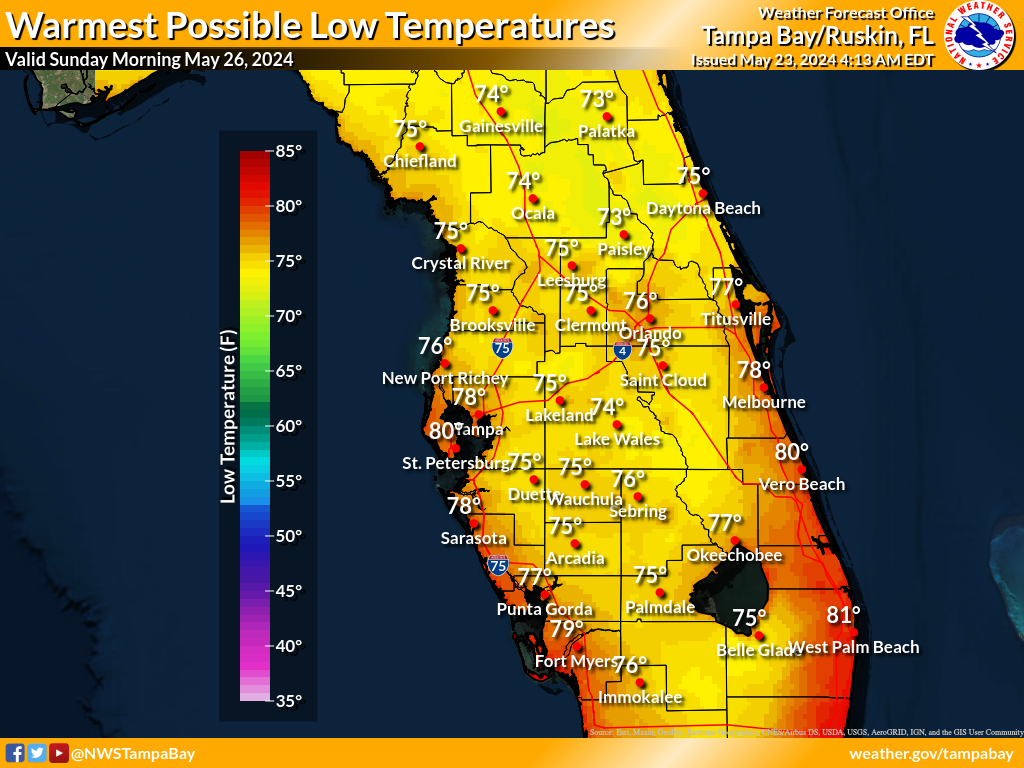 |
Night 4 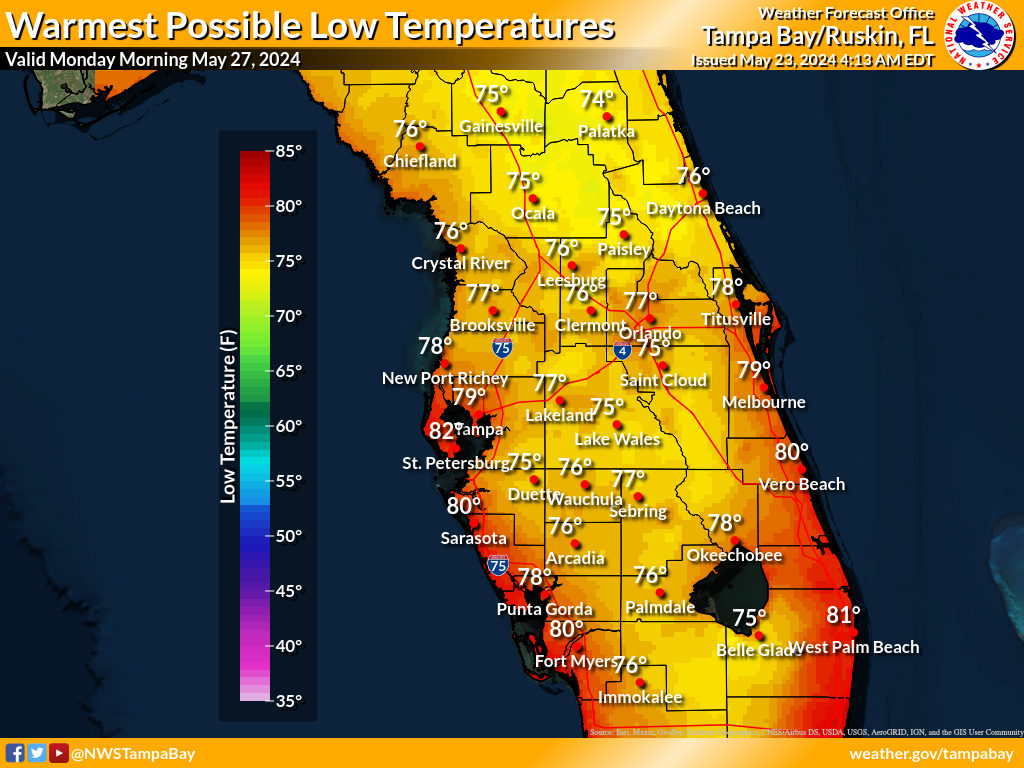 |
Night 5 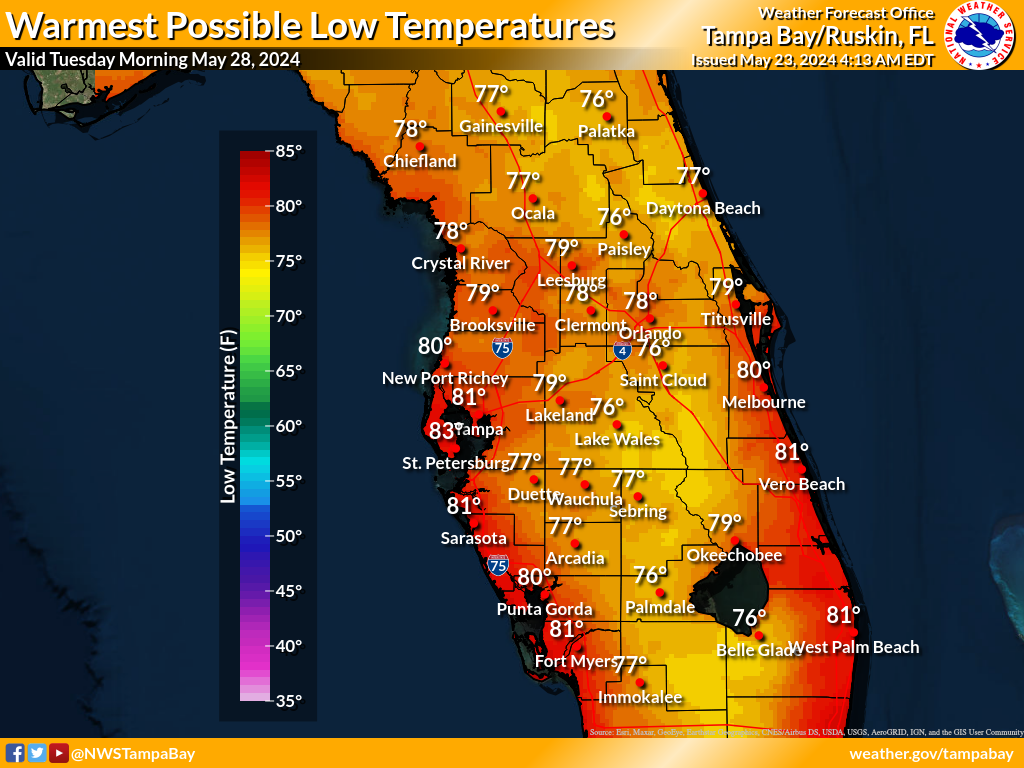 |
Night 6 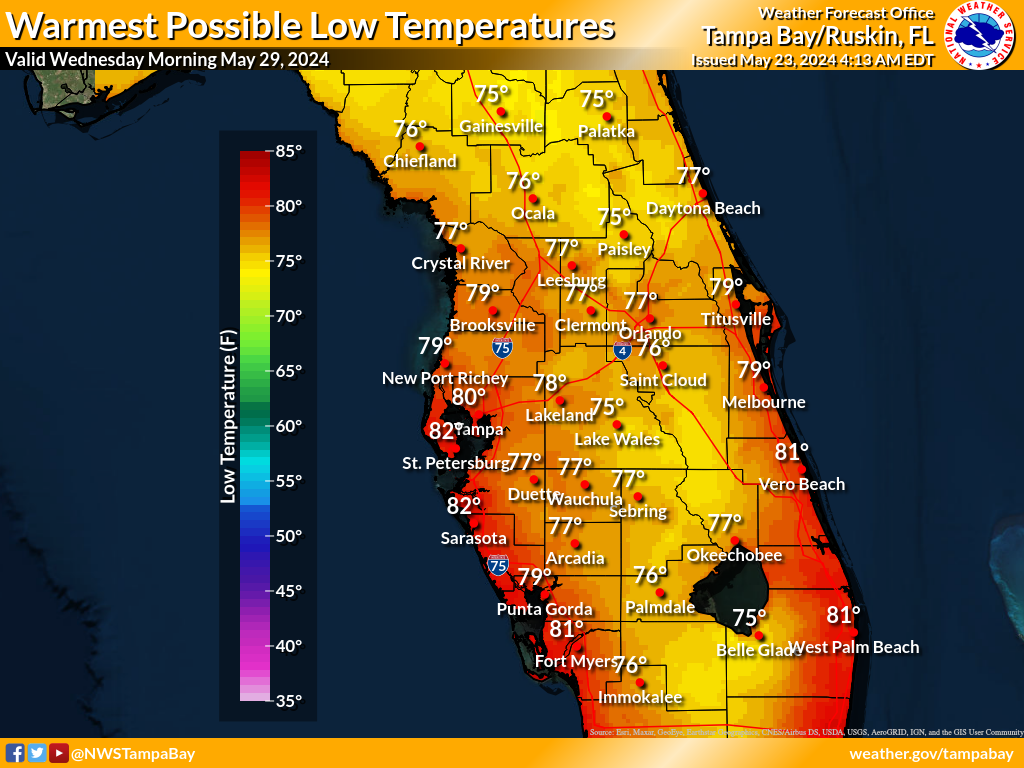 |
Night 7 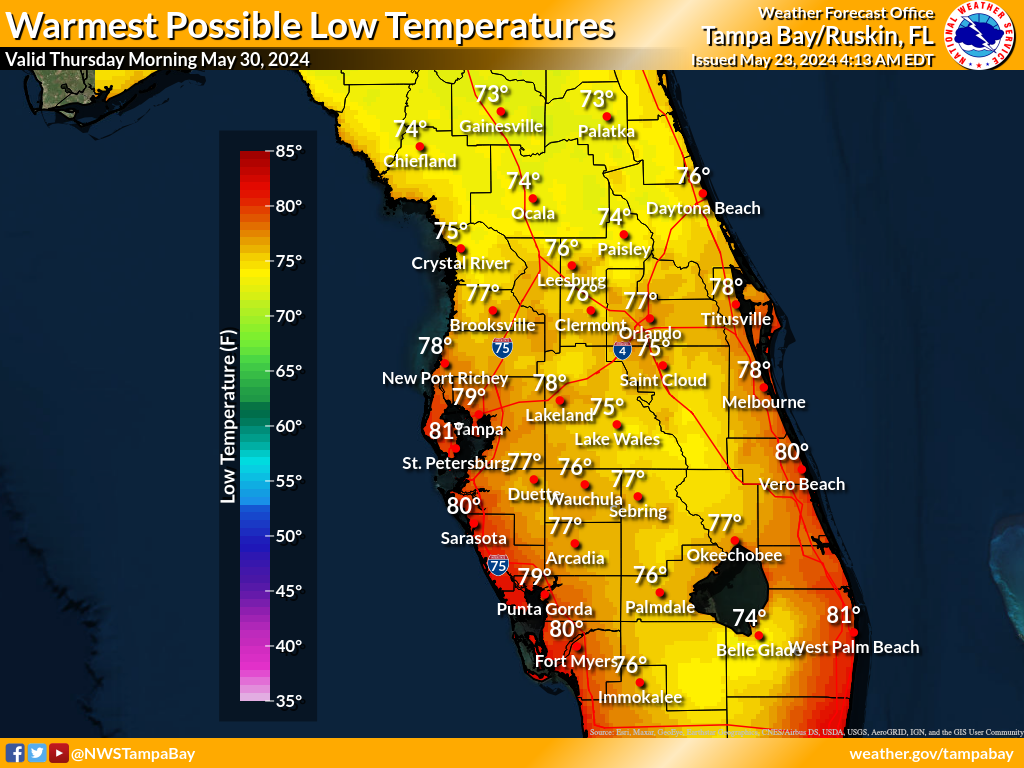 |
Coolest Possible Low Temperature (°F)
These maps depict a reasonable lower-end low temperature for the time period shown on the graphic, based on many computer model simulations of possible low temperatures. These lower temperatures are an unlikely scenario, with a 9 in 10, or 90% chance that a higher temperature will occur, and only a 1 in 10, or 10% chance that the temperatures will be lower. These temperatures can help serve as a lower-end scenario for planning purposes.
Night 1 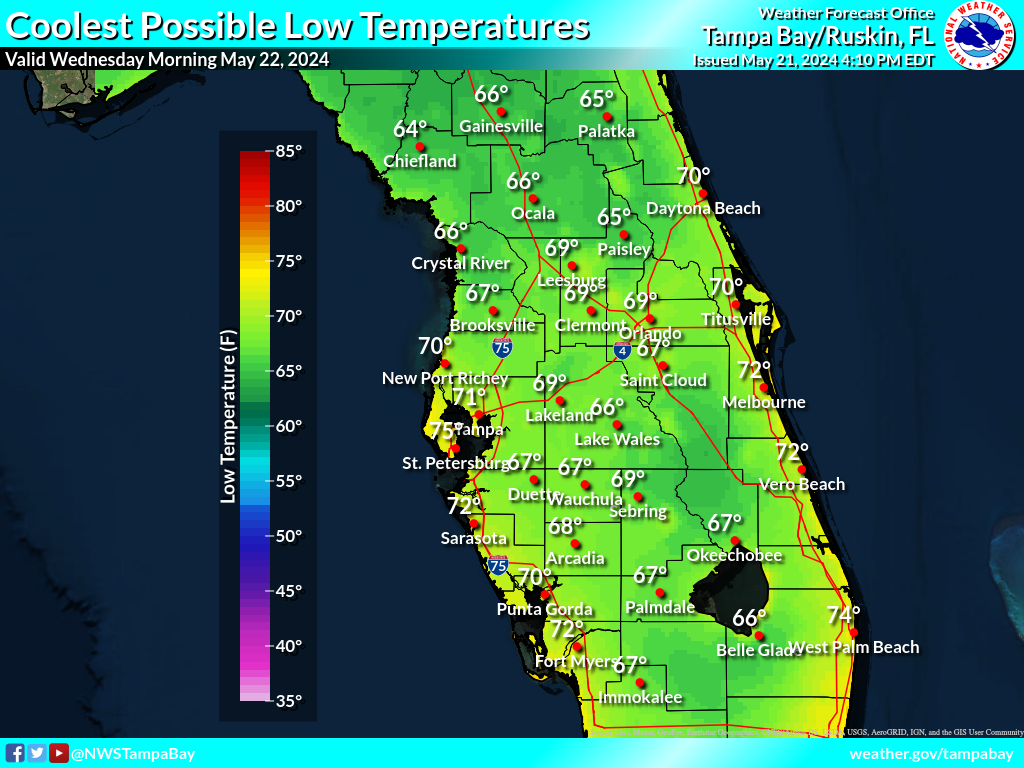 |
Night 2 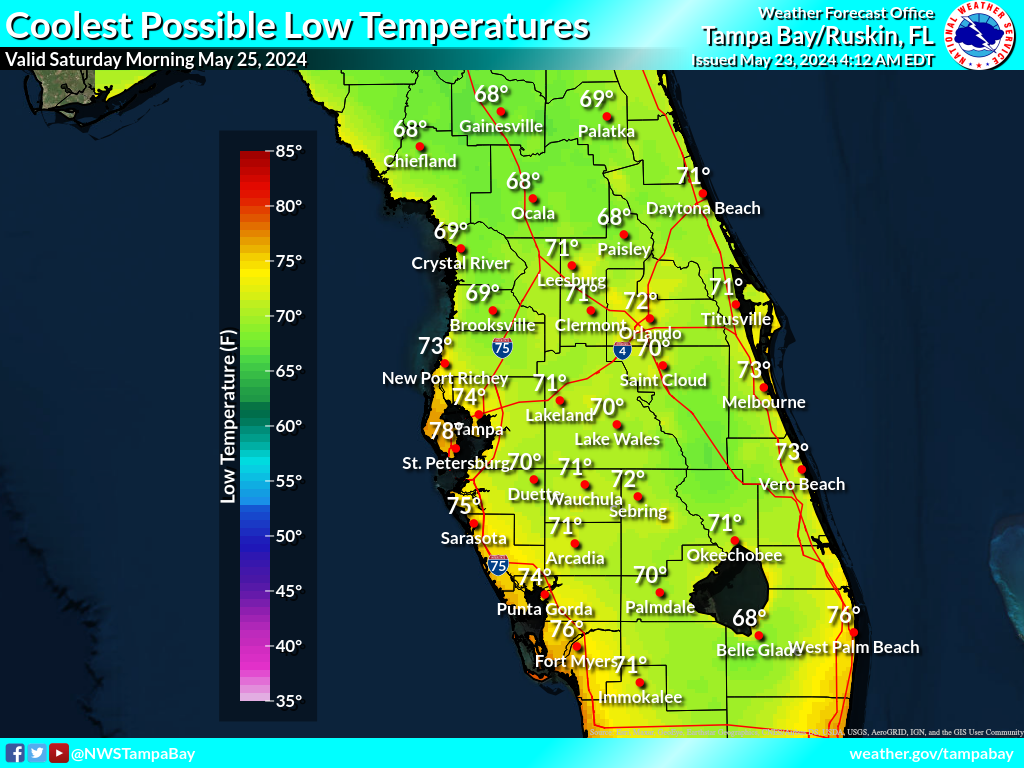 |
Night 3 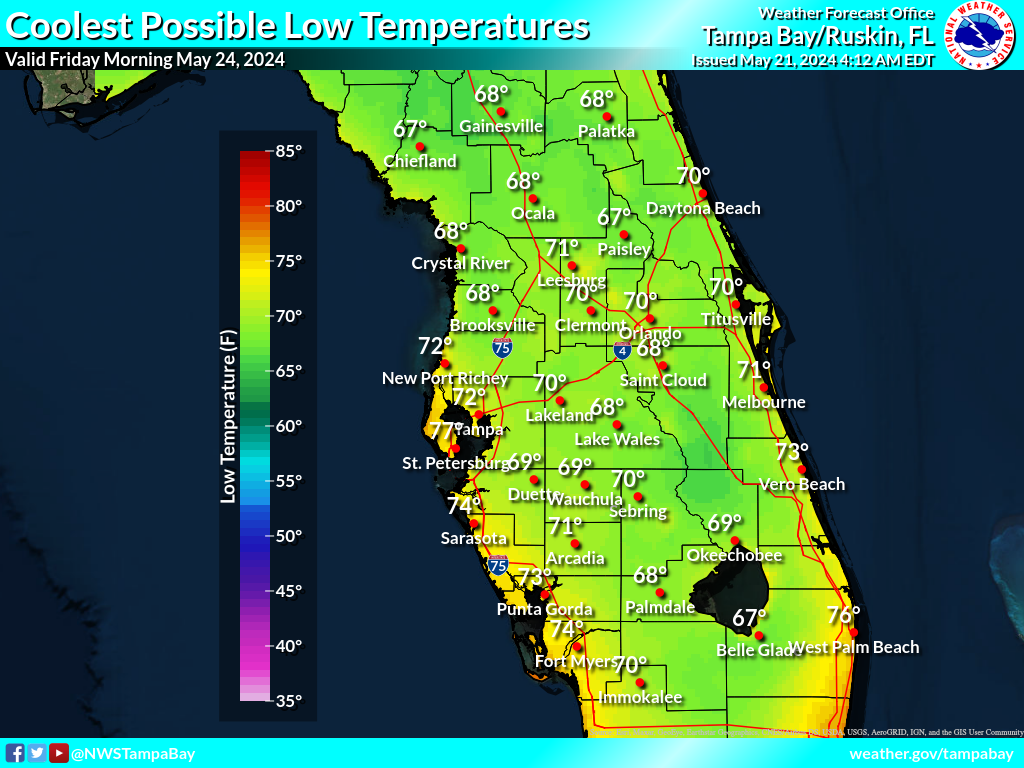 |
Night 4 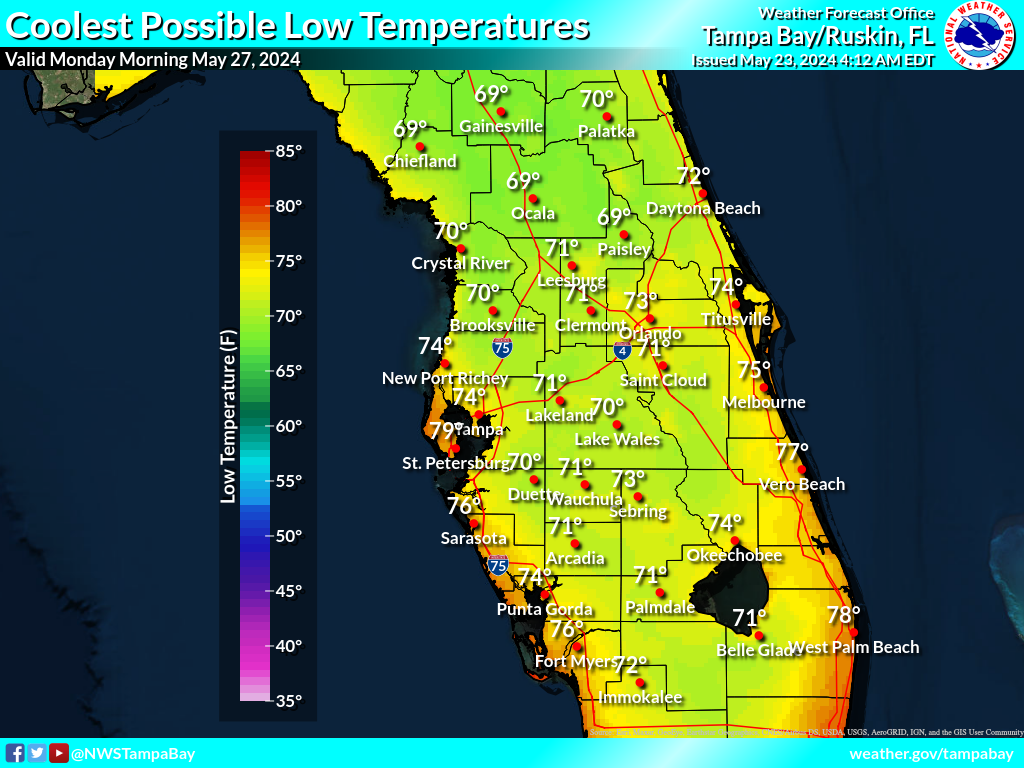 |
Night 5 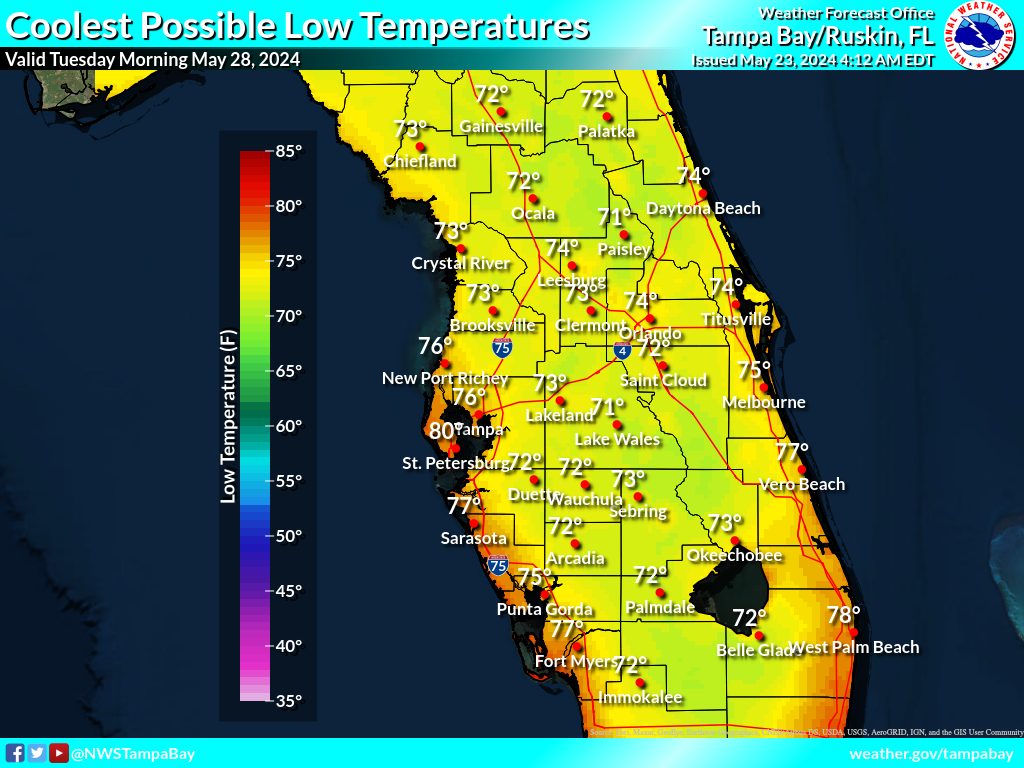 |
Night 6 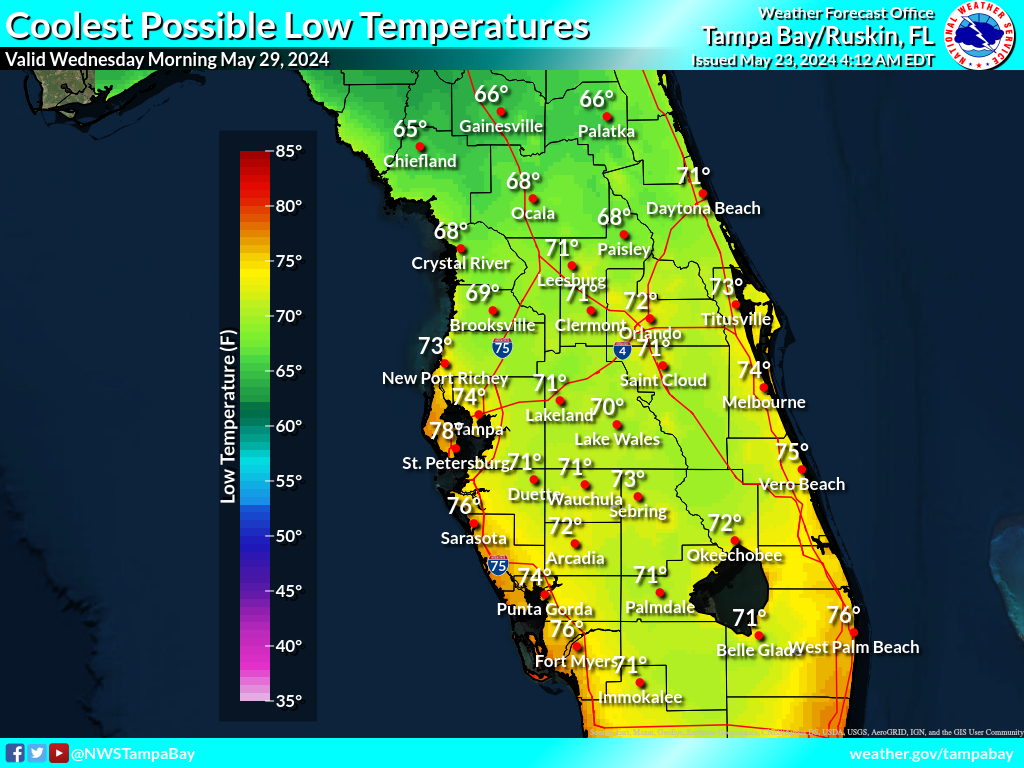 |
Night 7 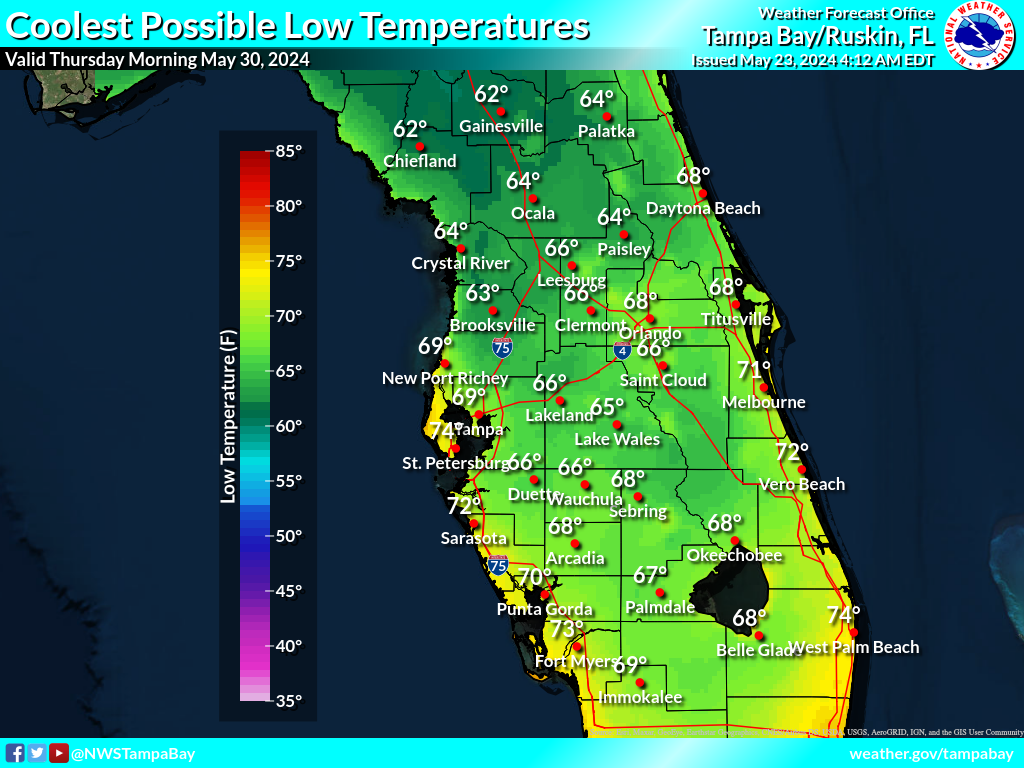 |
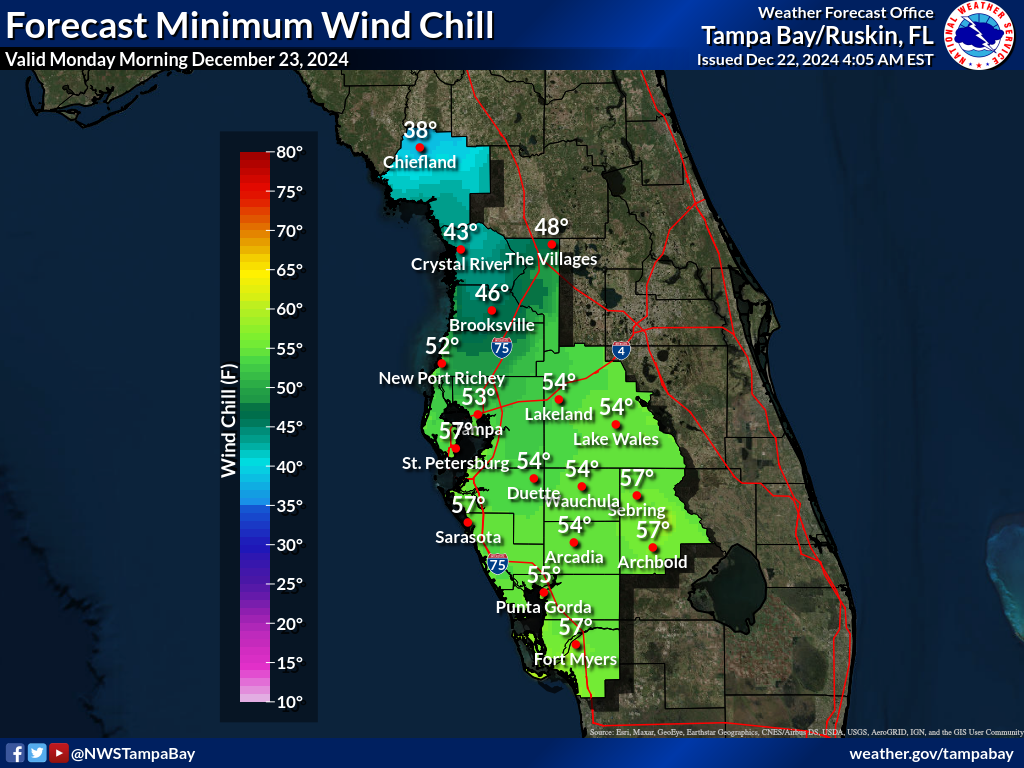
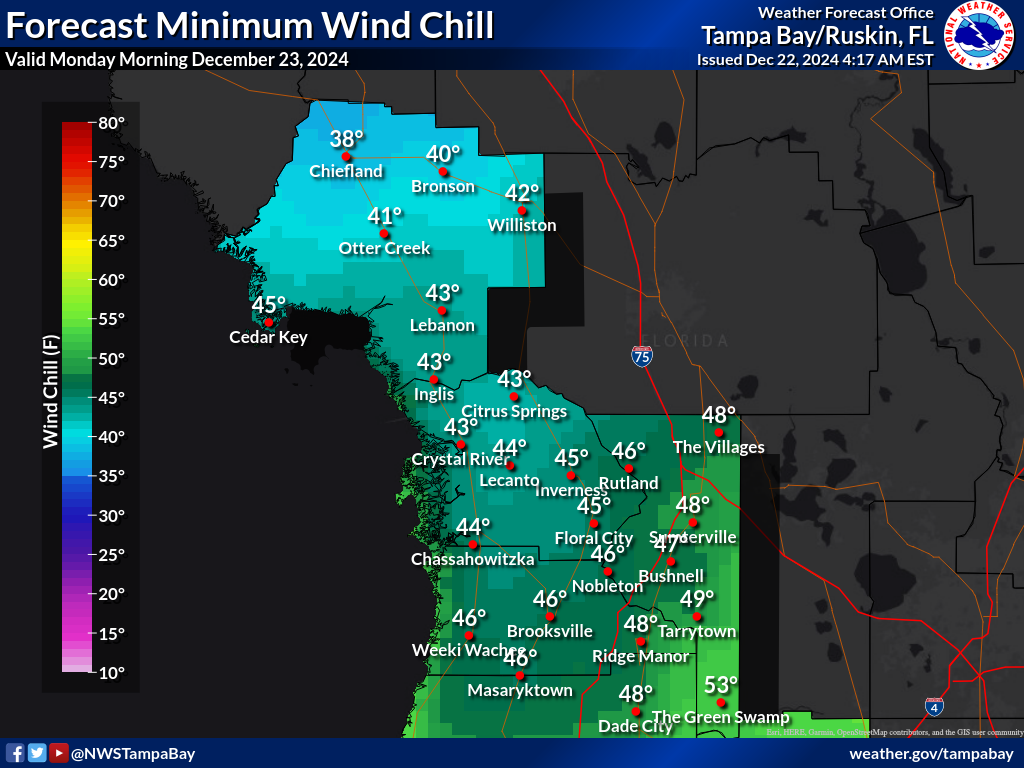
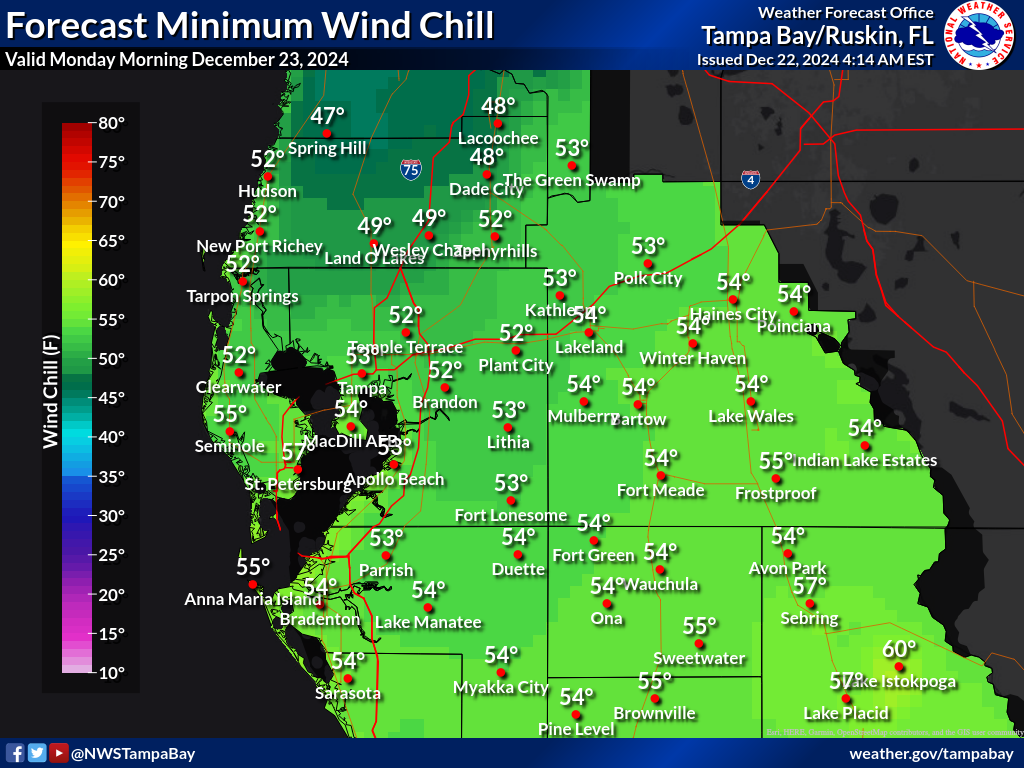
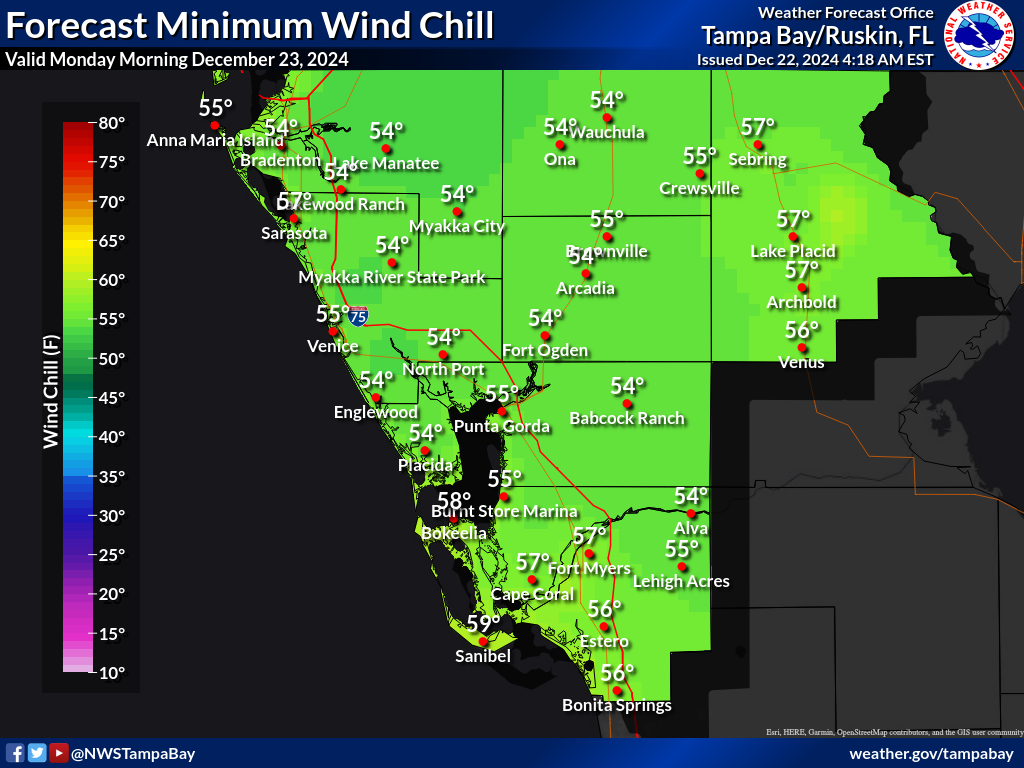
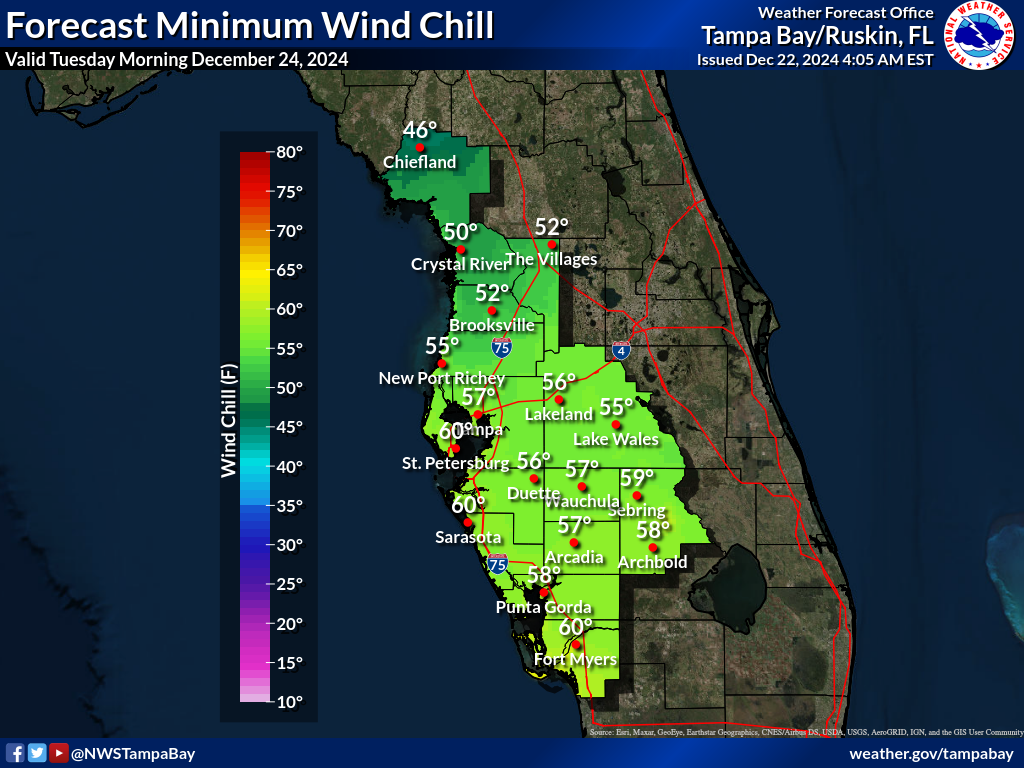
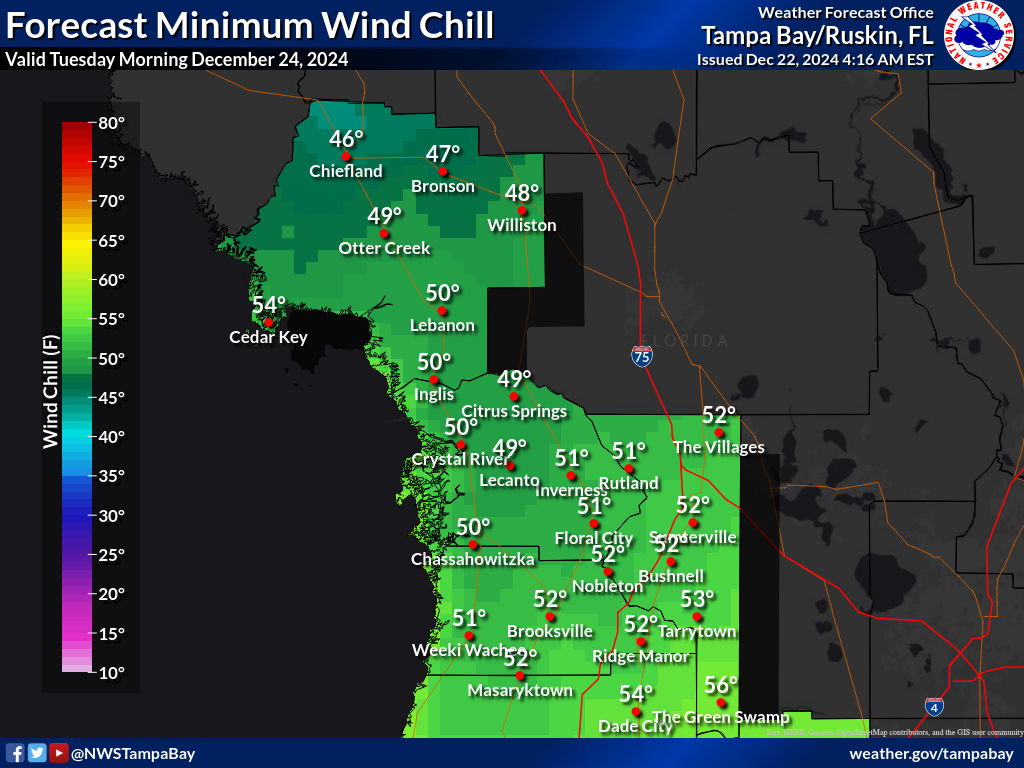
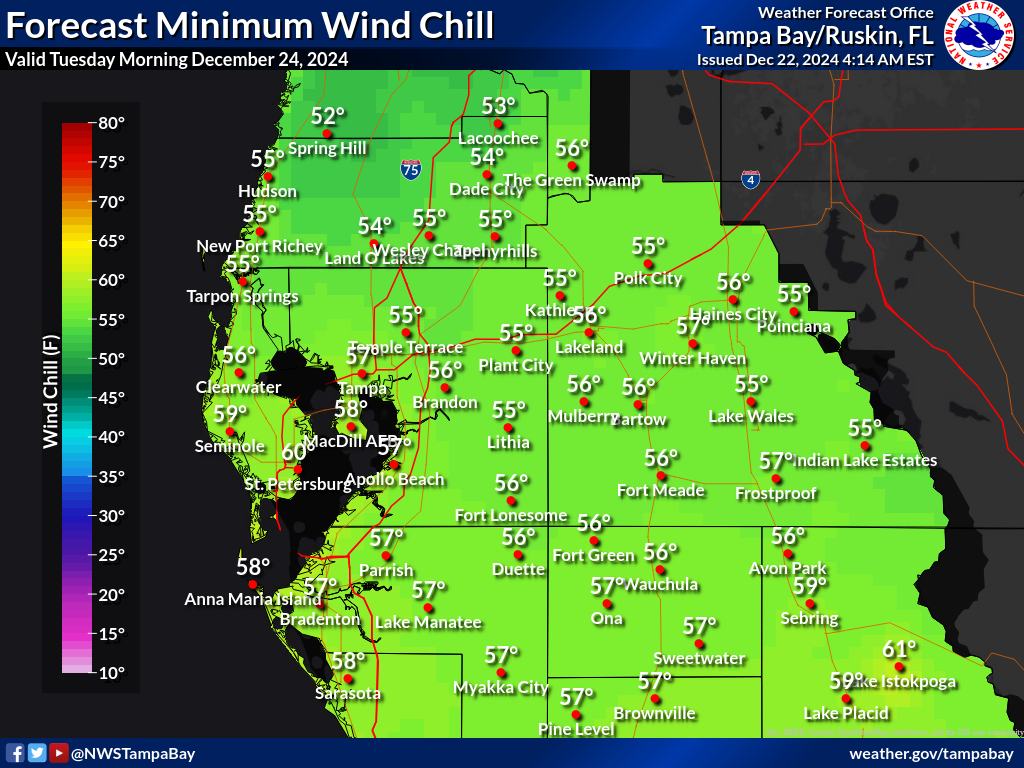
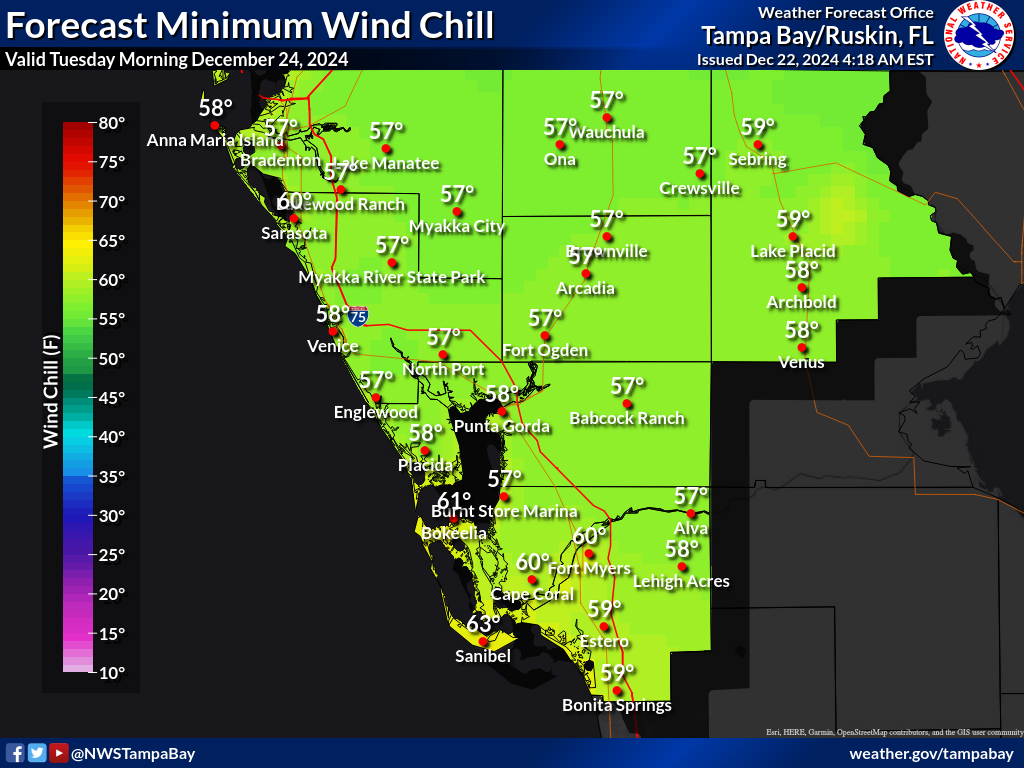
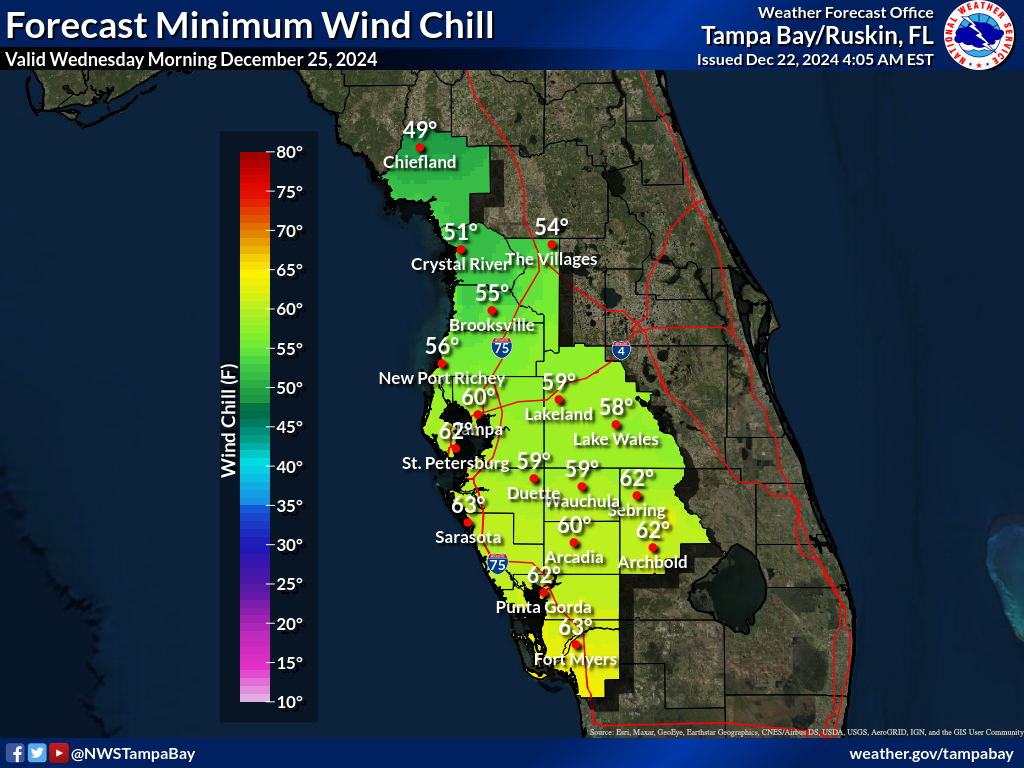
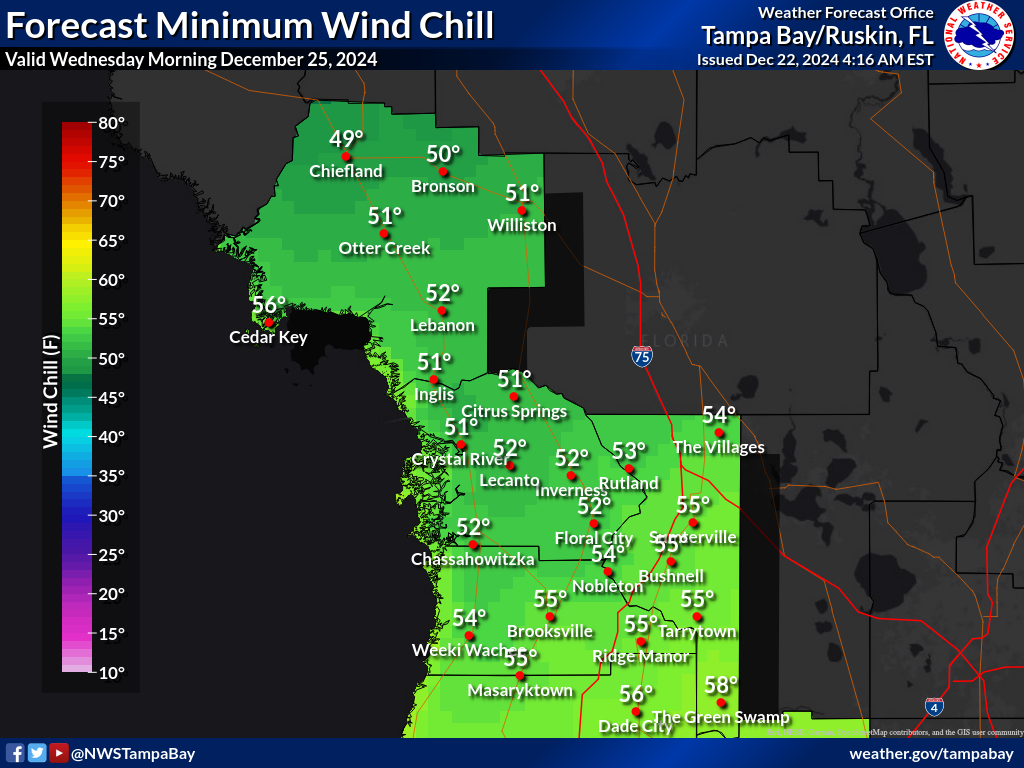
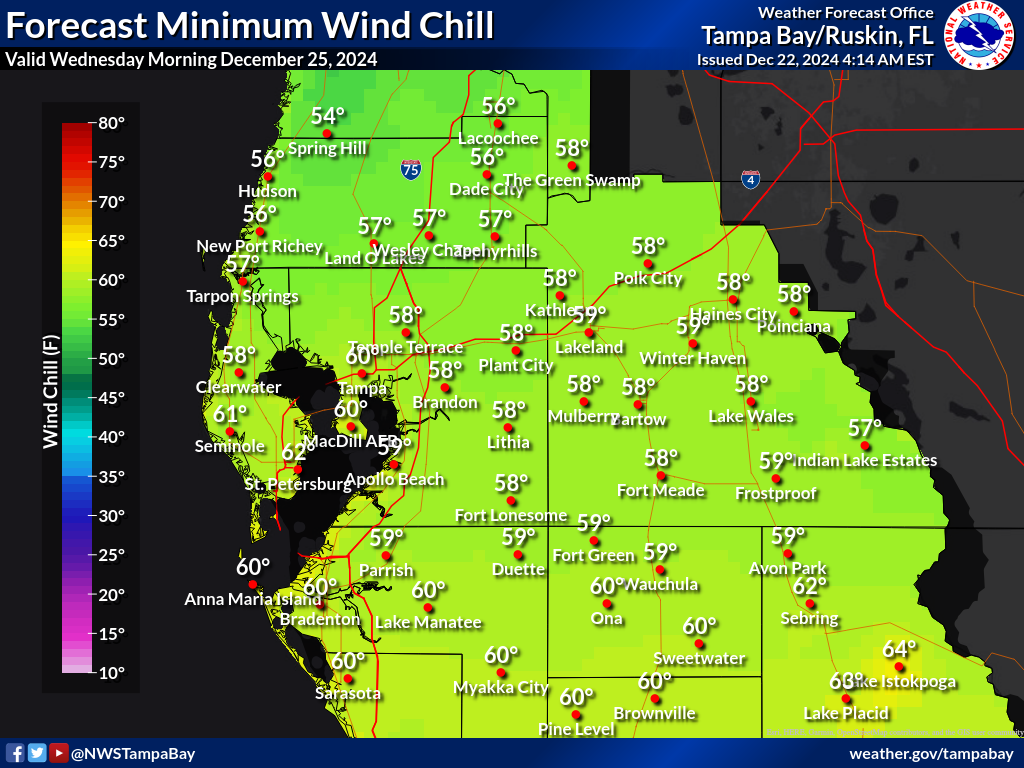
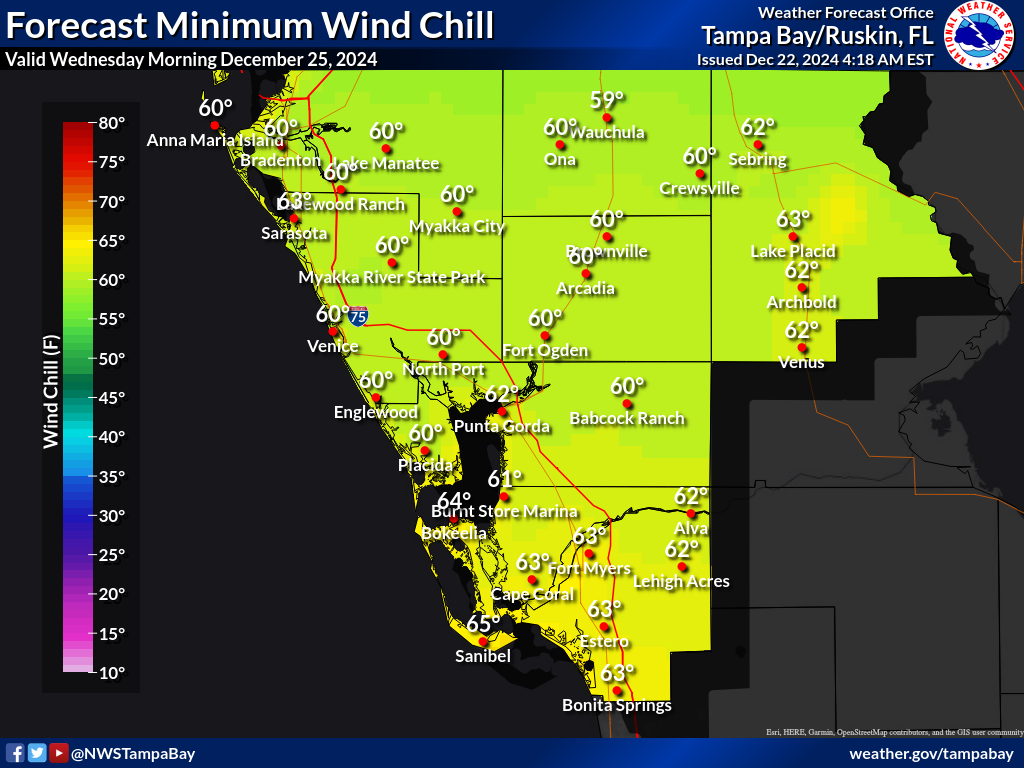
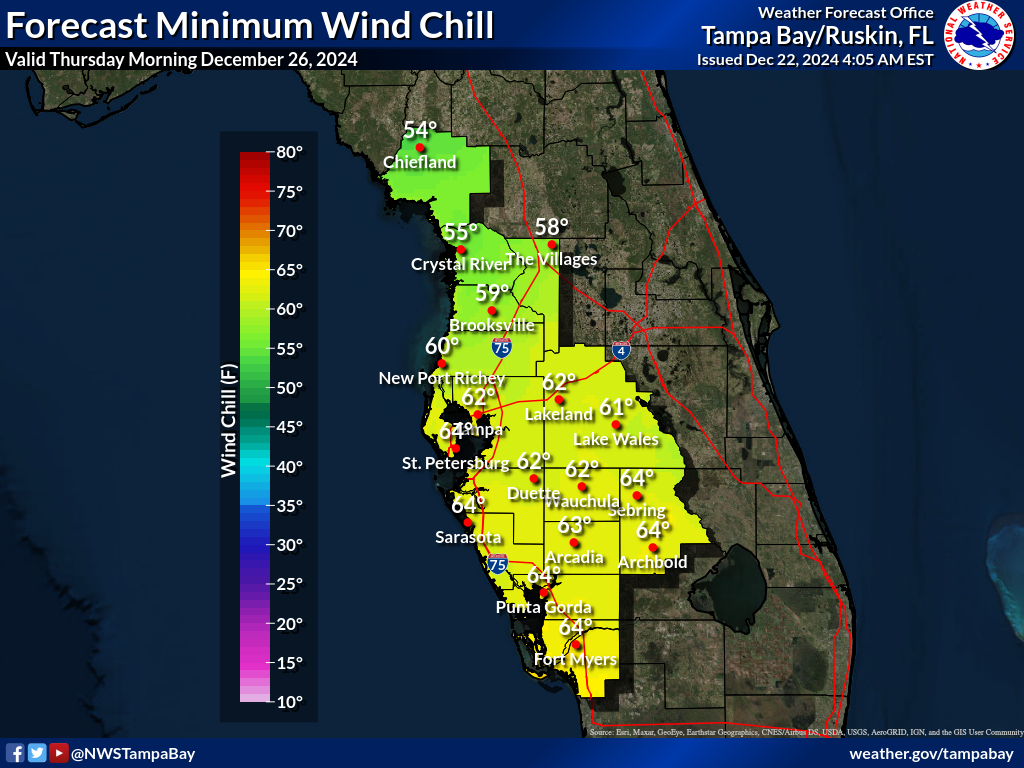
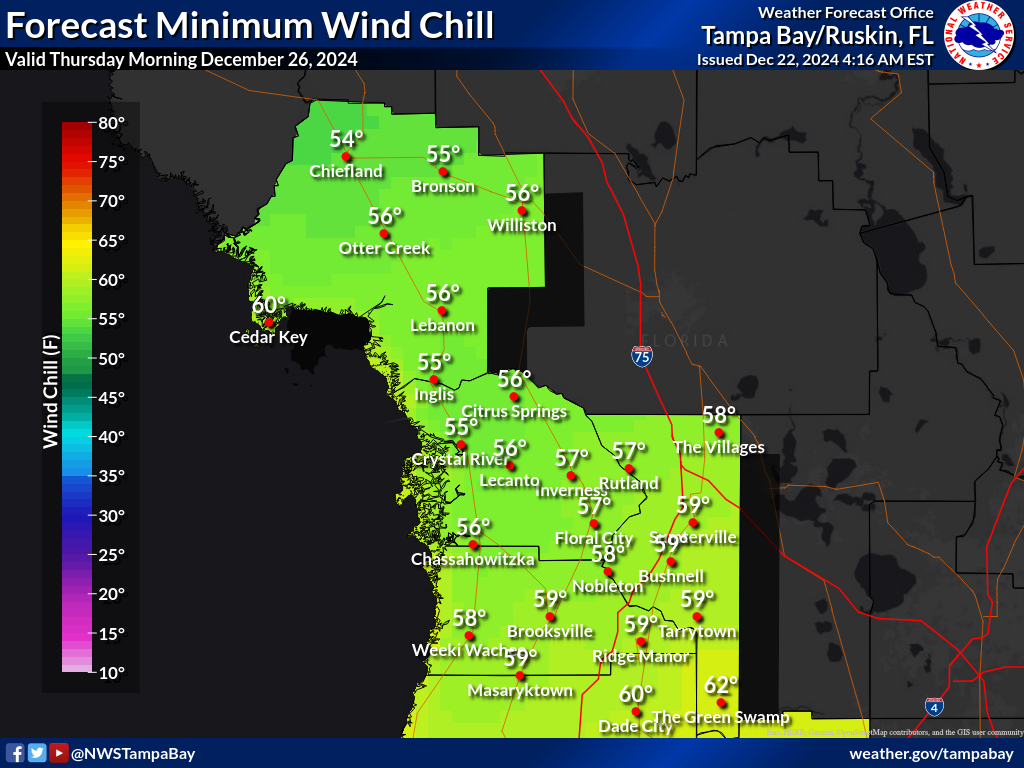
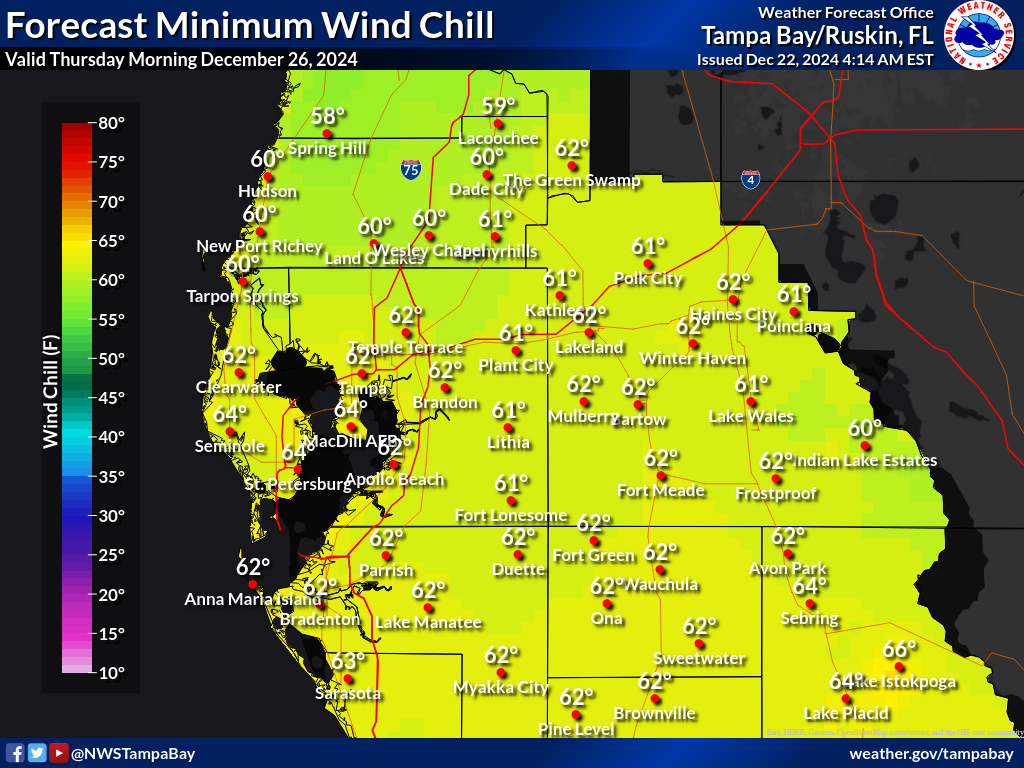
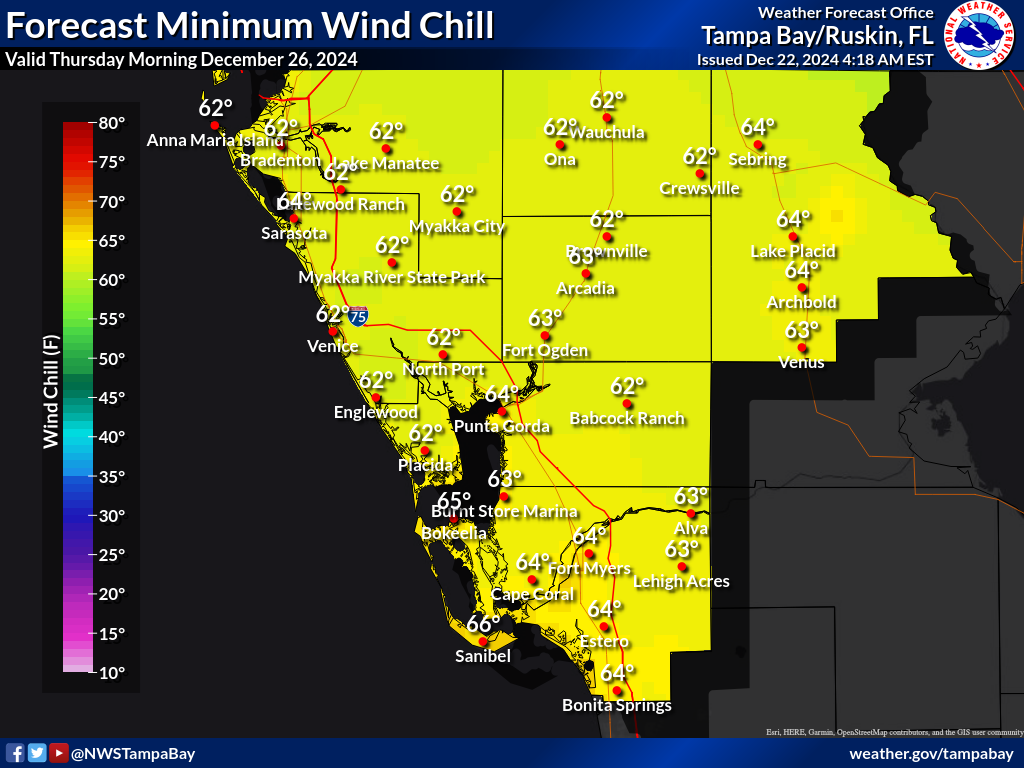
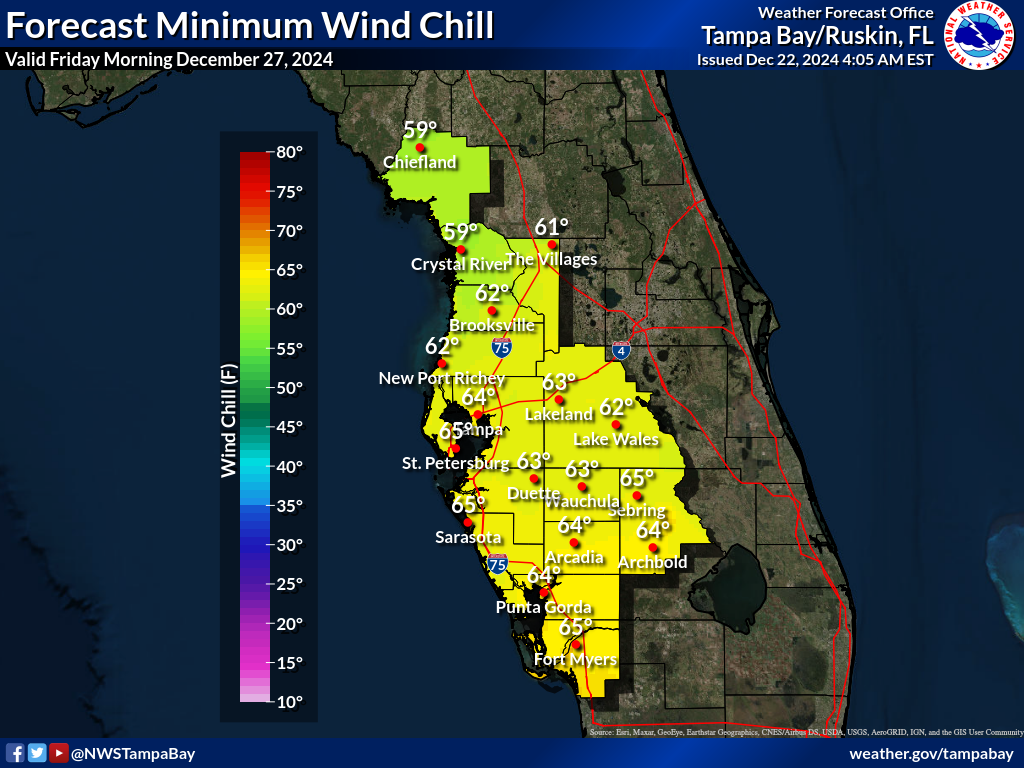
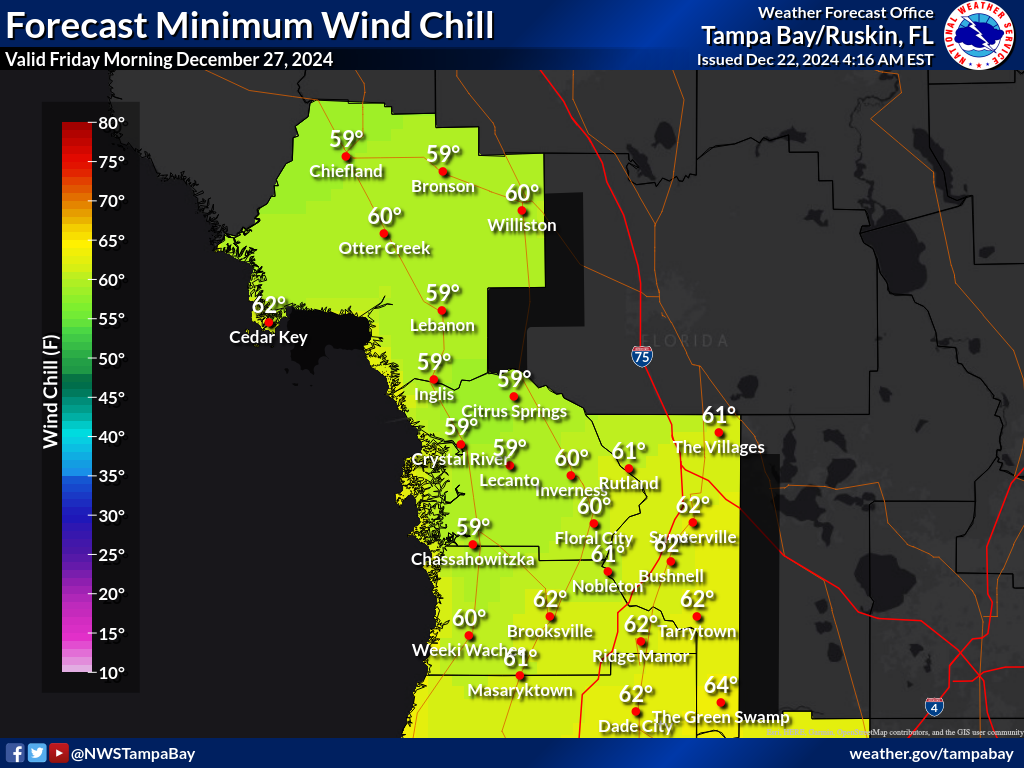
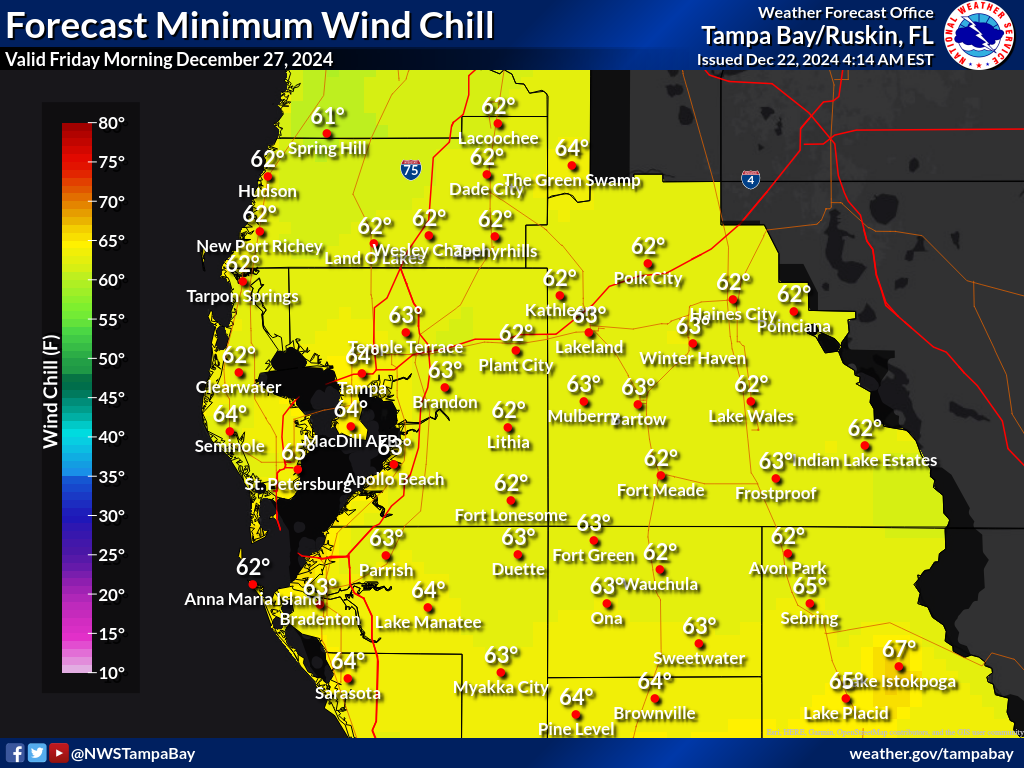
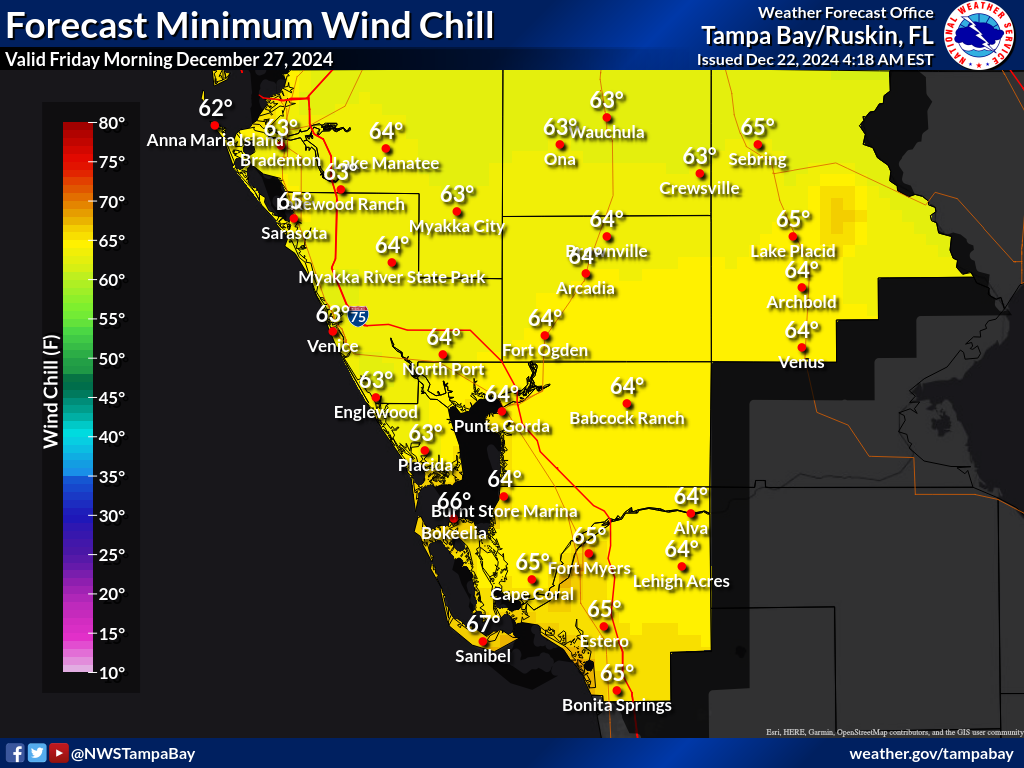
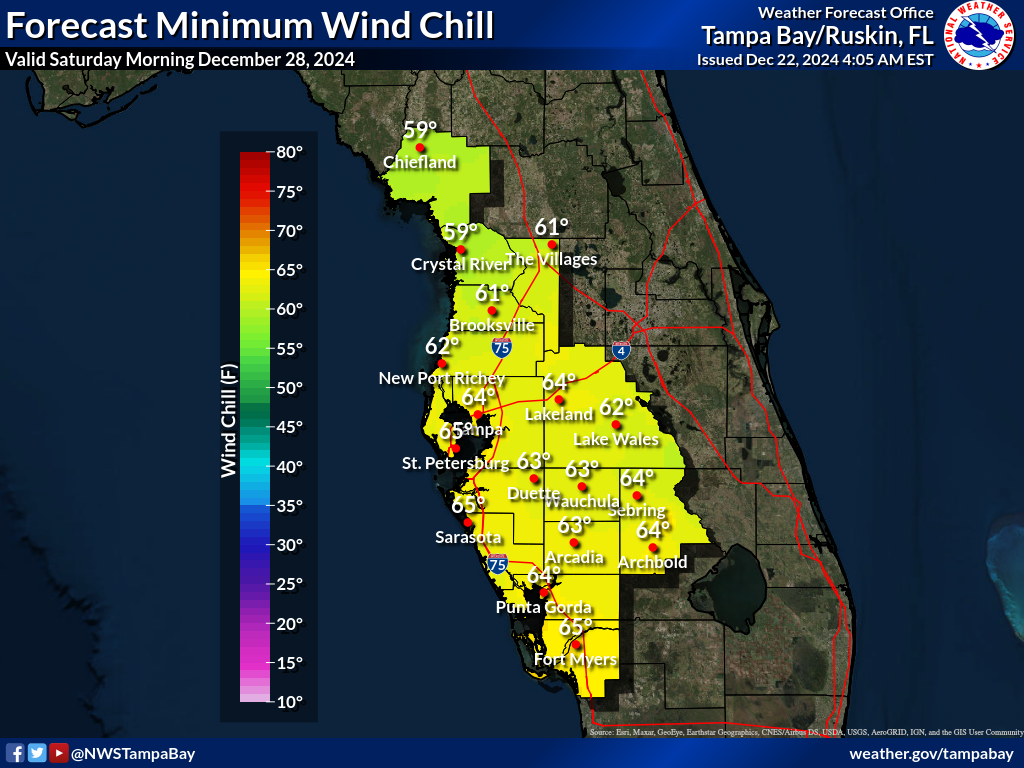
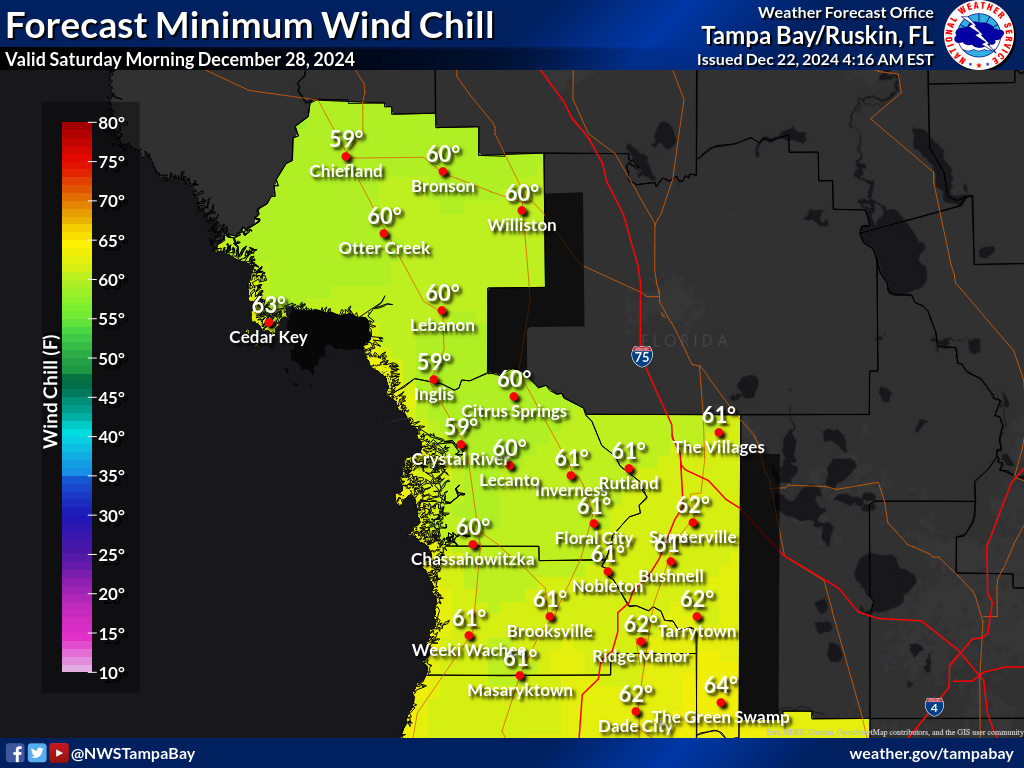
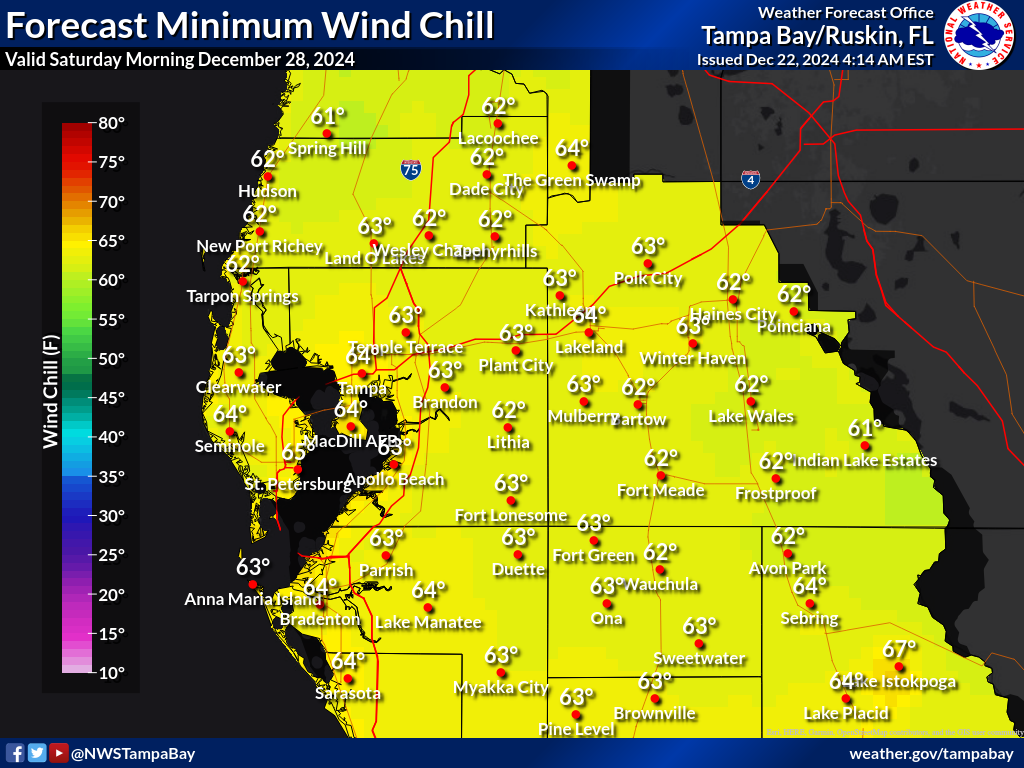
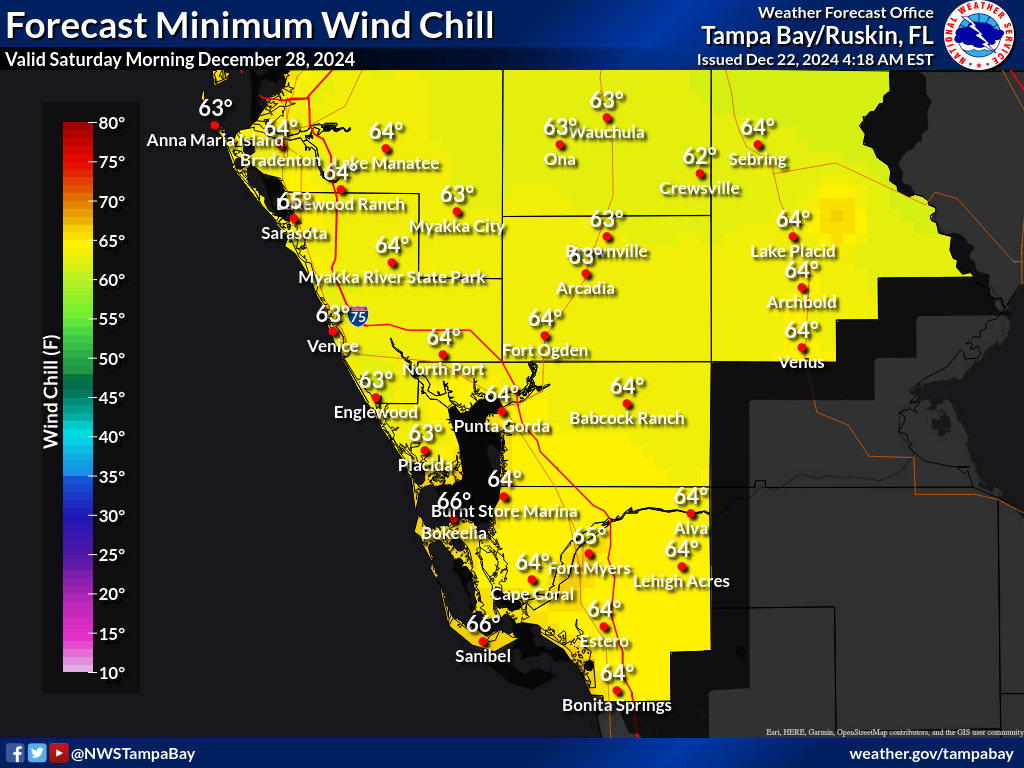
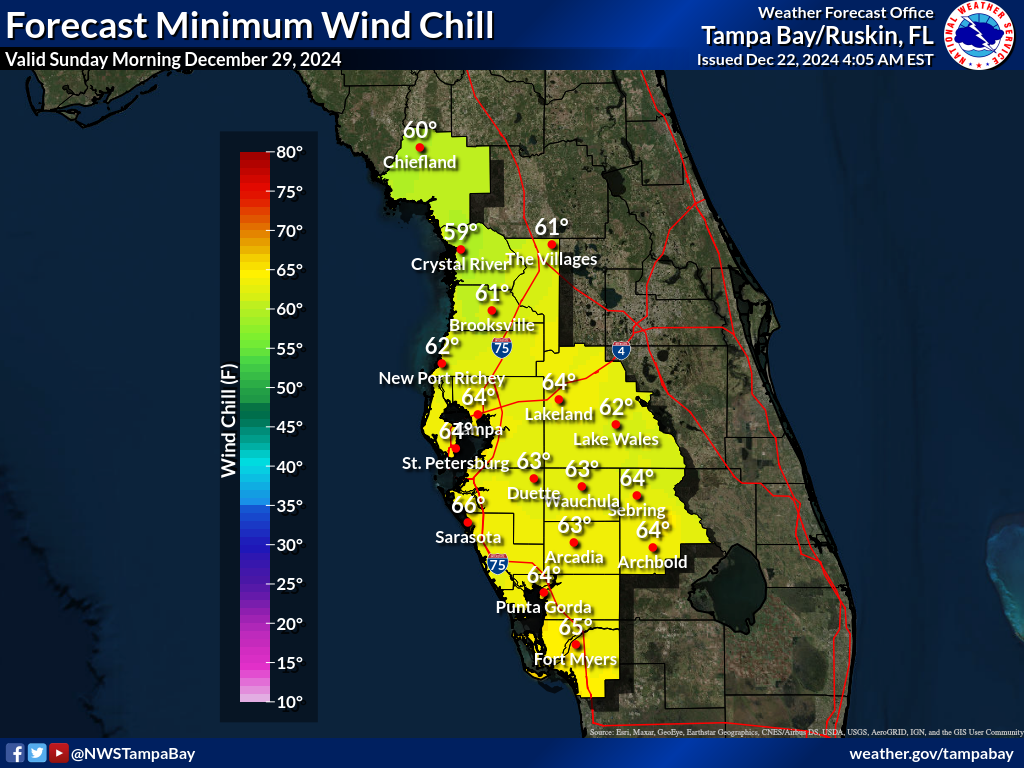
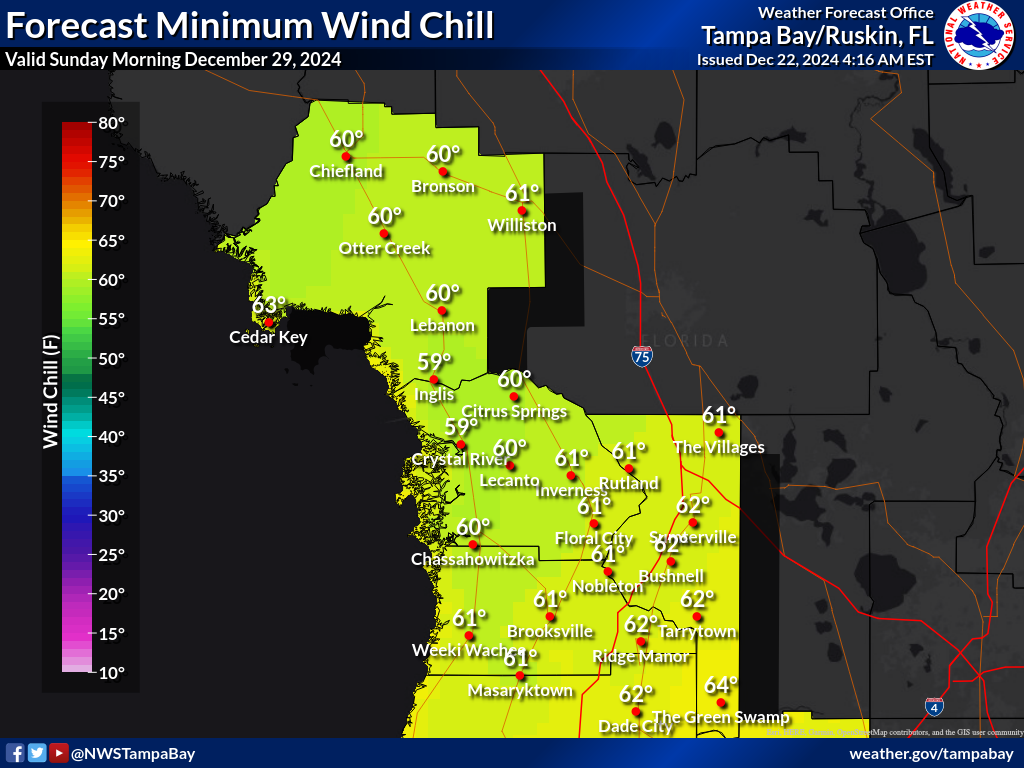
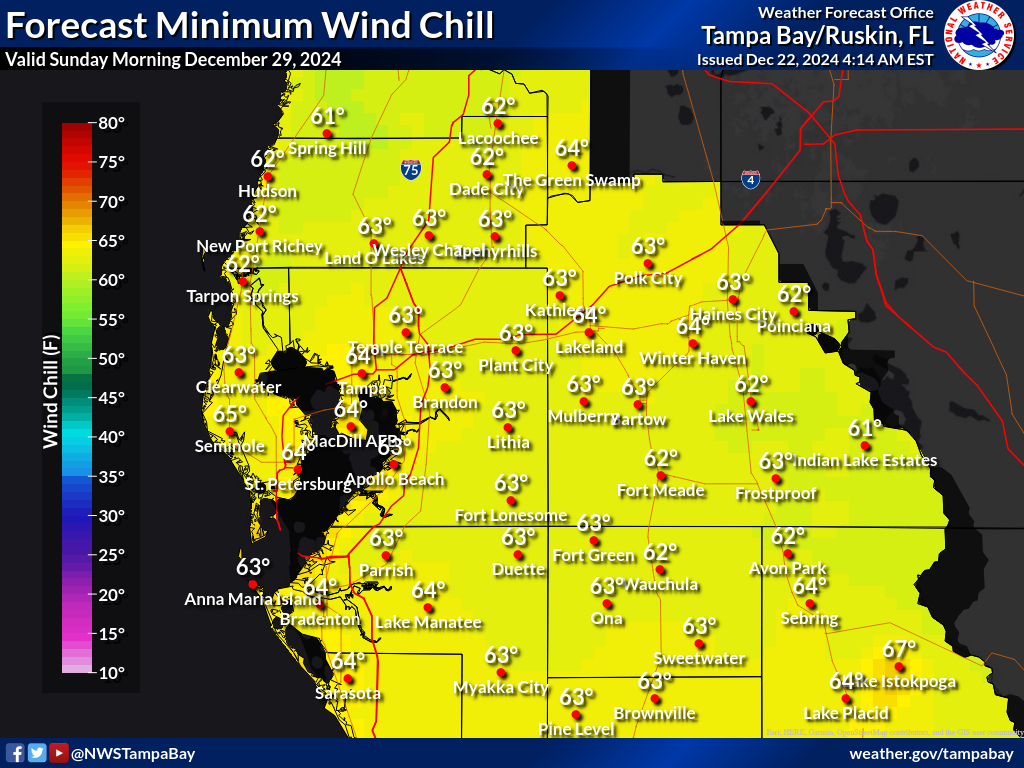
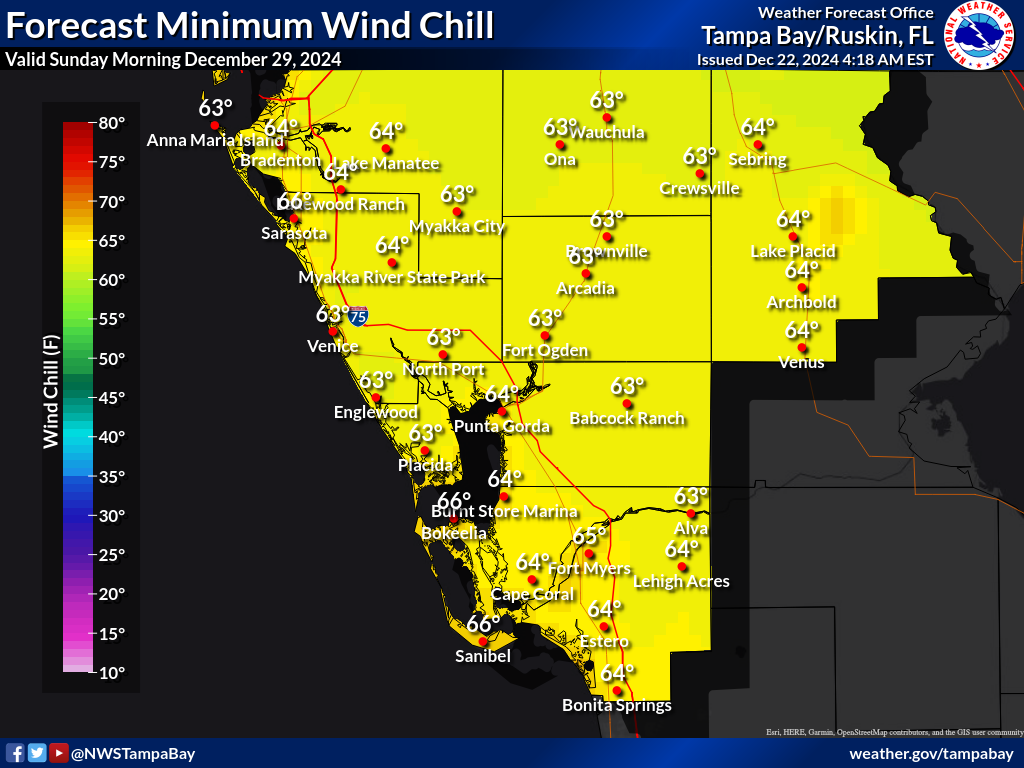
Expected Minimum Wind Chill (°F)
These maps are the official NWS wind chill forecast in degrees Fahrenheit during the time period shown on the graphic. These wind chills are determined by NWS forecasters to be the most likely outcome based on evaluation of data from computer models, satellite, radar, and other observations.
TBW CWA |
Nature Coast |
West Central |
Southwest |
|
Night 1 |
 |
 |
 |
 |
Night 2 |
 |
 |
 |
 |
Night 3 |
 |
 |
 |
 |
Night 4 |
 |
 |
 |
 |
Night 5 |
 |
 |
 |
 |
Night 6 |
 |
 |
 |
 |
Night 7 |
 |
 |
 |
 |
Probability of Temperatures 32°F or less
These maps represent the likelihood of the temperature falling to or below 32°F for the time period shown on the graphic.
Night 1 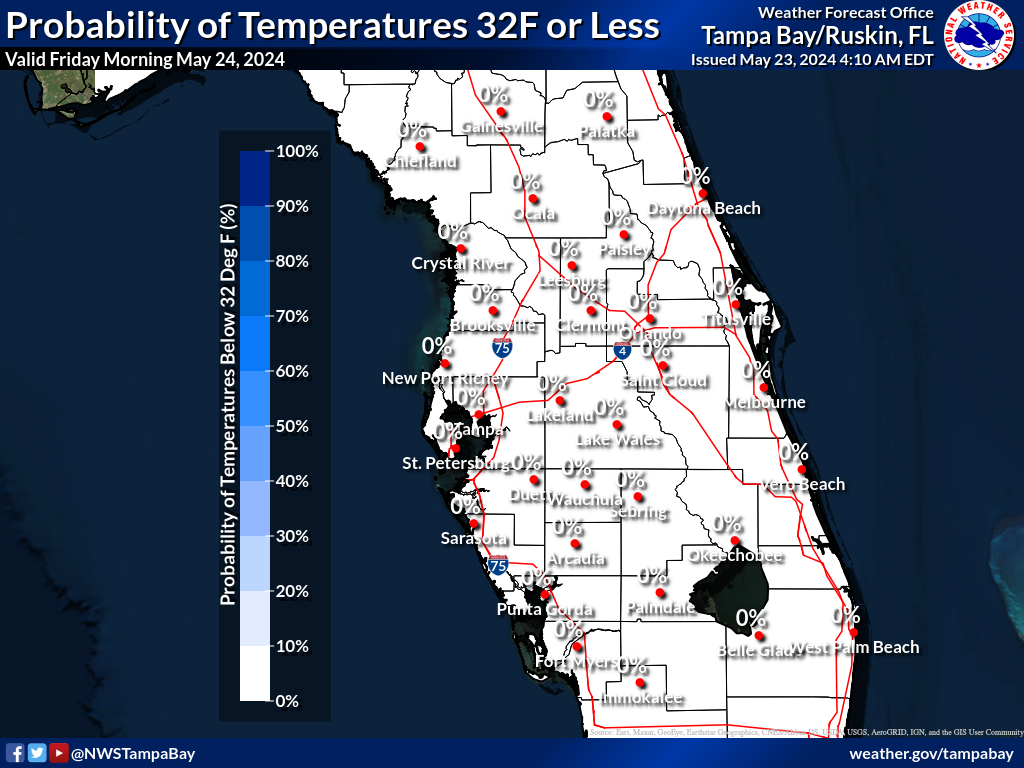 |
Night 2 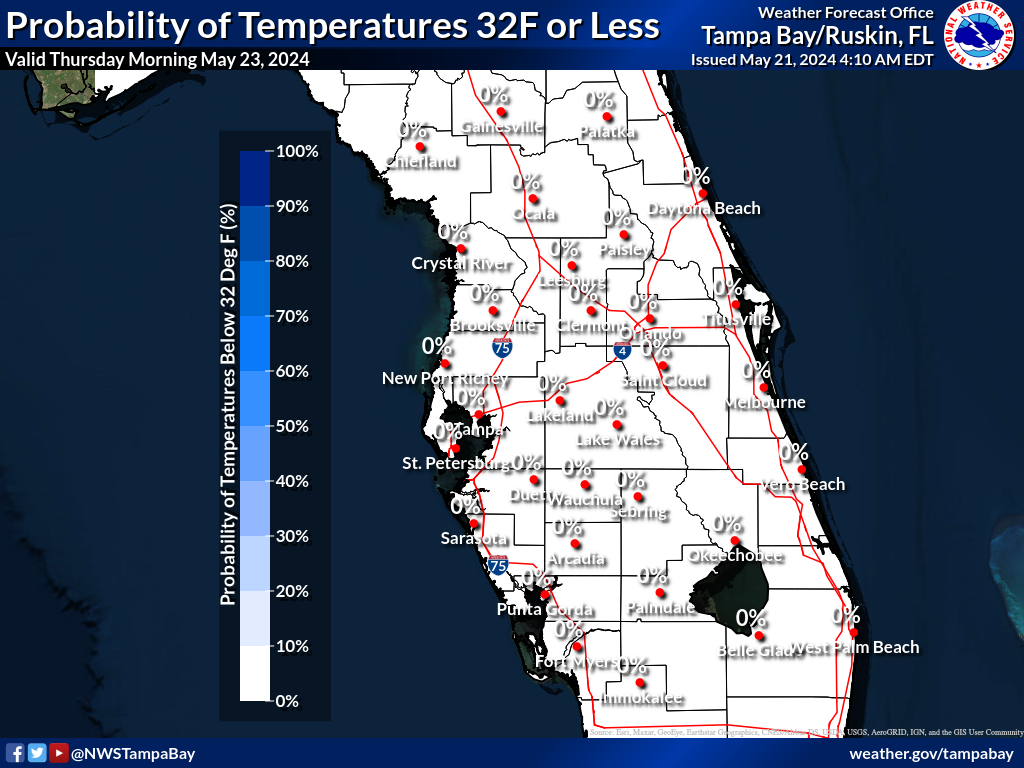 |
Night 3 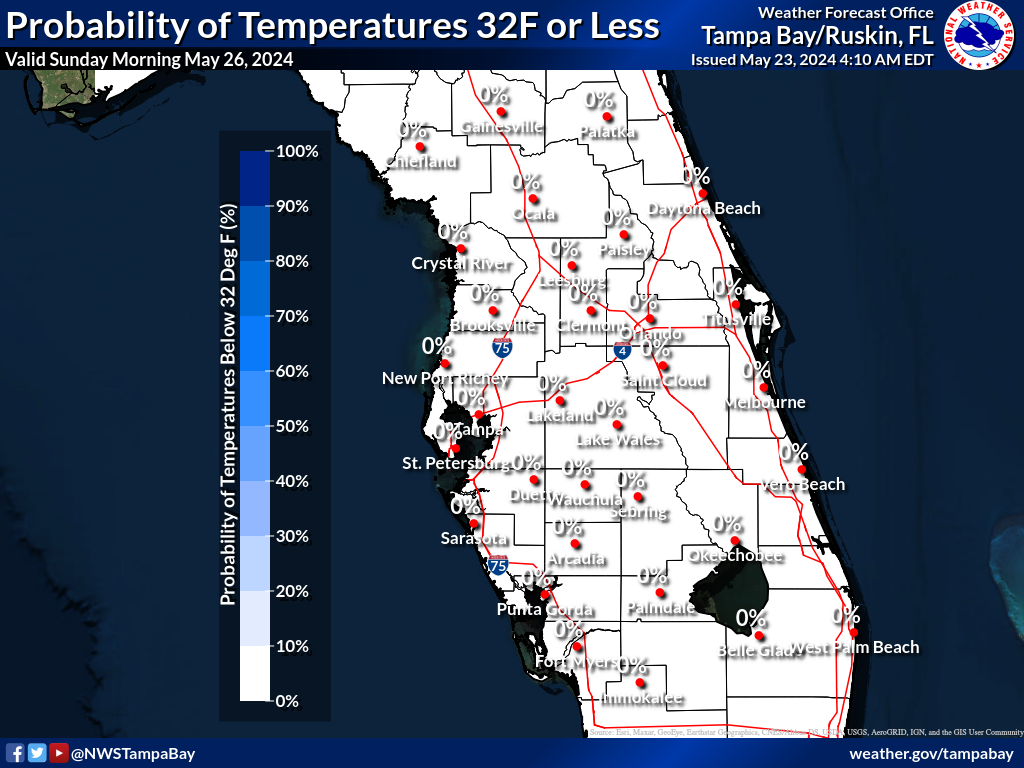 |
Night 4 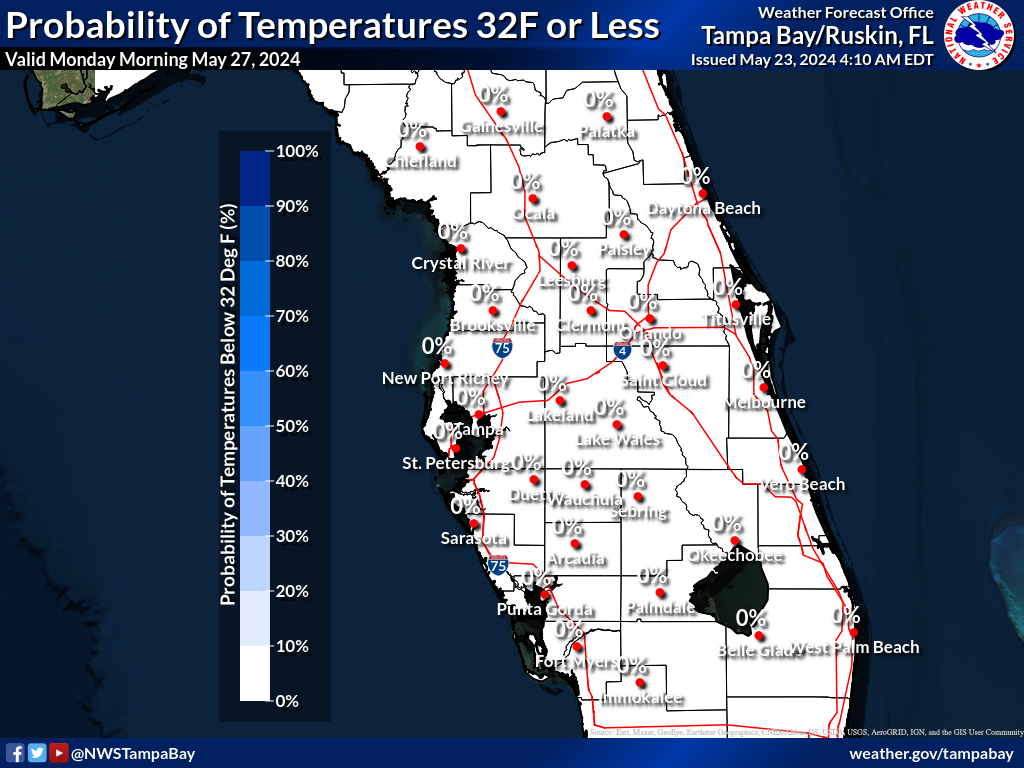 |
Night 5 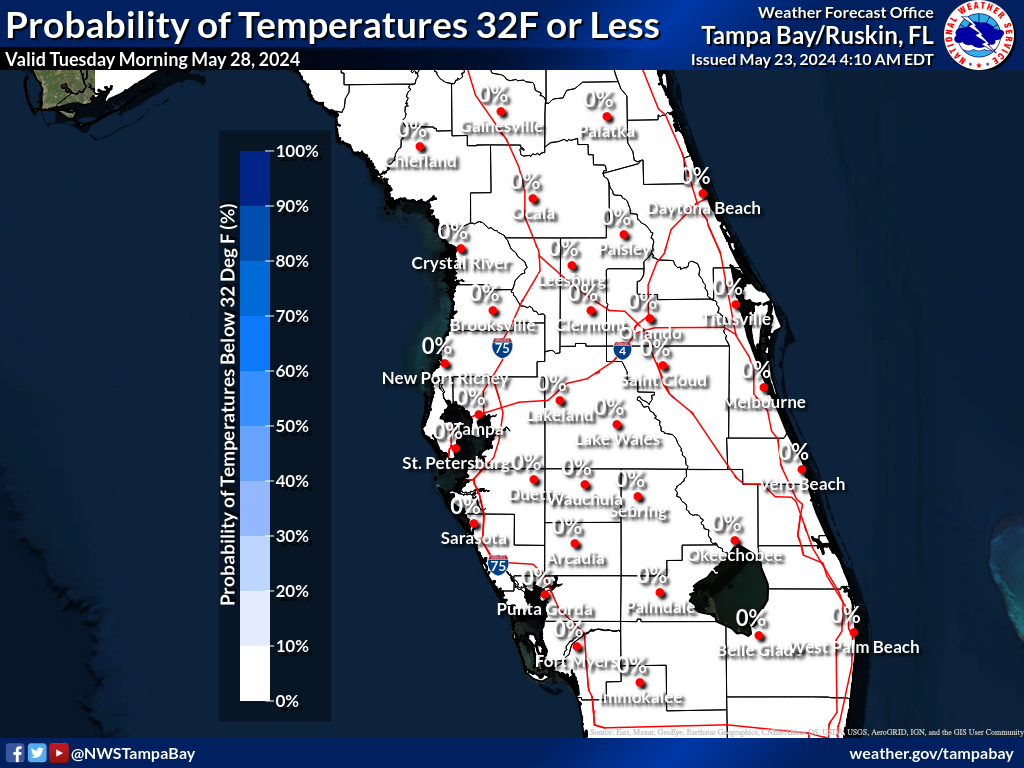 |
Night 6 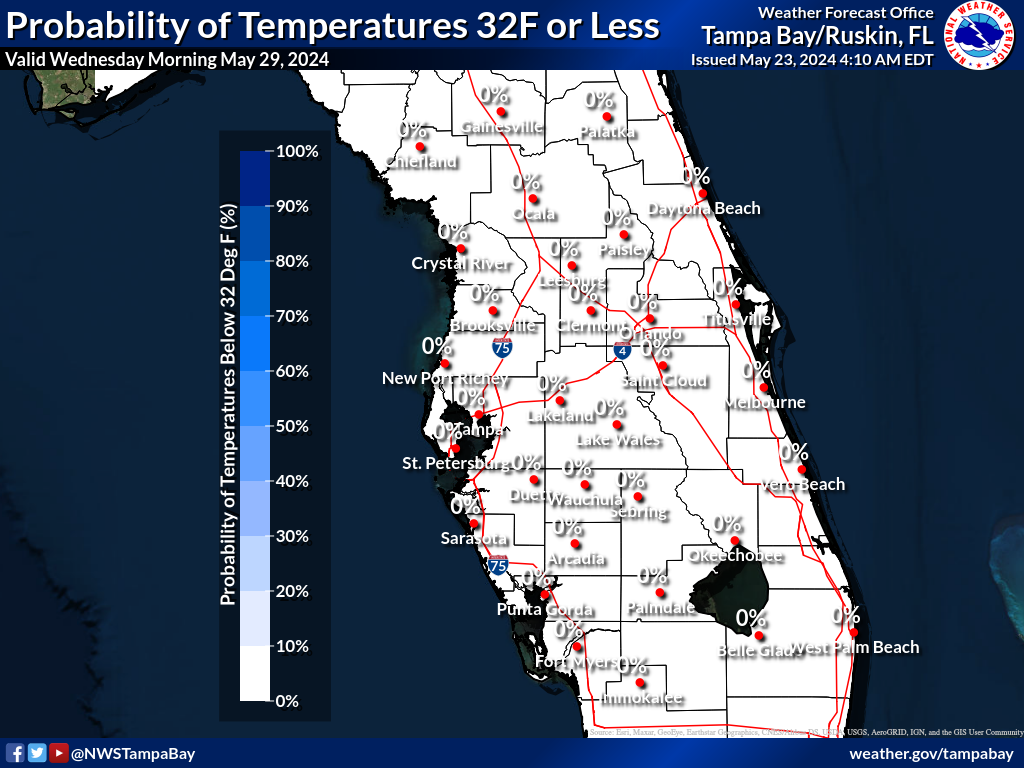 |
Night 7 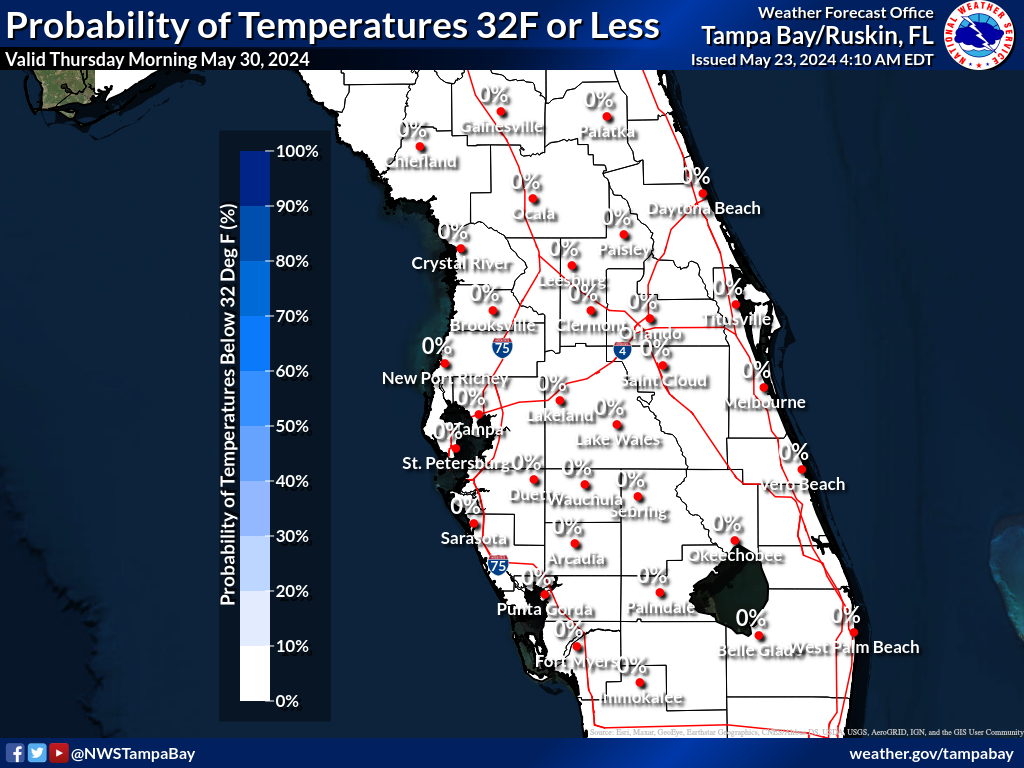 |
Probability of Temperatures 27°F or less
These maps represent the likelihood of the temperature falling to 27°F or less for the time period shown on the graphic.
Night 1 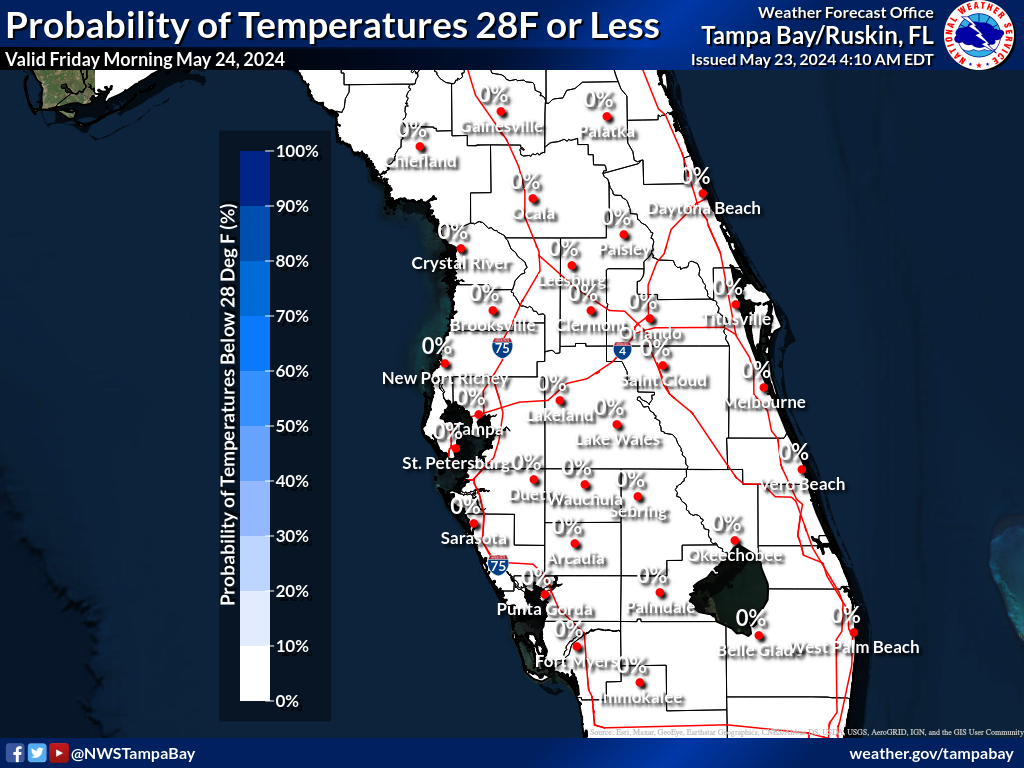 |
Night 2 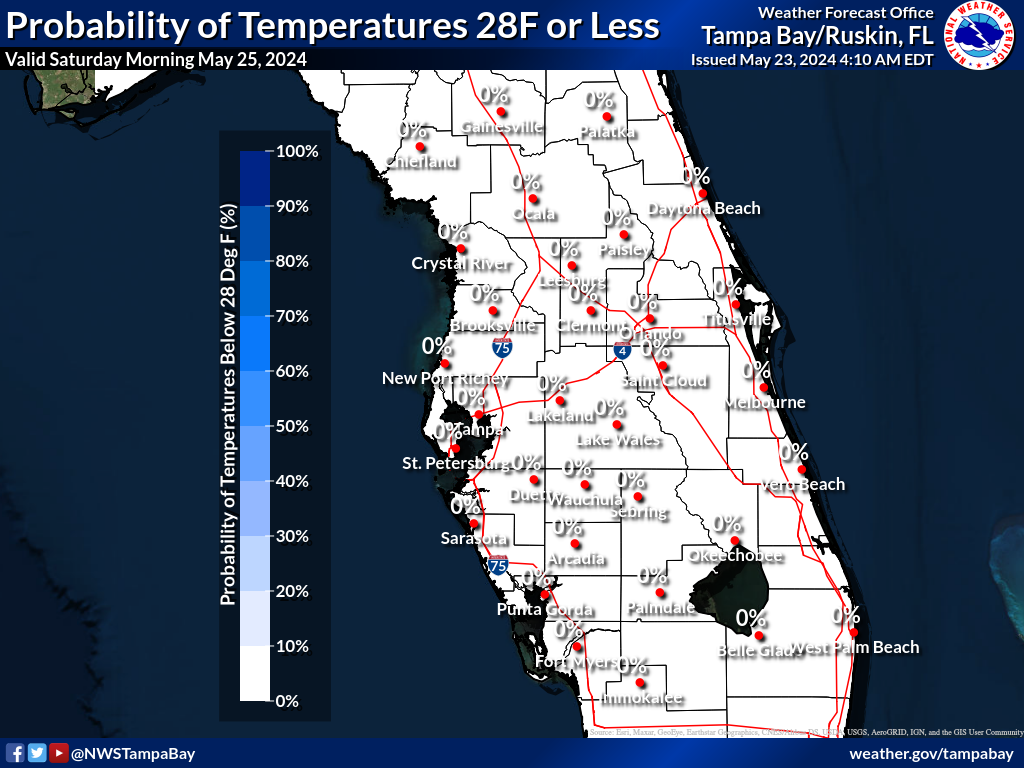 |
Night 3 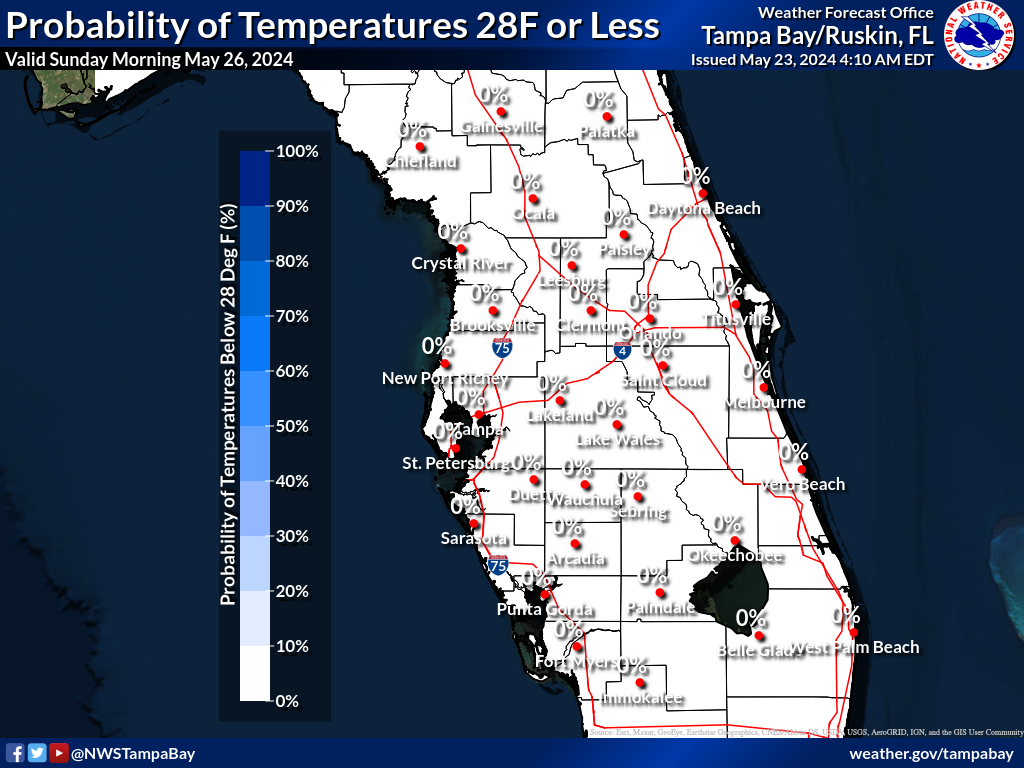 |
Night 4 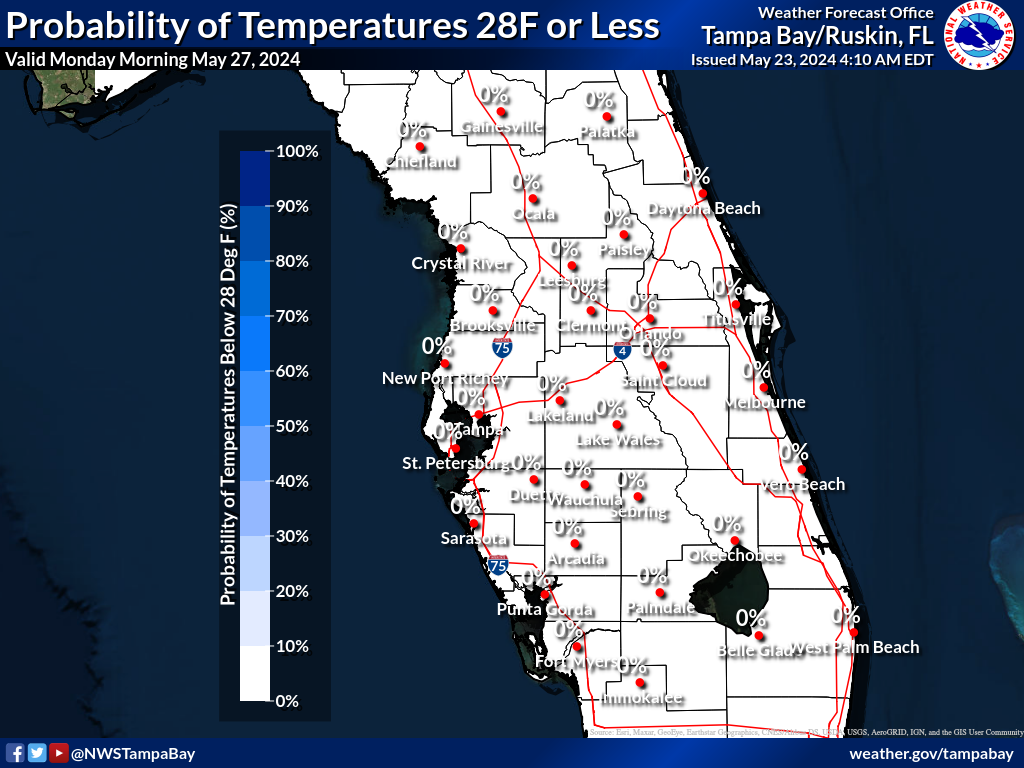 |
Night 5 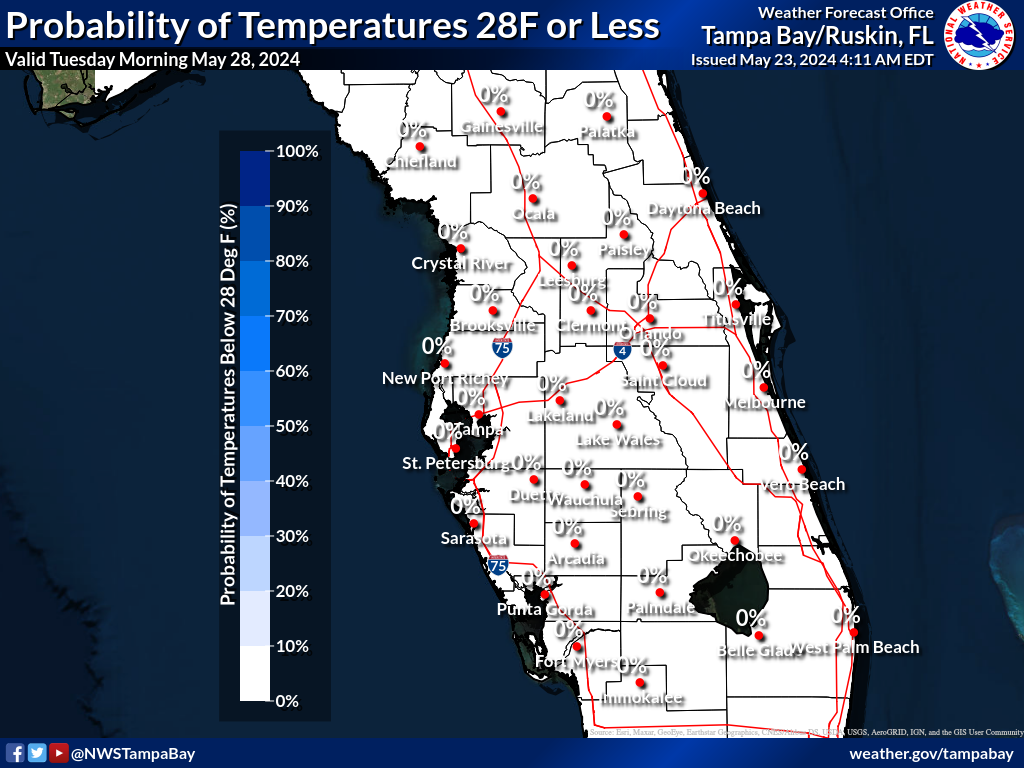 |
Night 6 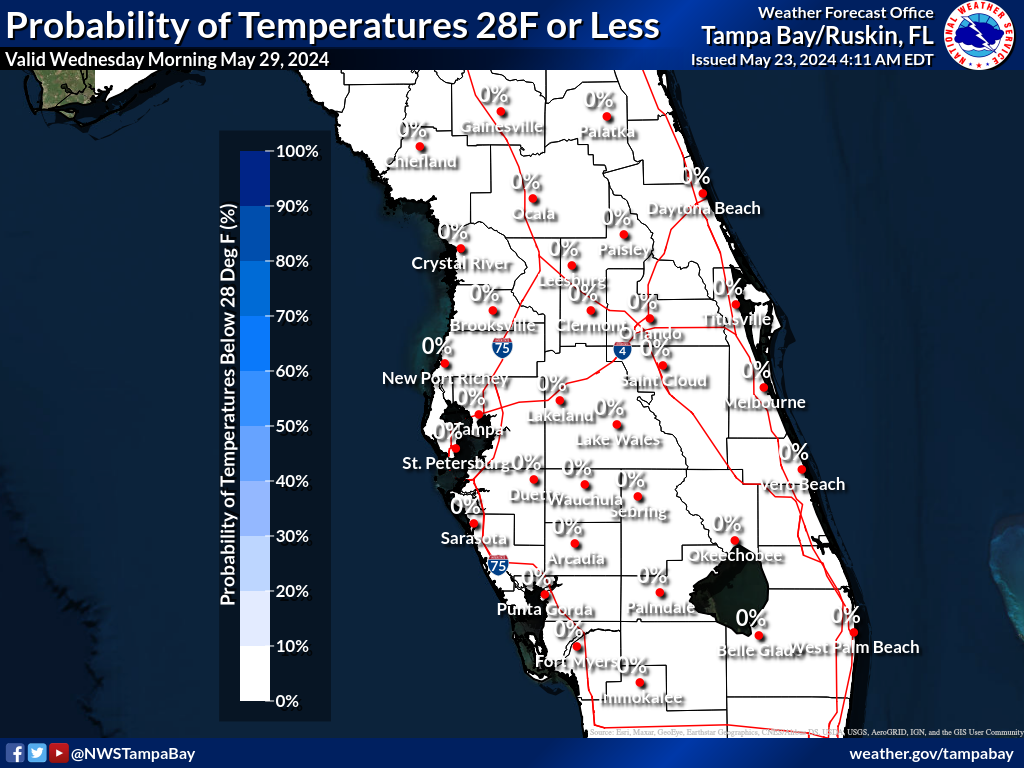 |
Night 7 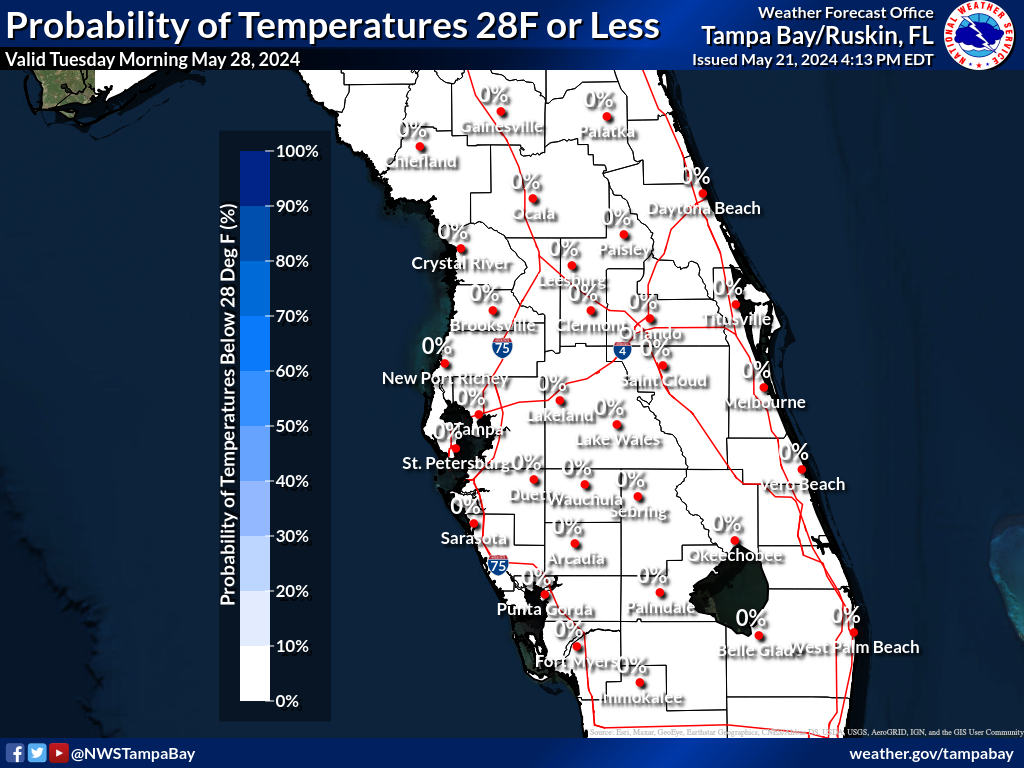 |
Expected 12 Hour Rainfall (in.)
These maps are the official NWS rainfall forecast in inches during the time period shown on the graphic. These rainfall amounts are determined by NWS forecasters to be the most likely outcome based on evaluation of data from computer models, satellite, radar, and other observations.
Day 1 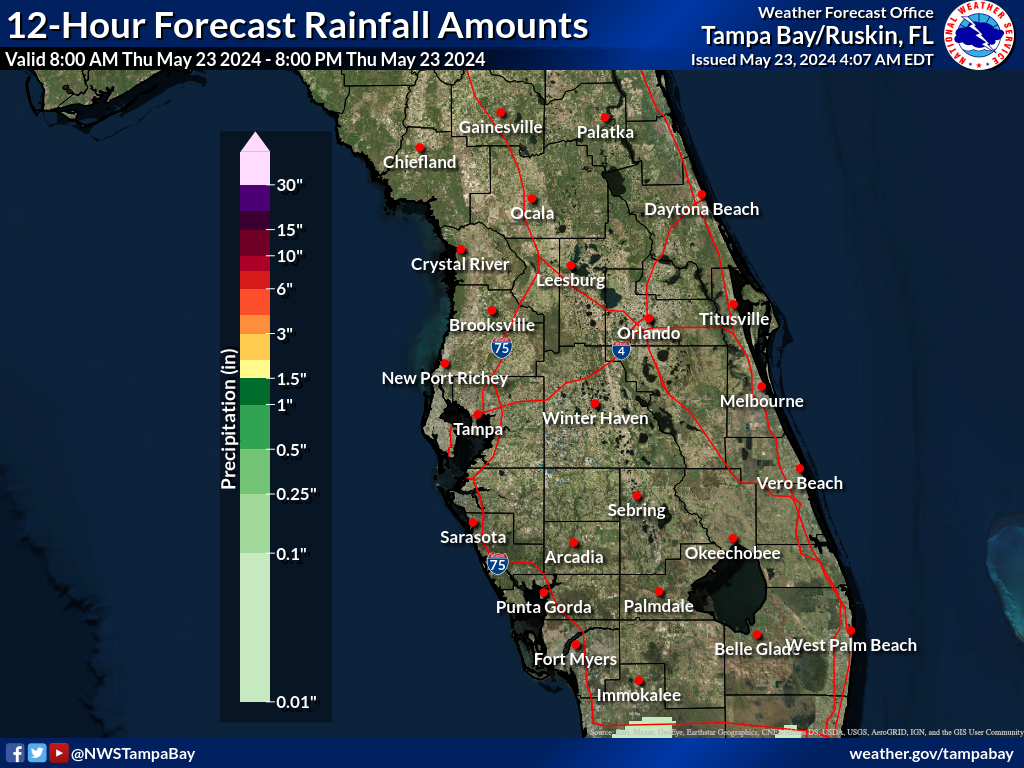 |
Night 1 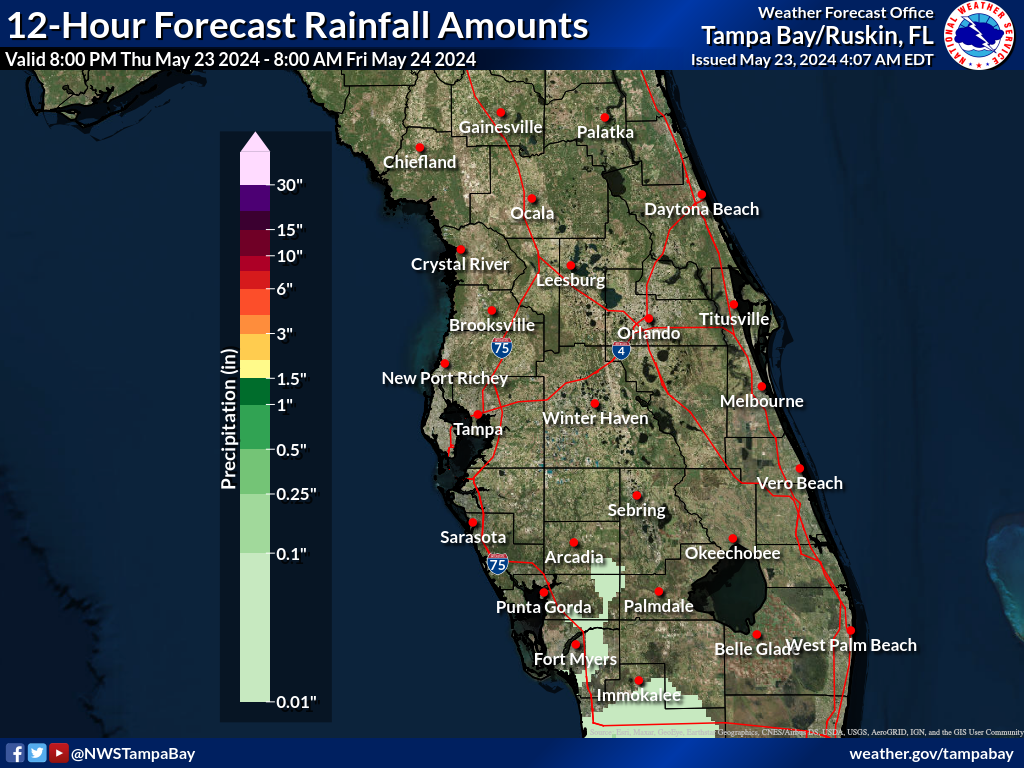 |
Day 2 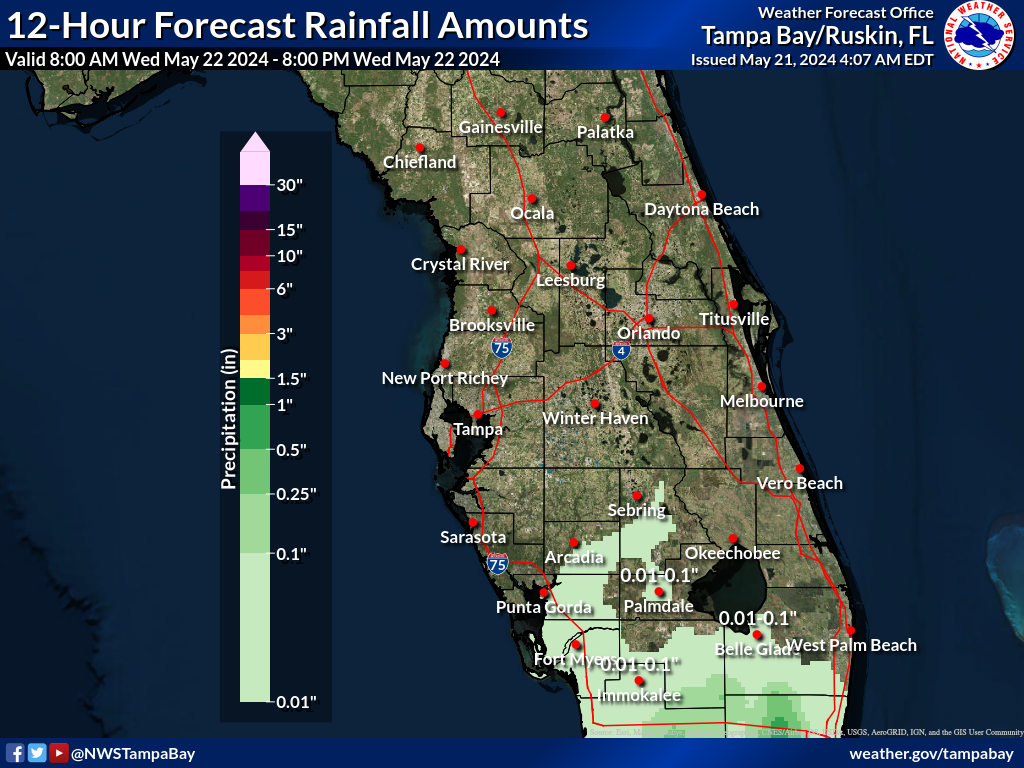 |
Night 2 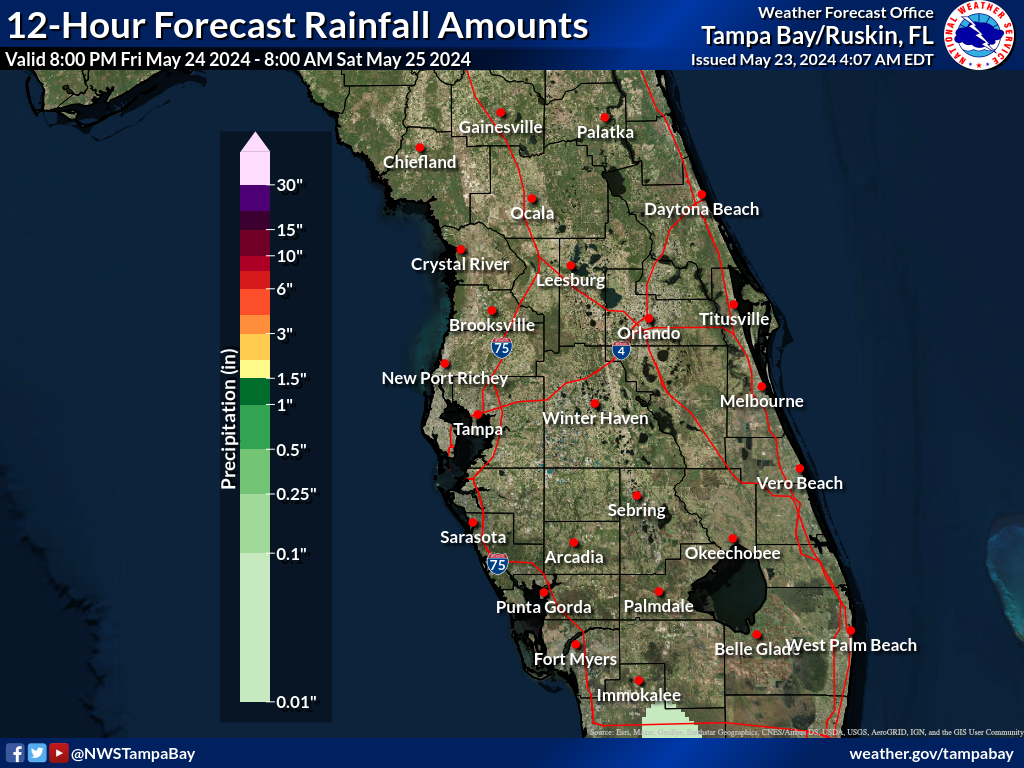 |
Day 3 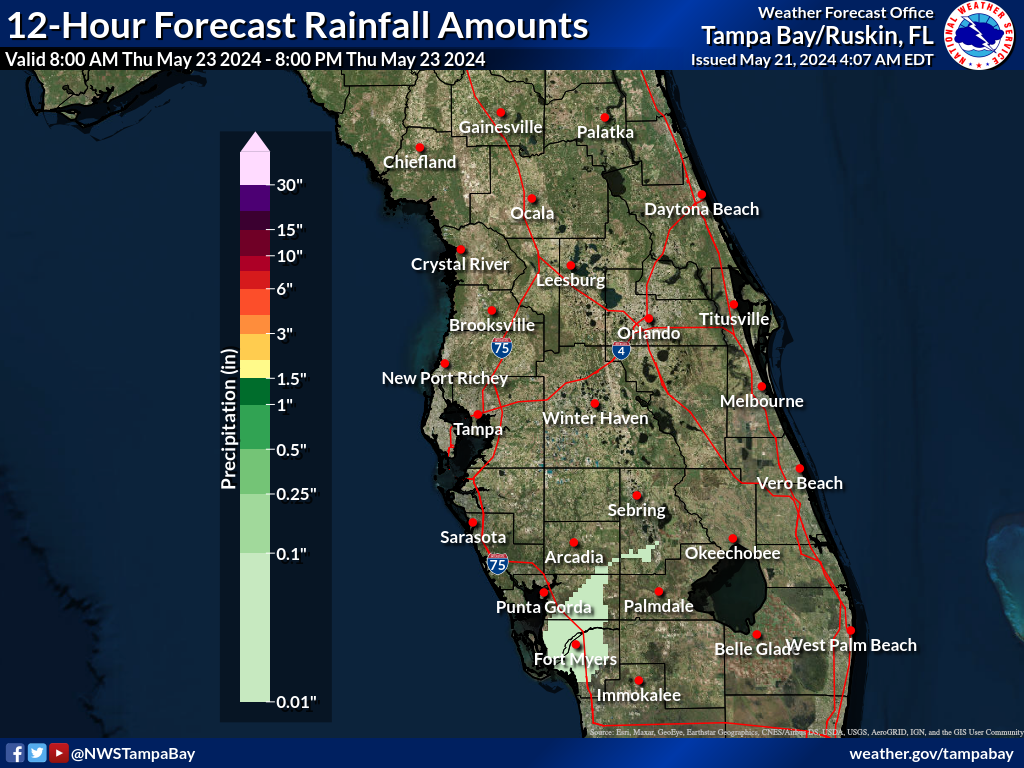 |
Night 3 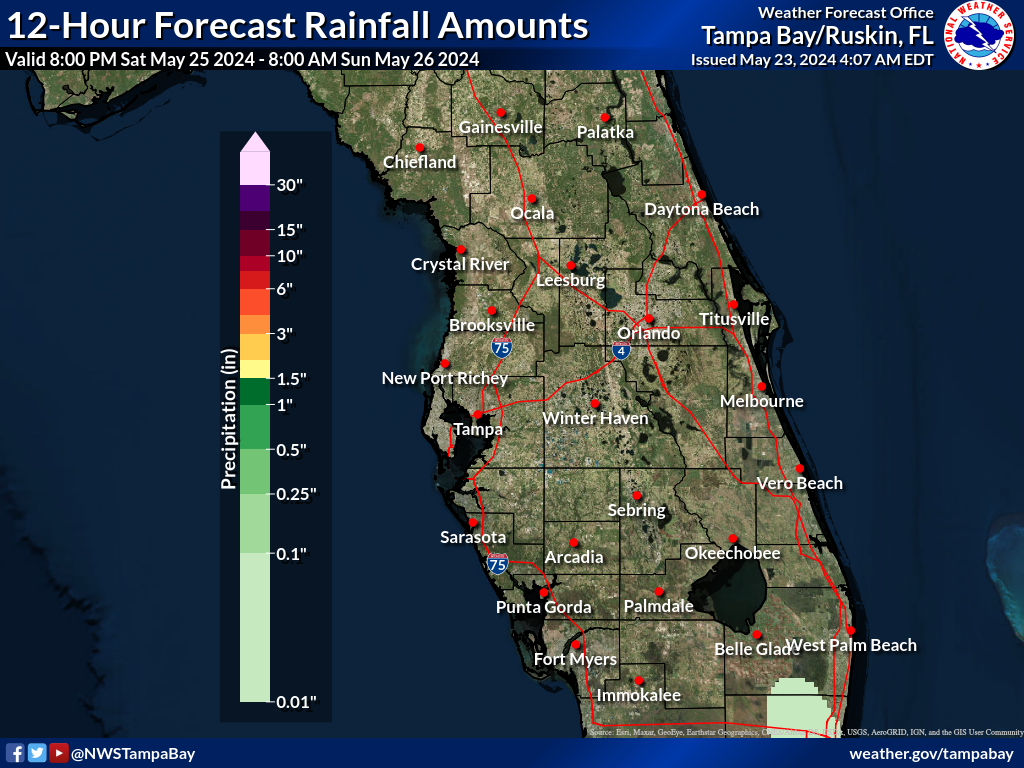 |
Day 4 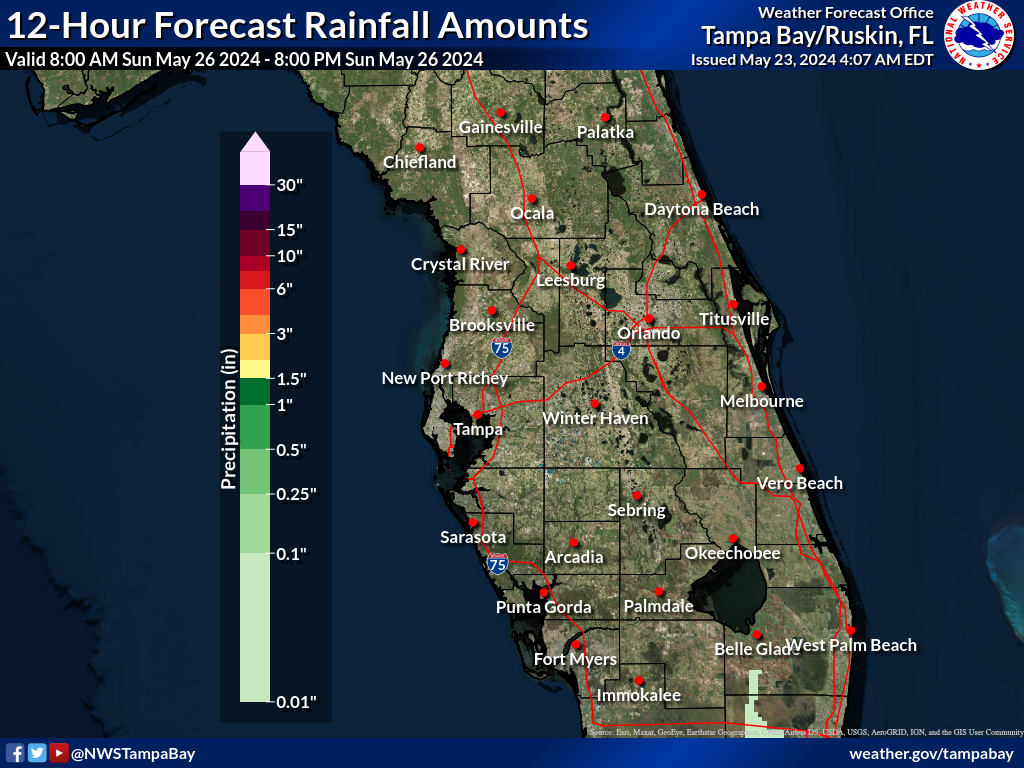 |
Night 4 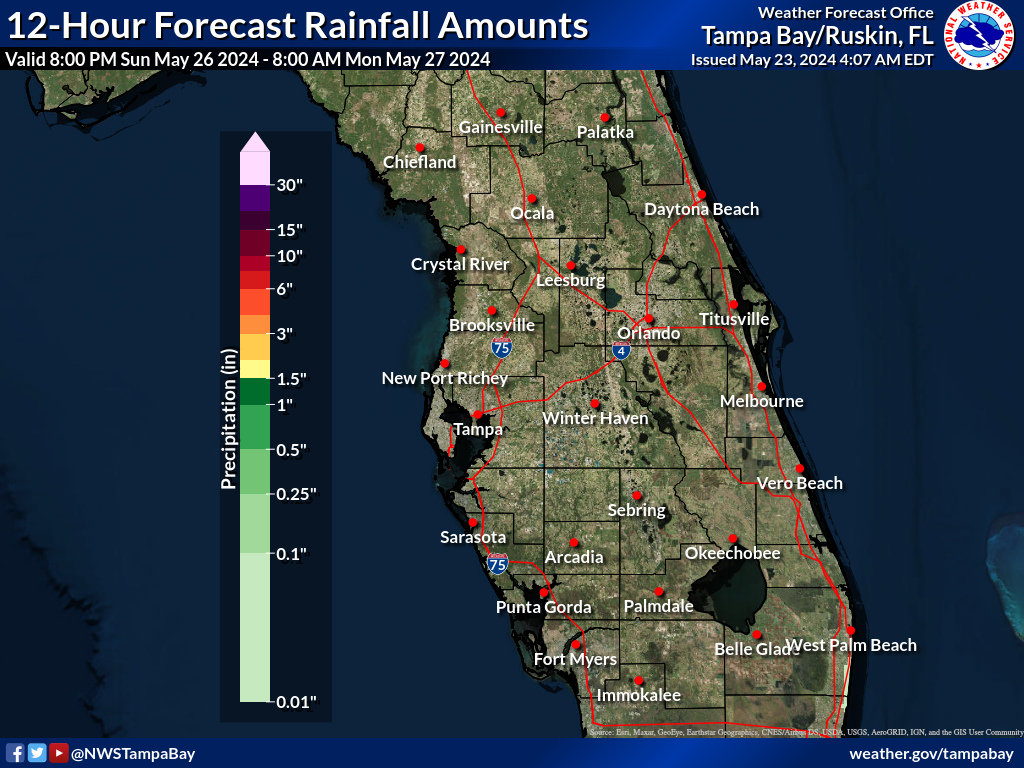 |
Day 5 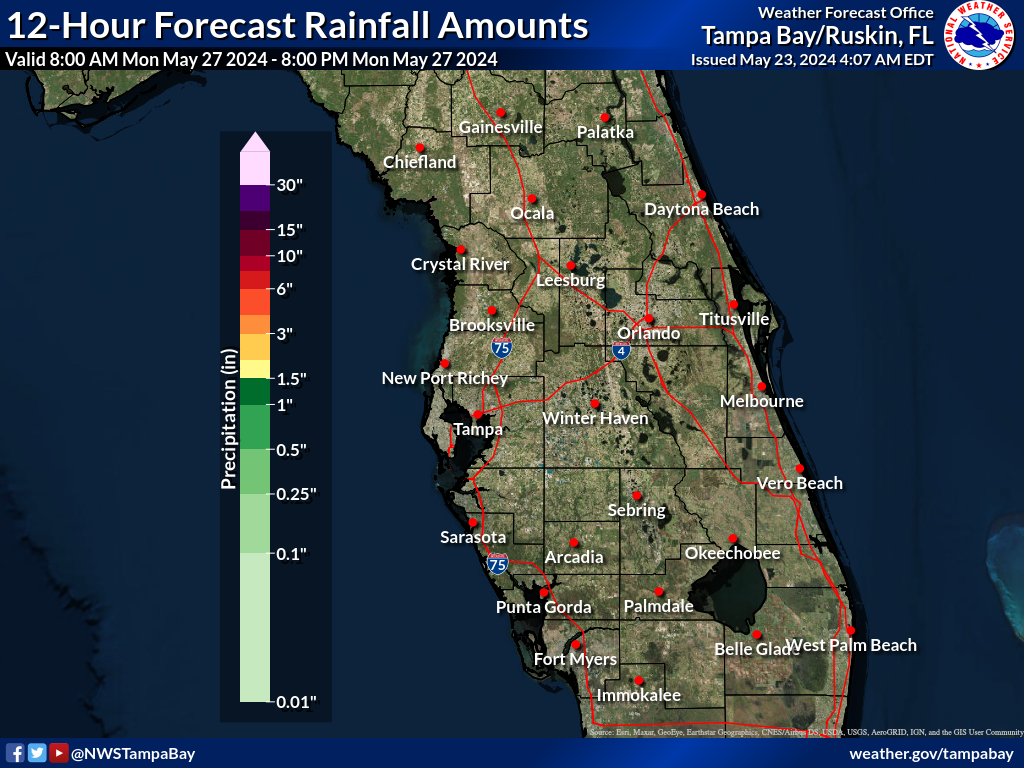 |
Night 5 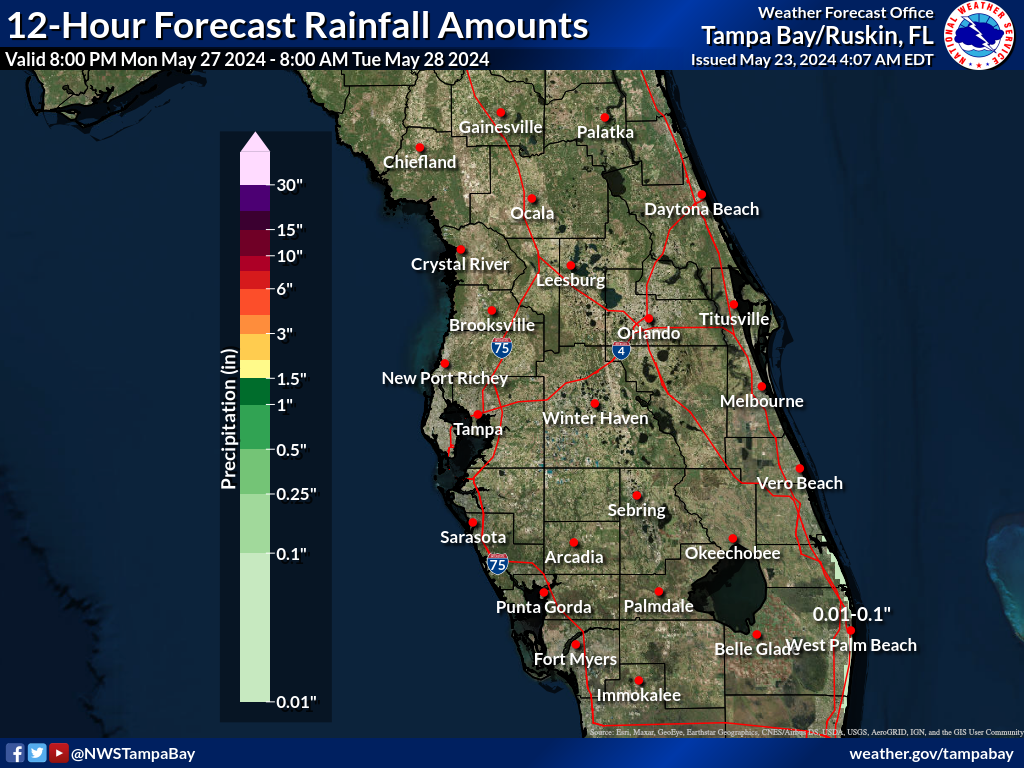 |
Day 6 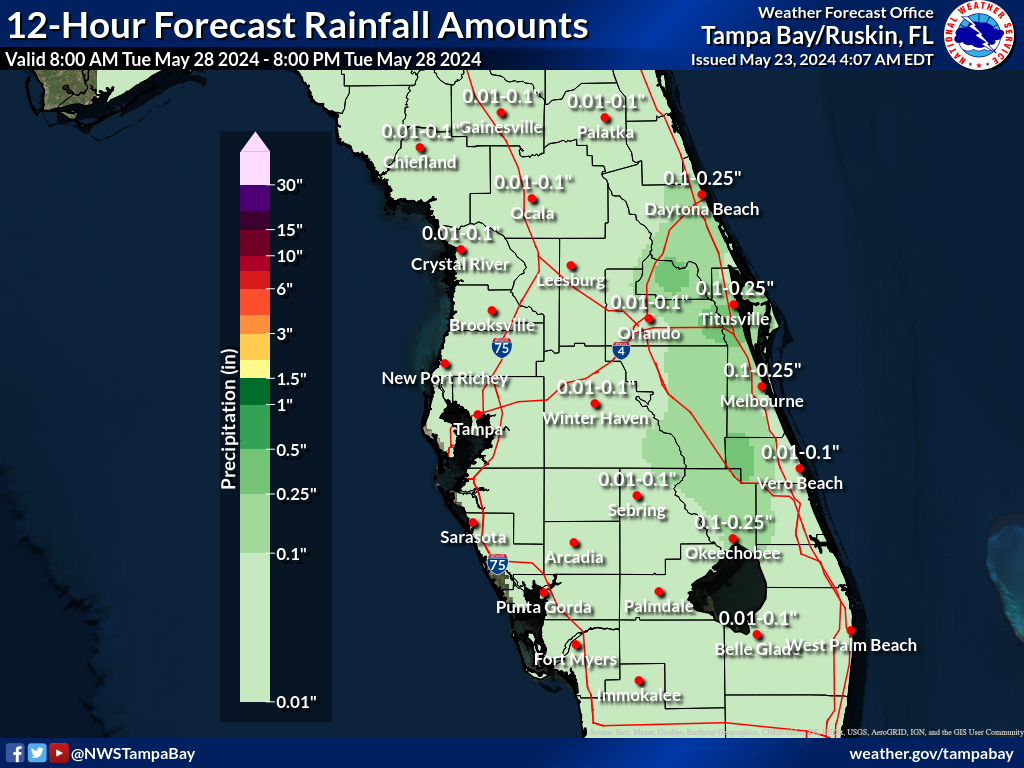 |
Night 6 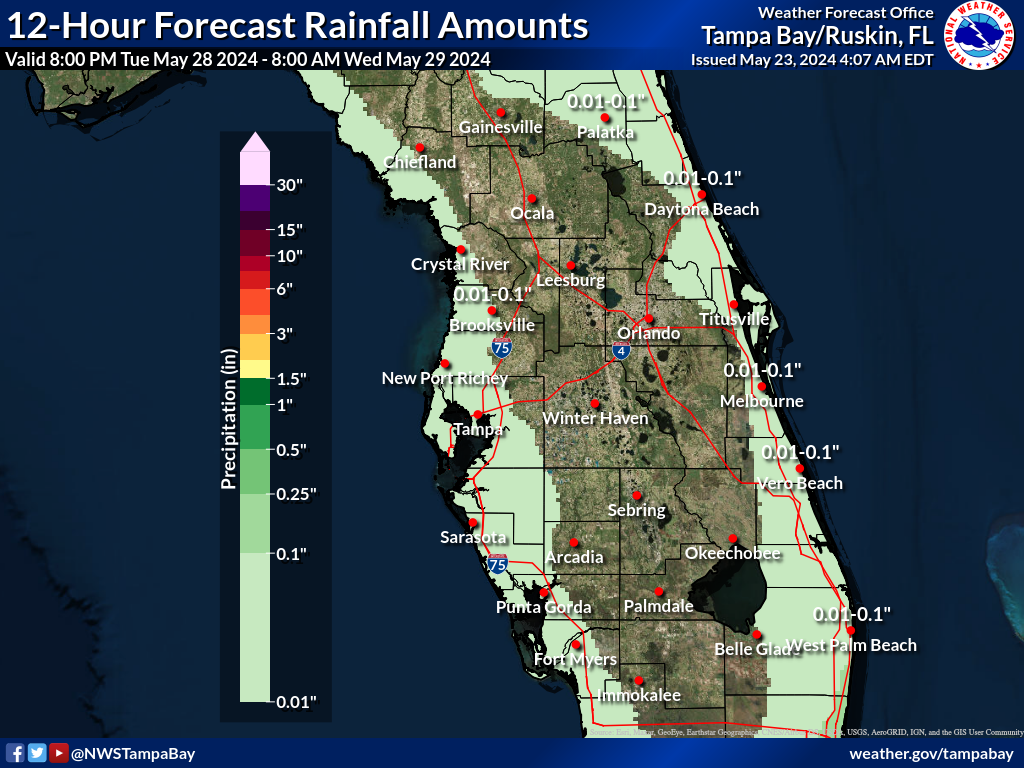 |
Day 7 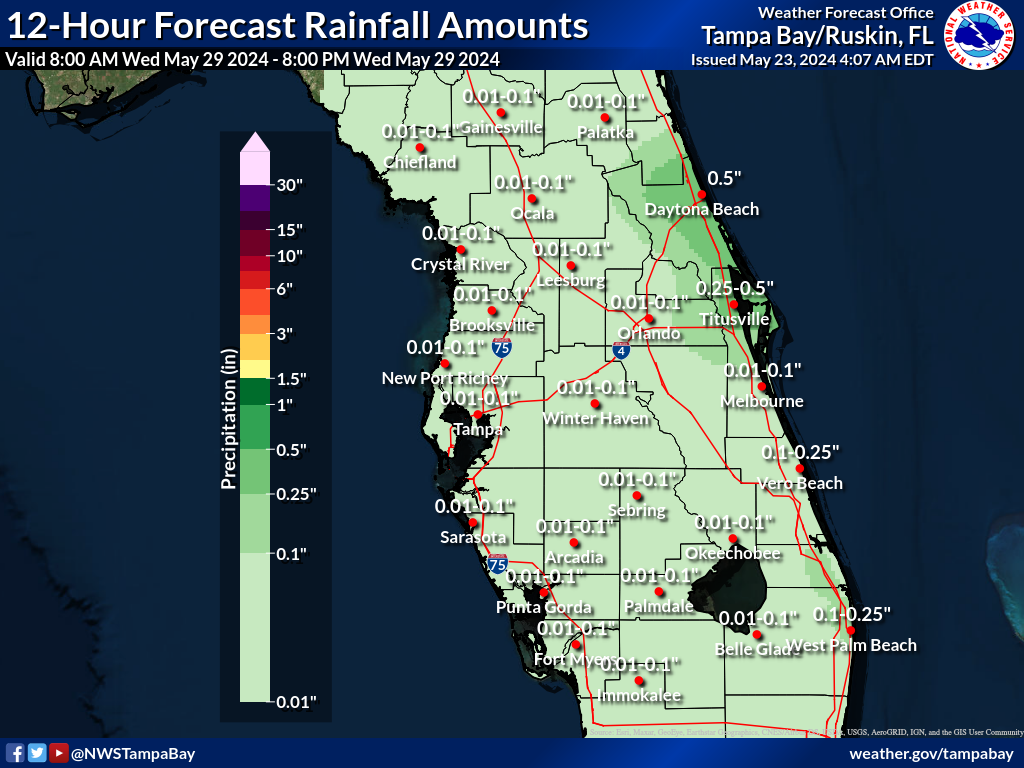 |
Night 7 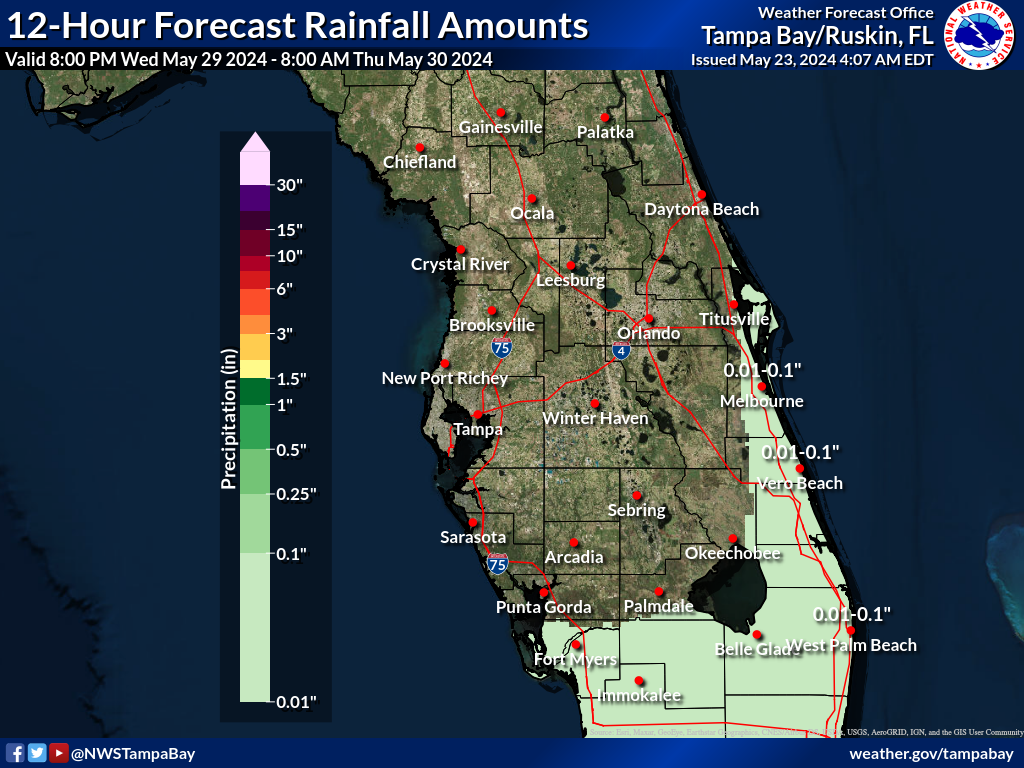 |
Greatest 12 Hour Possible Rainfall (in.)
These maps depict a reasonable upper-end rainfall amount for the time period shown on the graphic, based on many computer model simulations of possible rainfall totals. These higher amounts are an unlikely scenario, with only a 1 in 10, or 10% chance that more rain will fall, and a 9 in 10, or 90% chance that less rain will fall. These amounts can help serve as an upper-end scenario for planning purposes.
Day 1 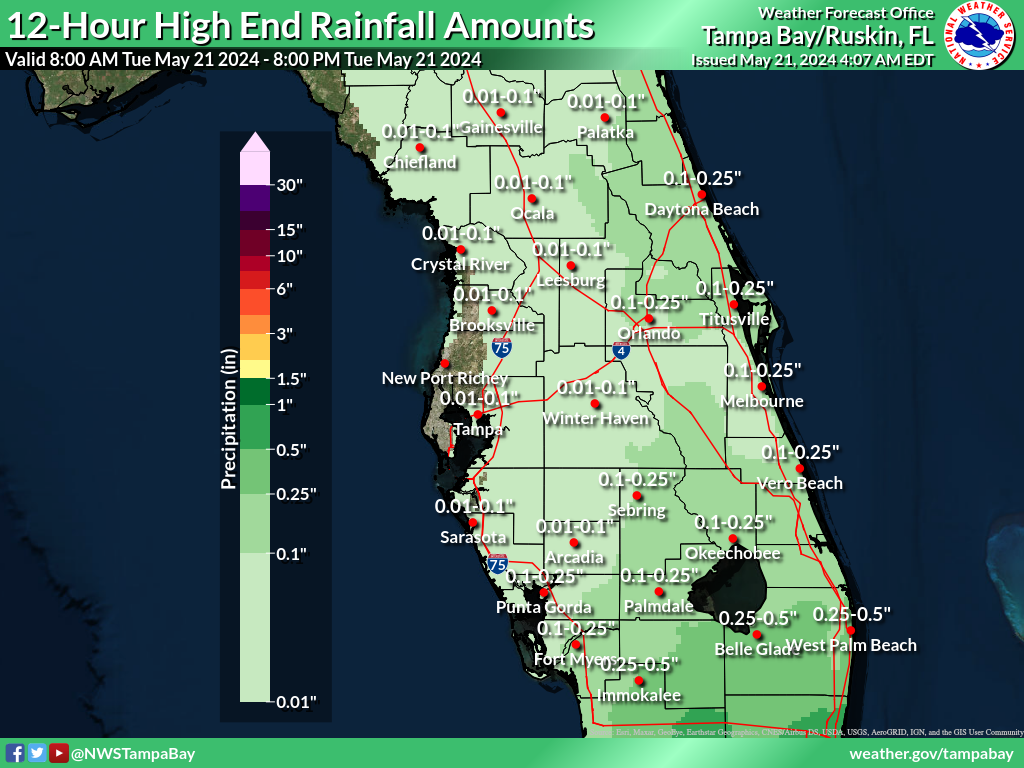 |
Night 1 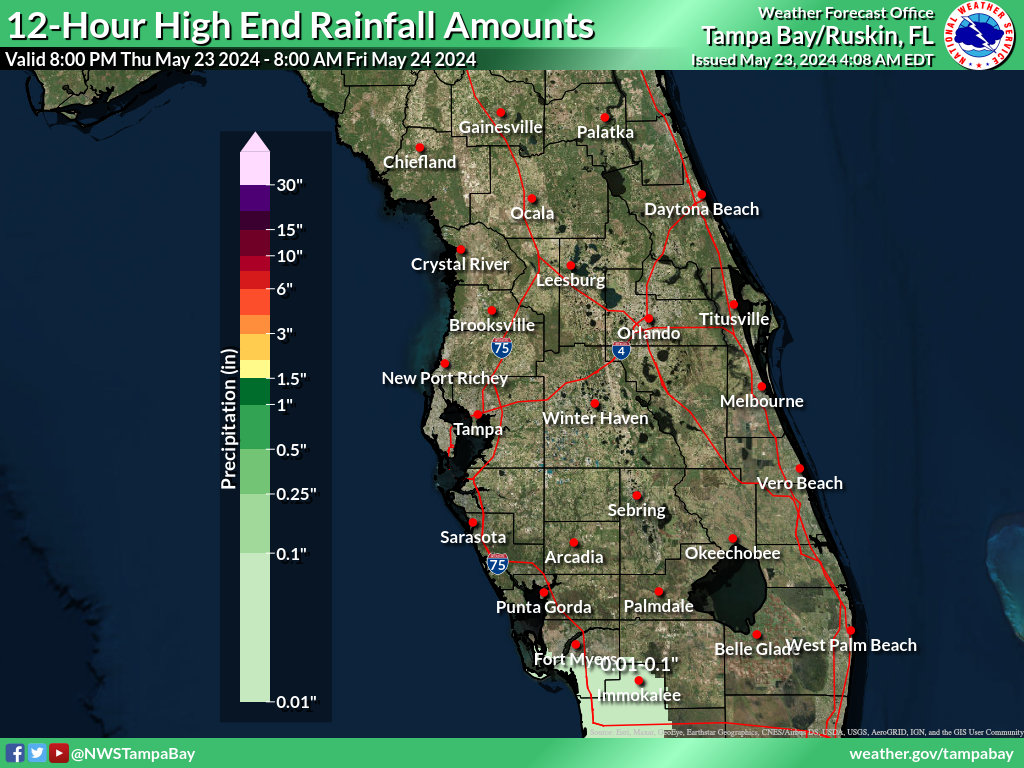 |
Day 2 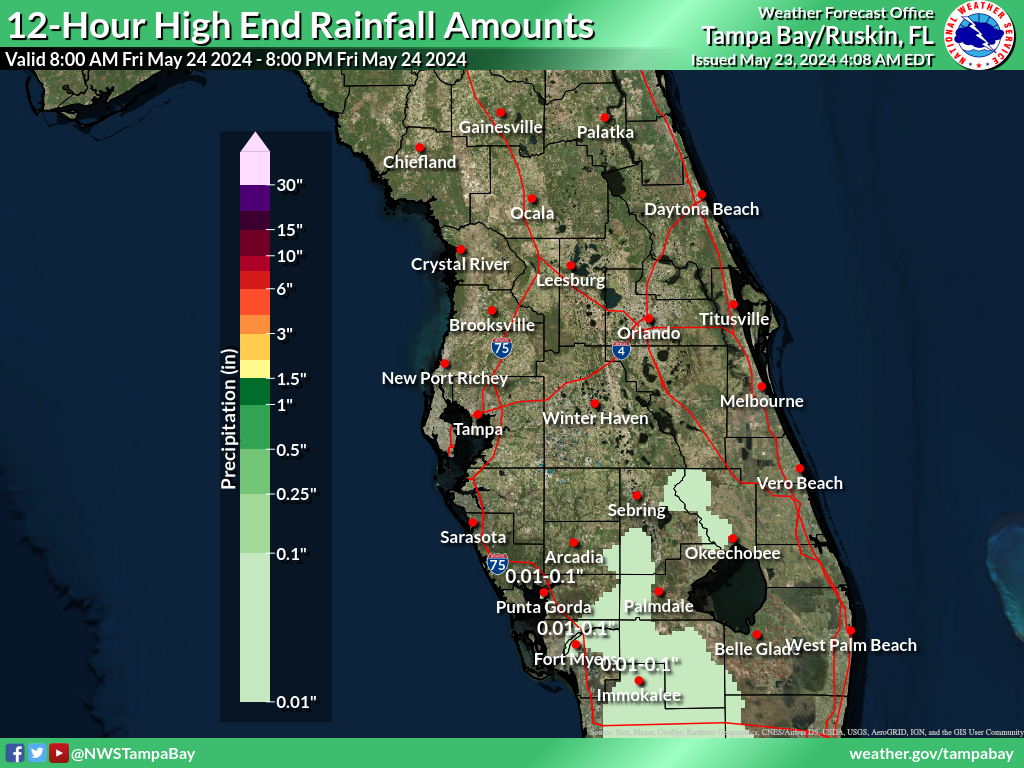 |
Night 2 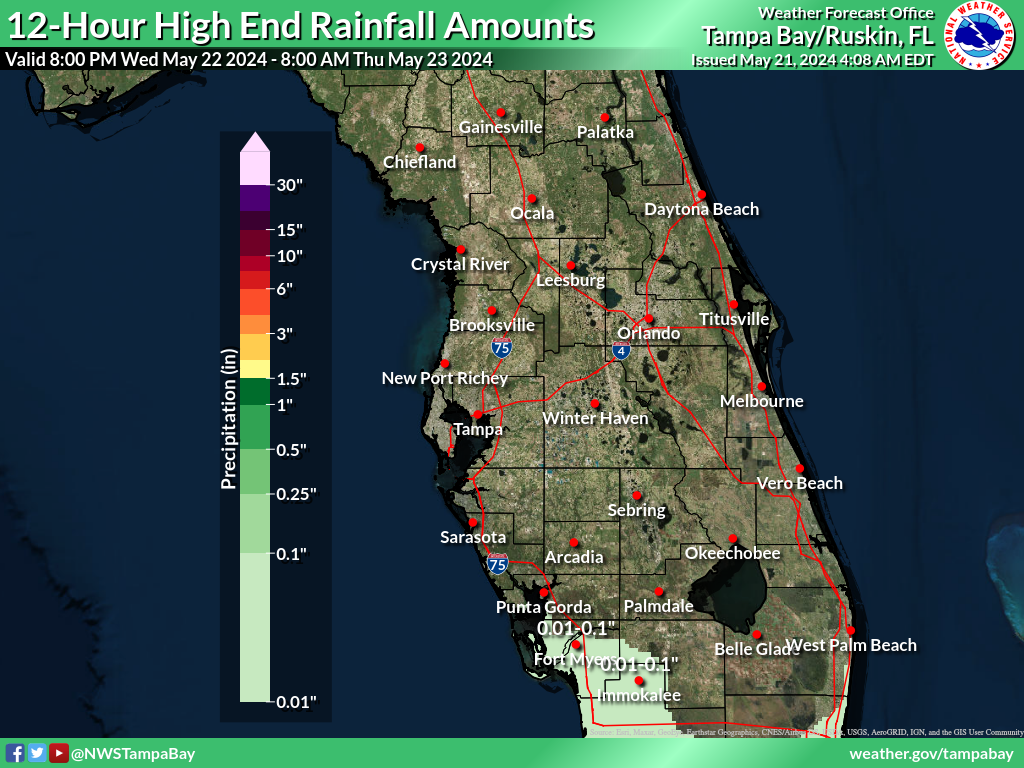 |
Day 3 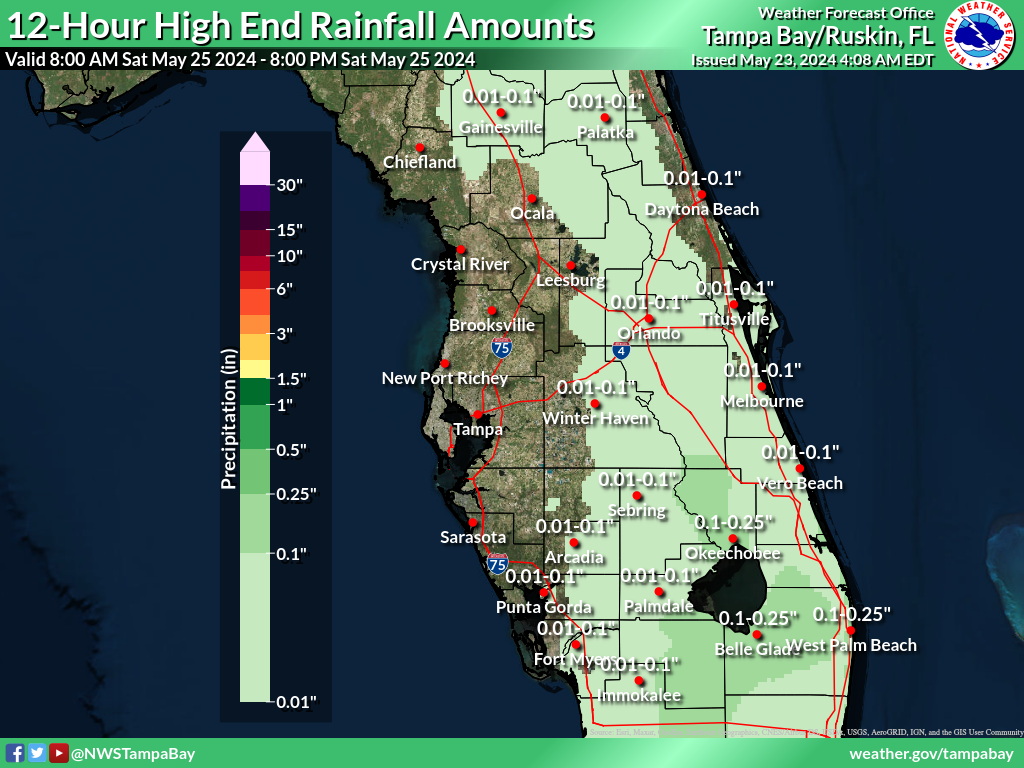 |
Night 3 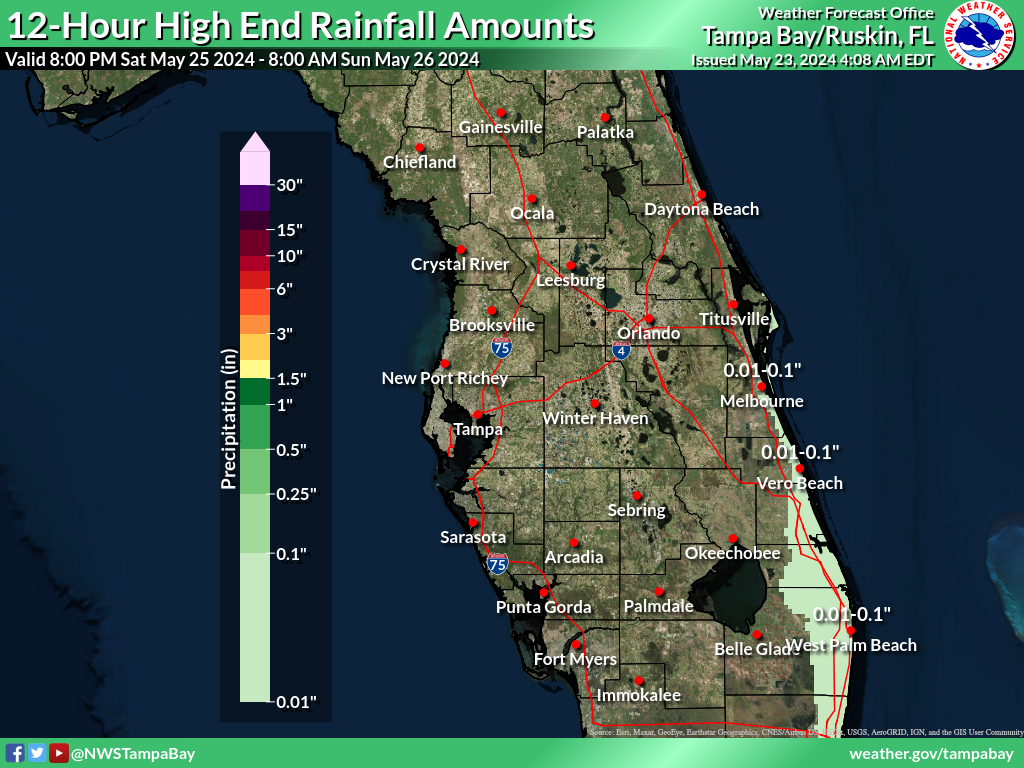 |
Day 4 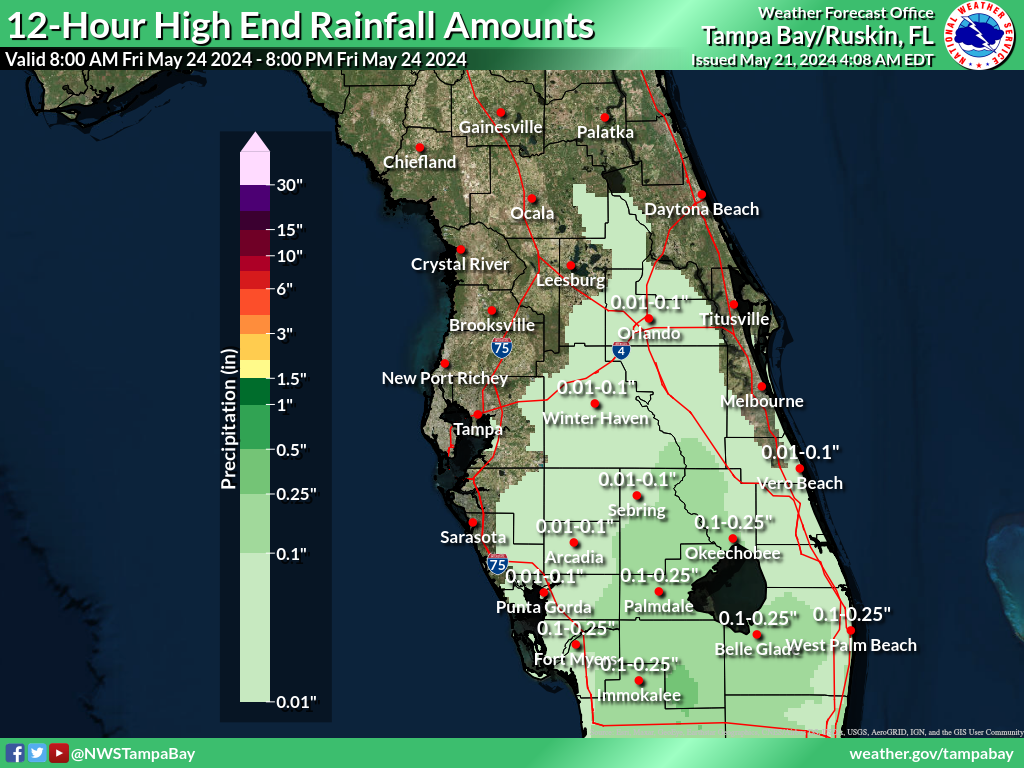 |
Night 4 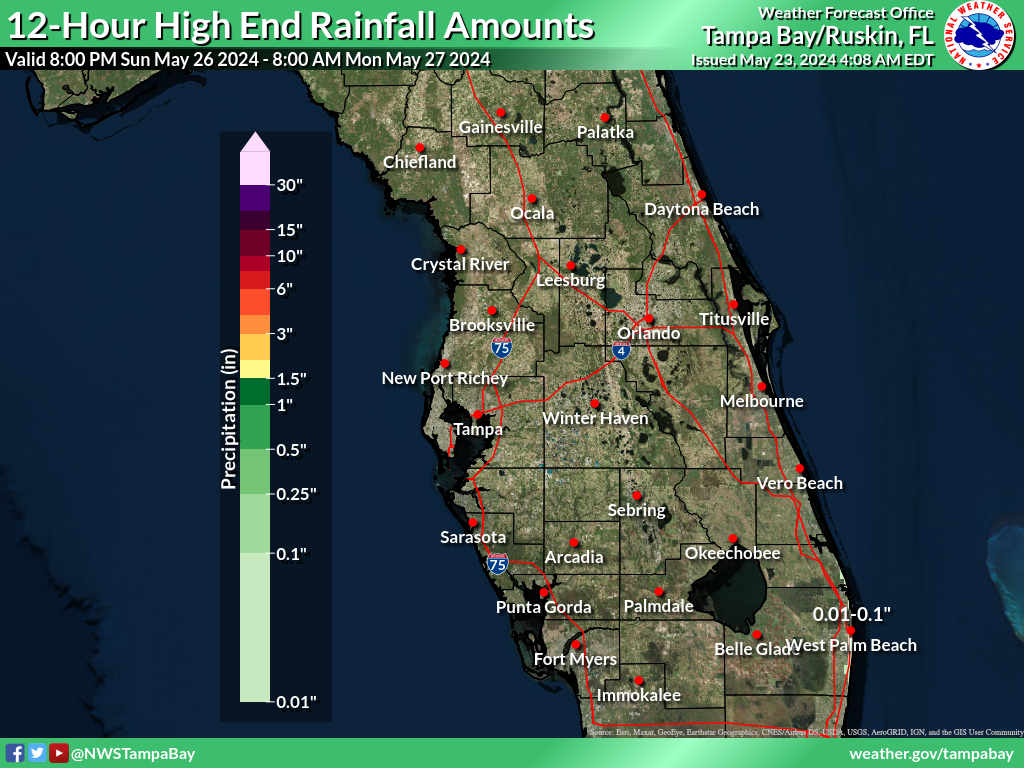 |
Day 5 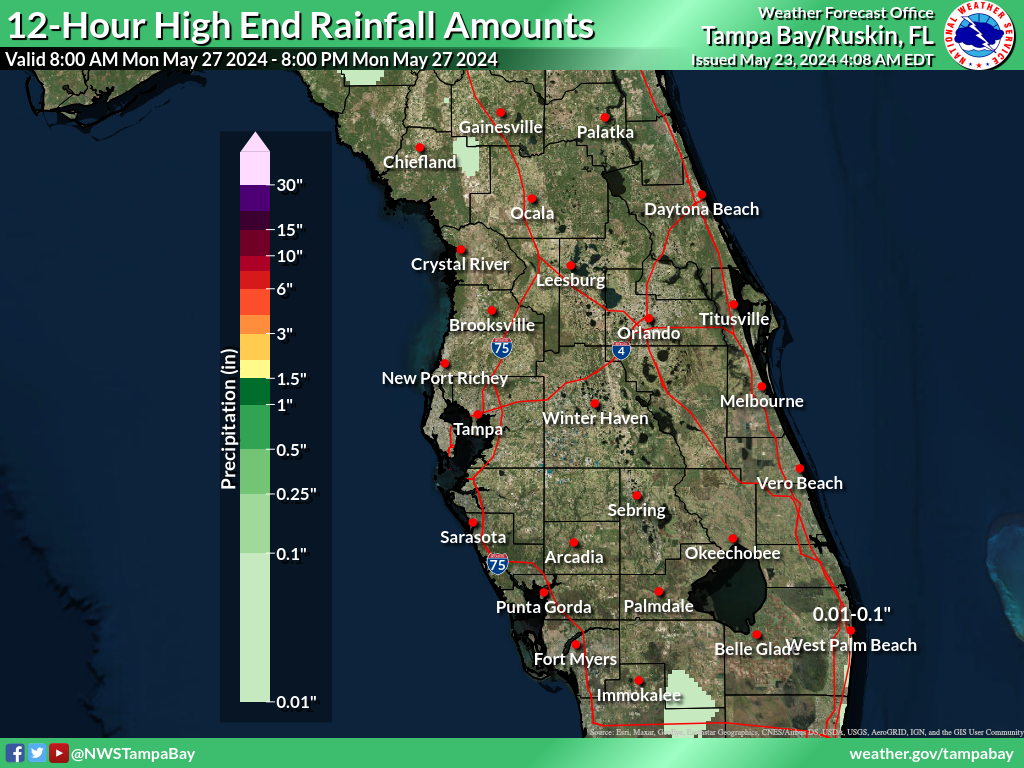 |
Night 5 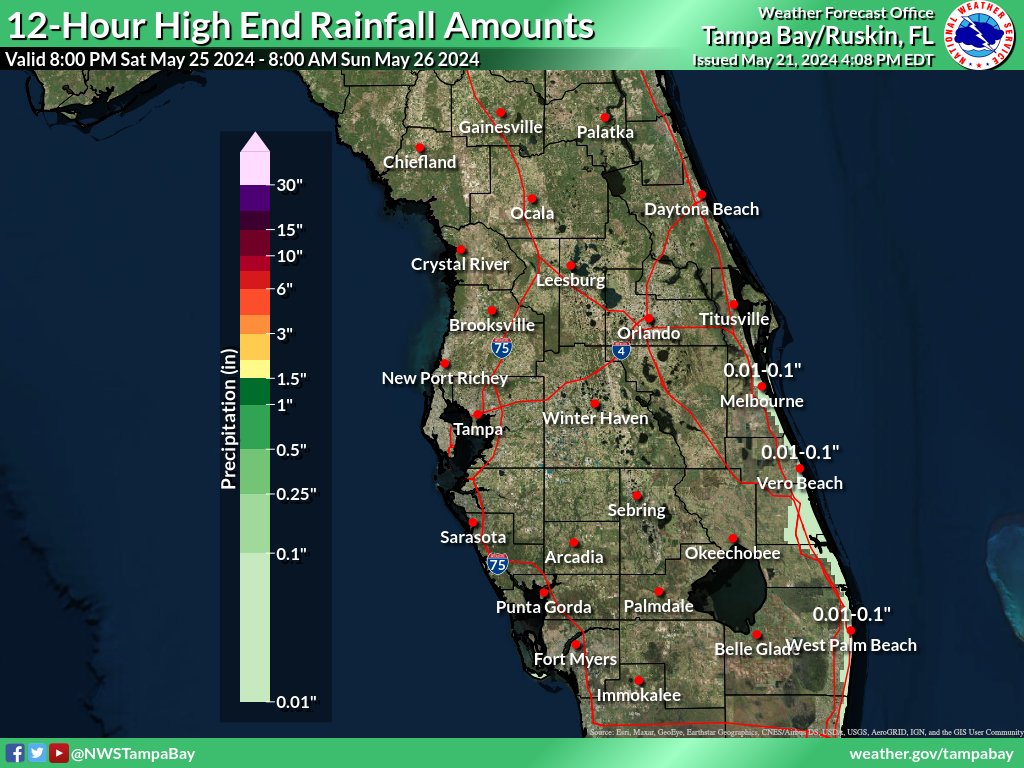 |
Day 6 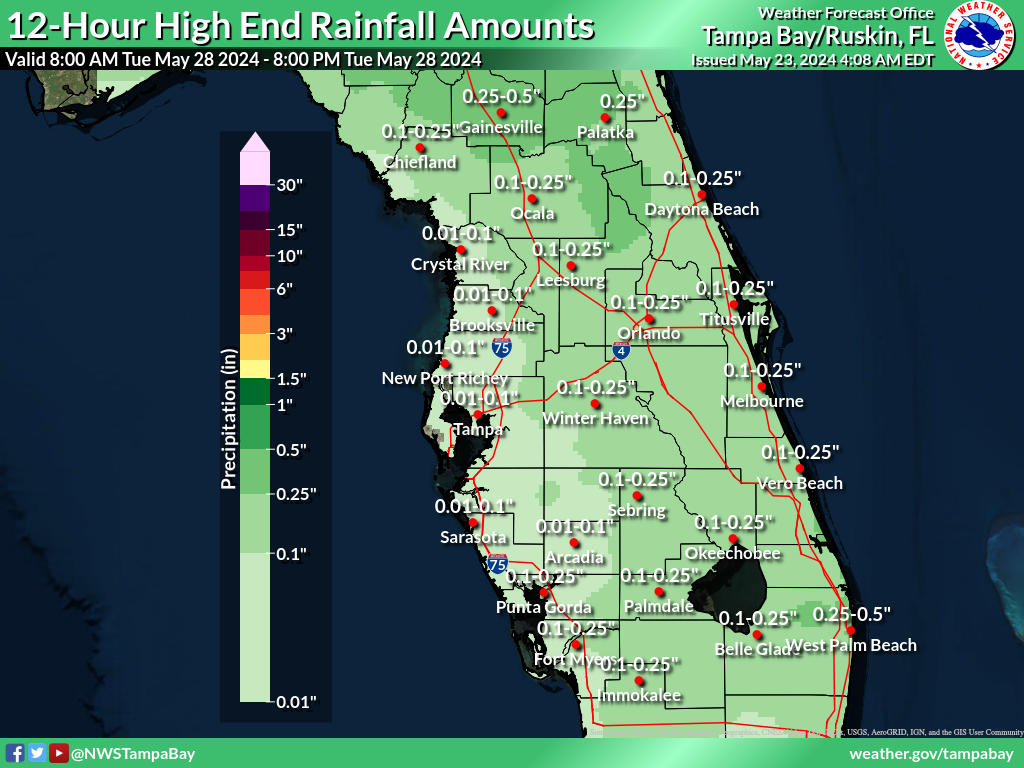 |
Night 6 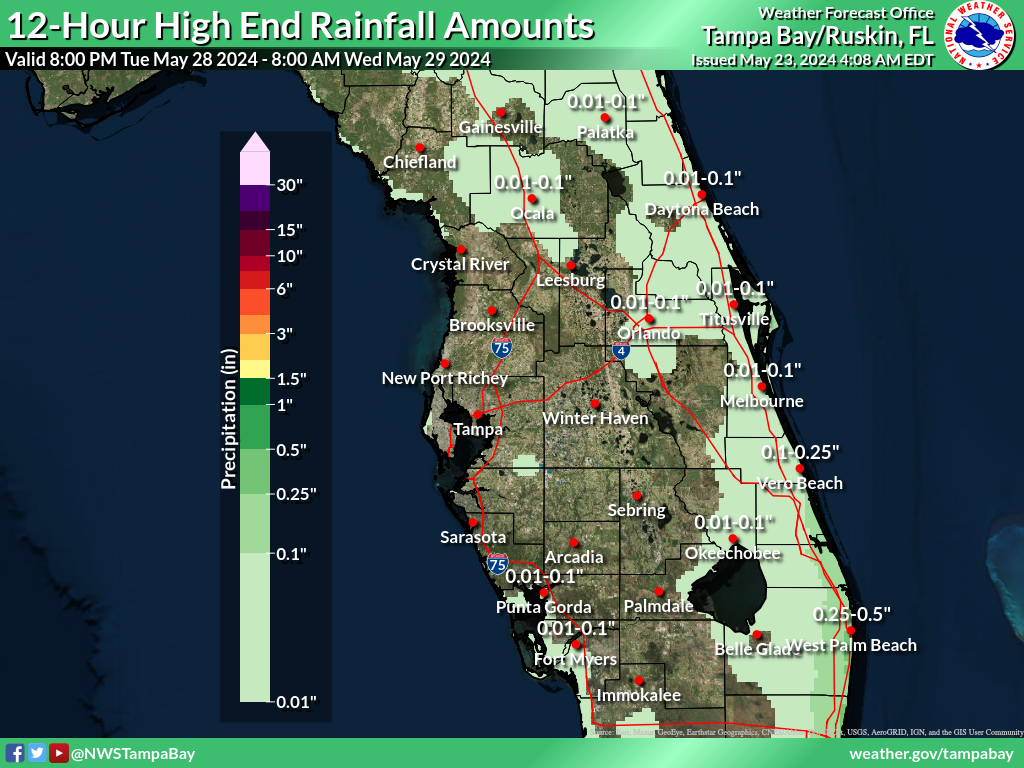 |
Day 7 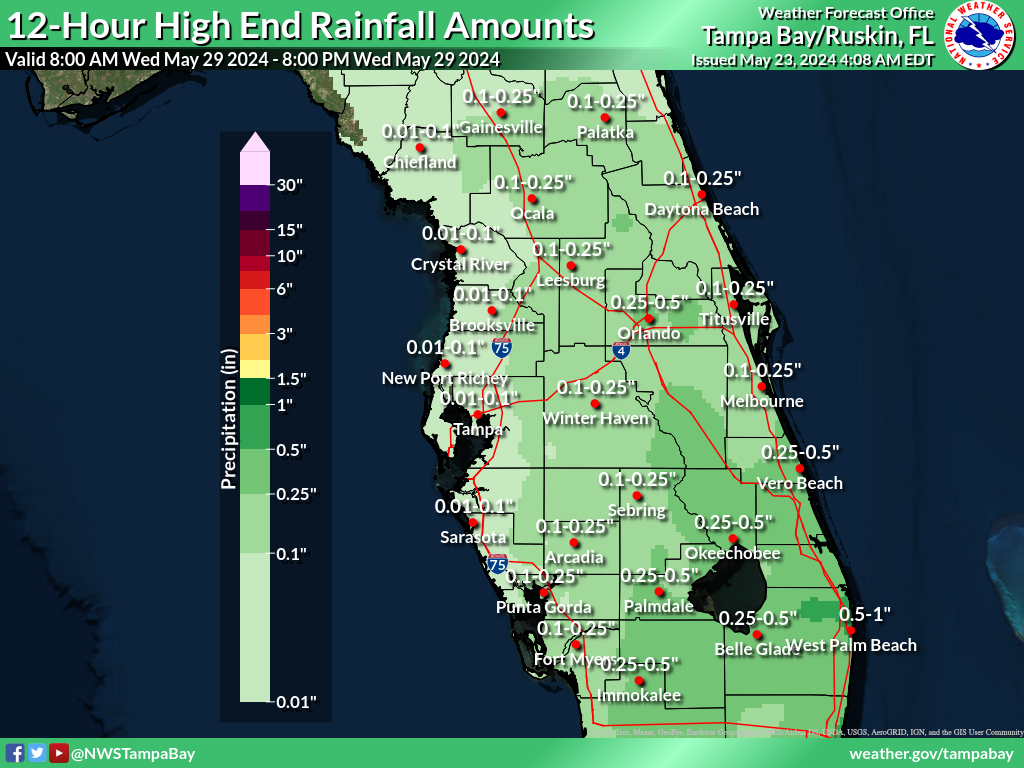 |
Night 7 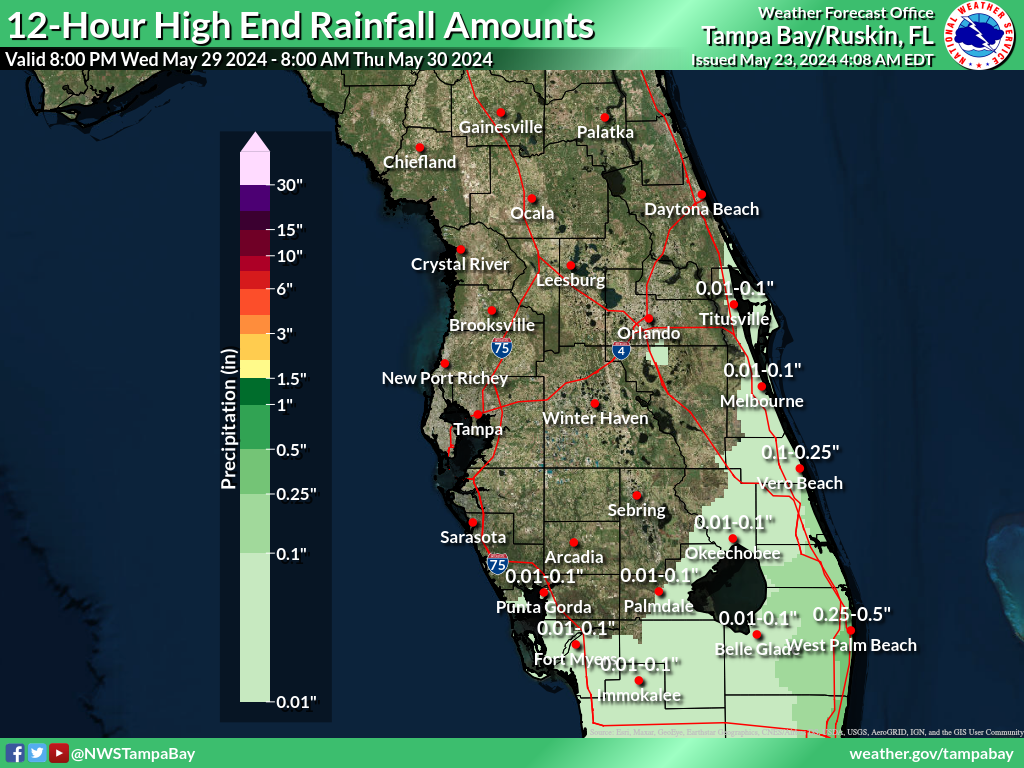 |
Least Possible 12 Hour Rainfall (in.)
These maps depict a reasonable lower-end rainfall amount for the time period shown on the graphic, based on many computer model simulations of possible rainfall totals. These lower amounts are an unlikely scenario, with a 9 in 10, or 90% chance that more rain will fall, and only a 1 in 10, or 10% chance that less rain will fall. These amounts can help serve as a lower-end scenario for planning purposes. On many occasions these graphics will be blank, which depicts that the low end is for no measurable rainfall.
Day 1 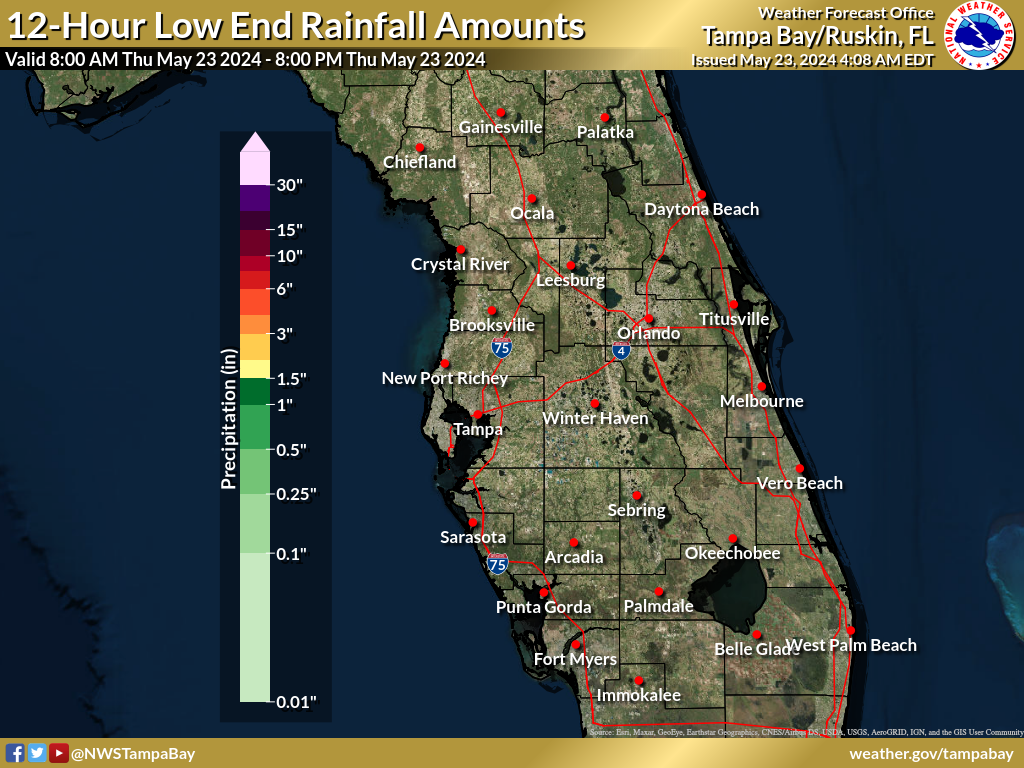 |
Night 1 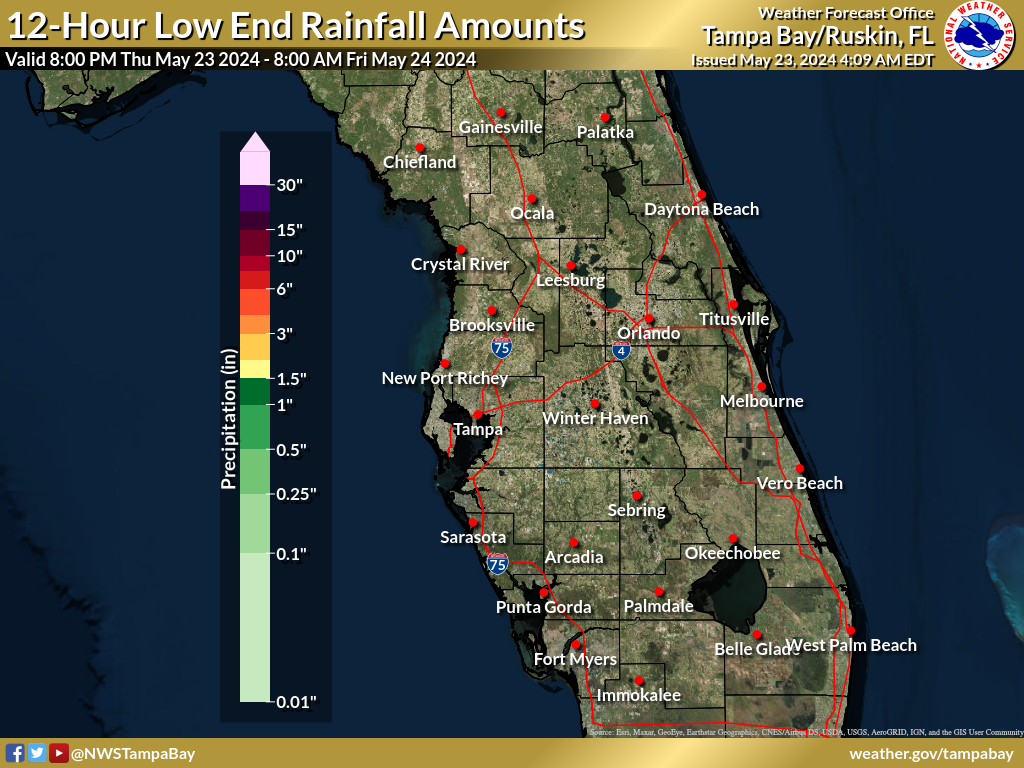 |
Day 2 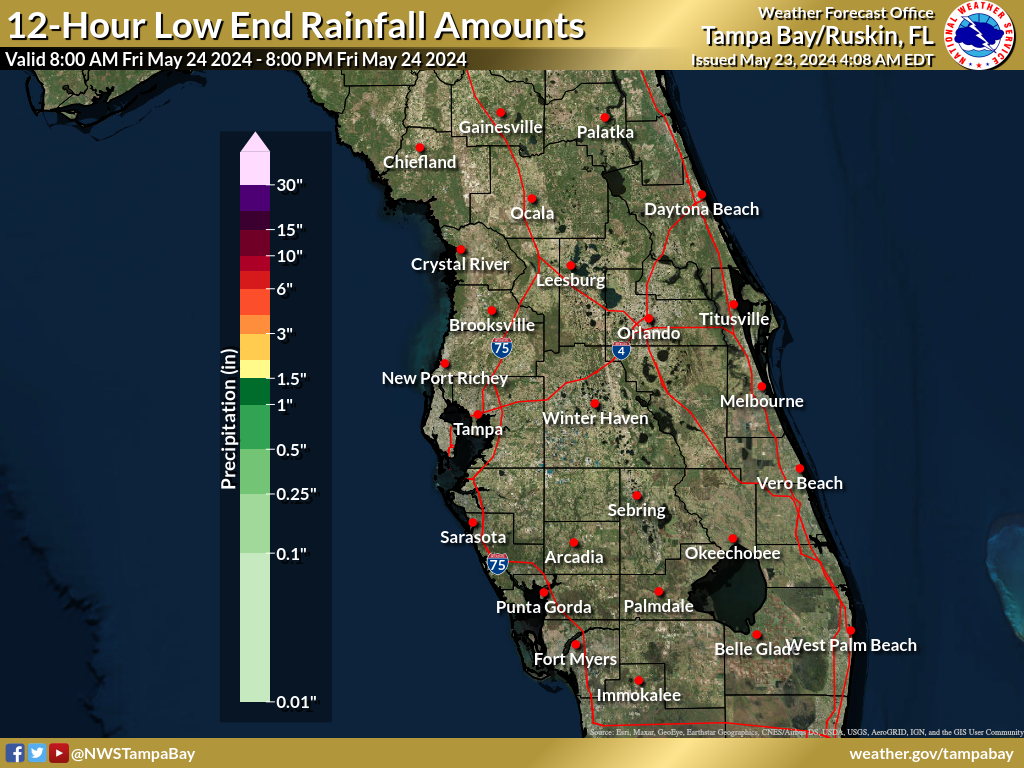 |
Night 2 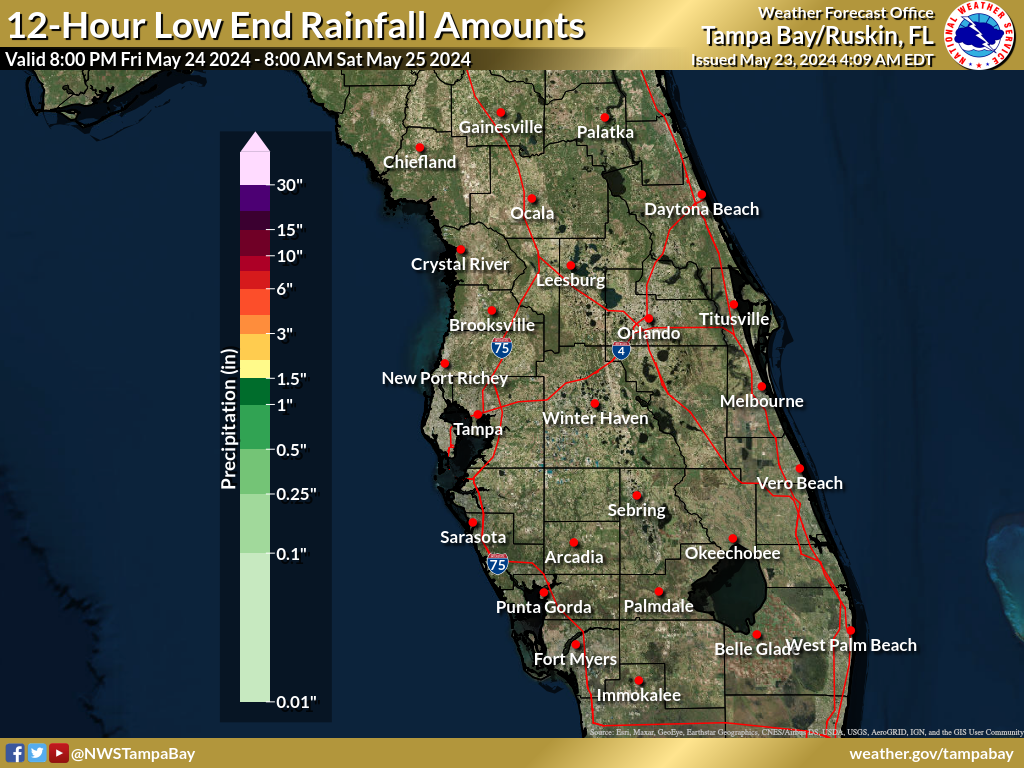 |
Day 3 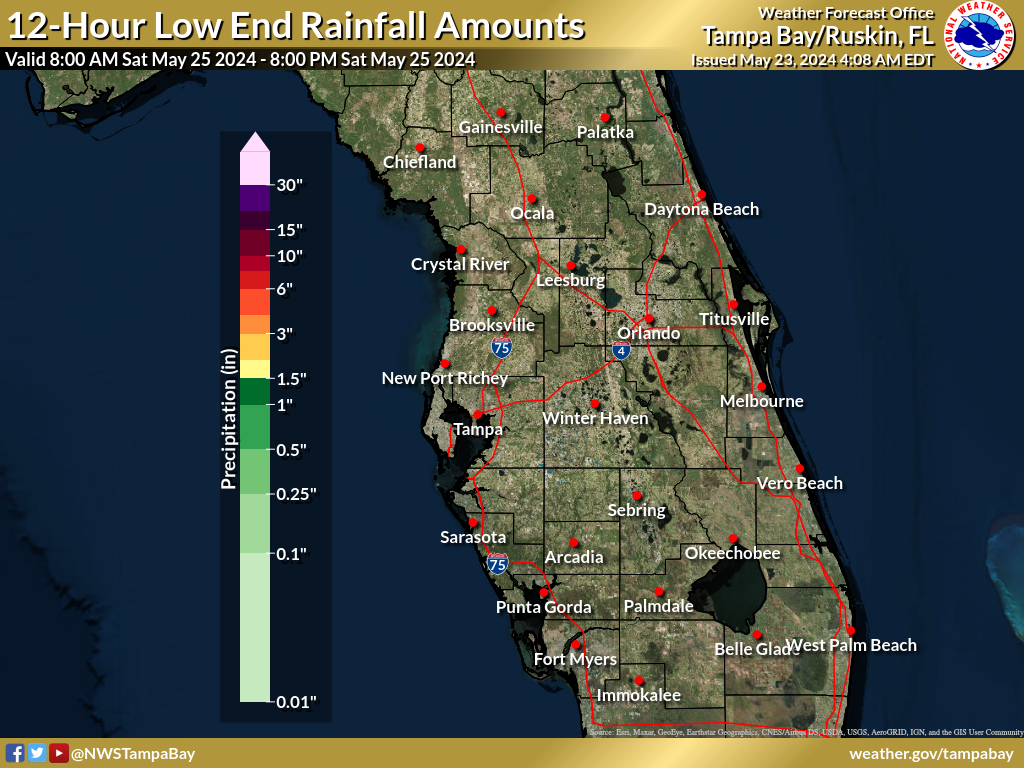 |
Night 3 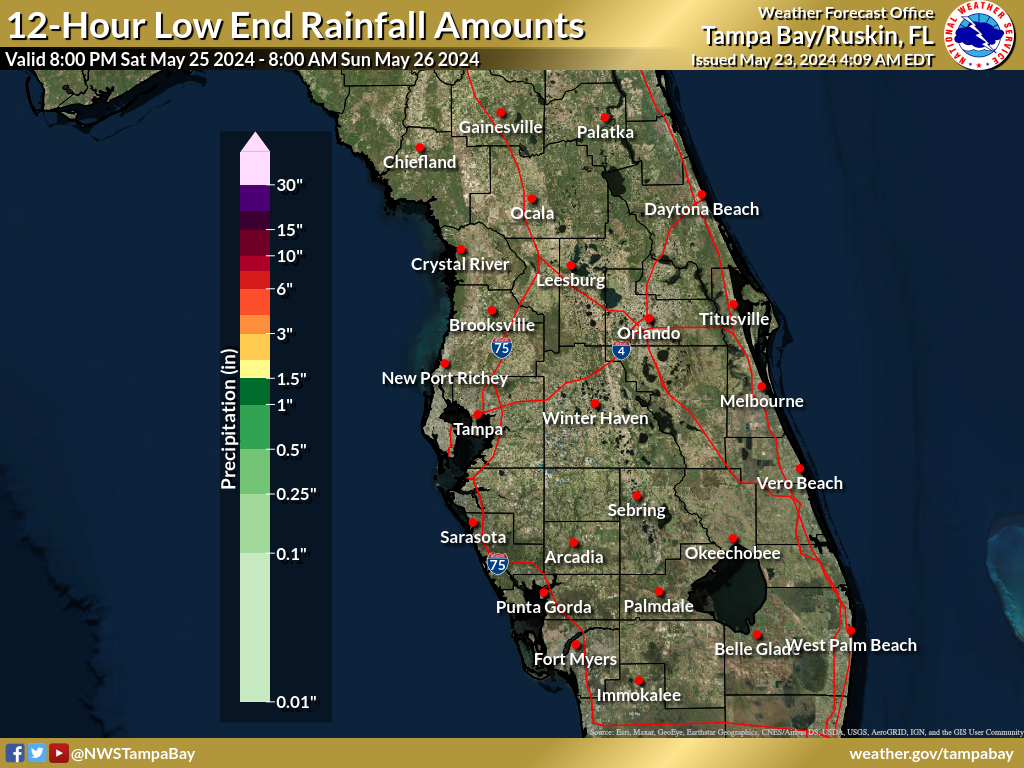 |
Day 4 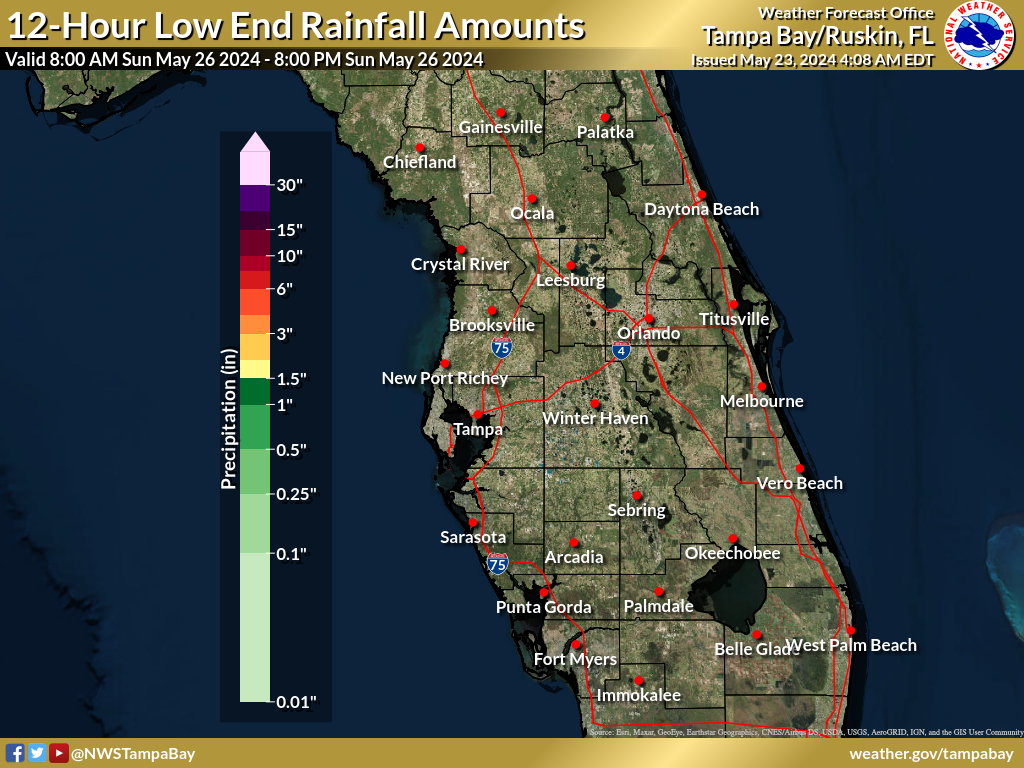 |
Night 4 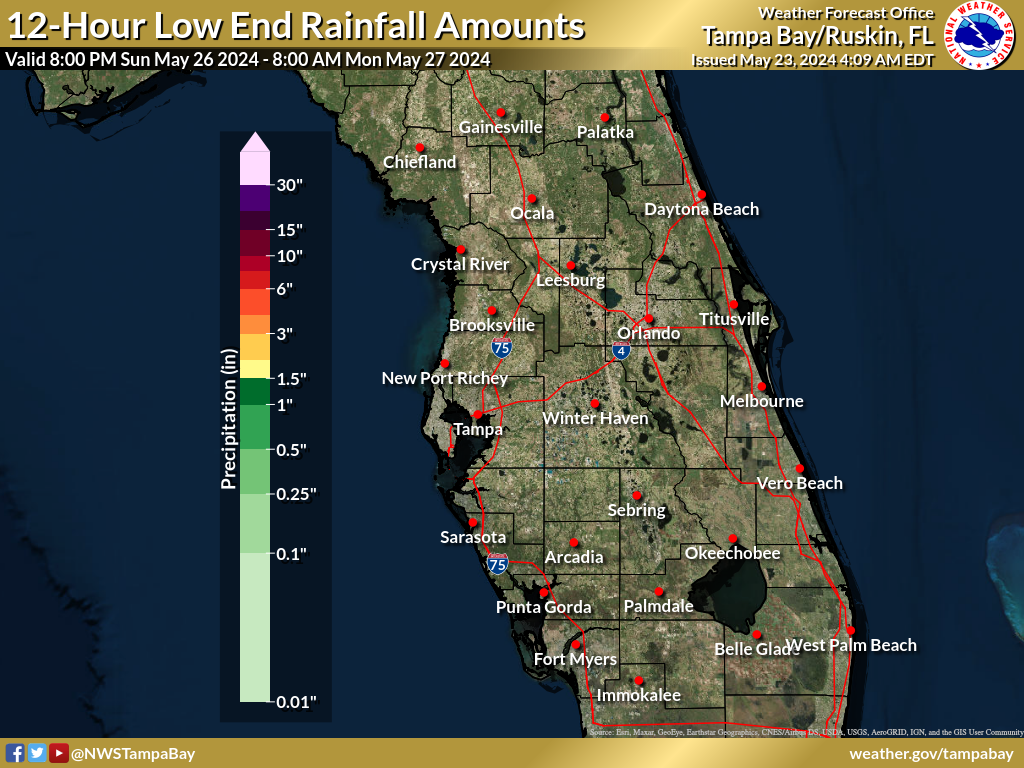 |
Day 5 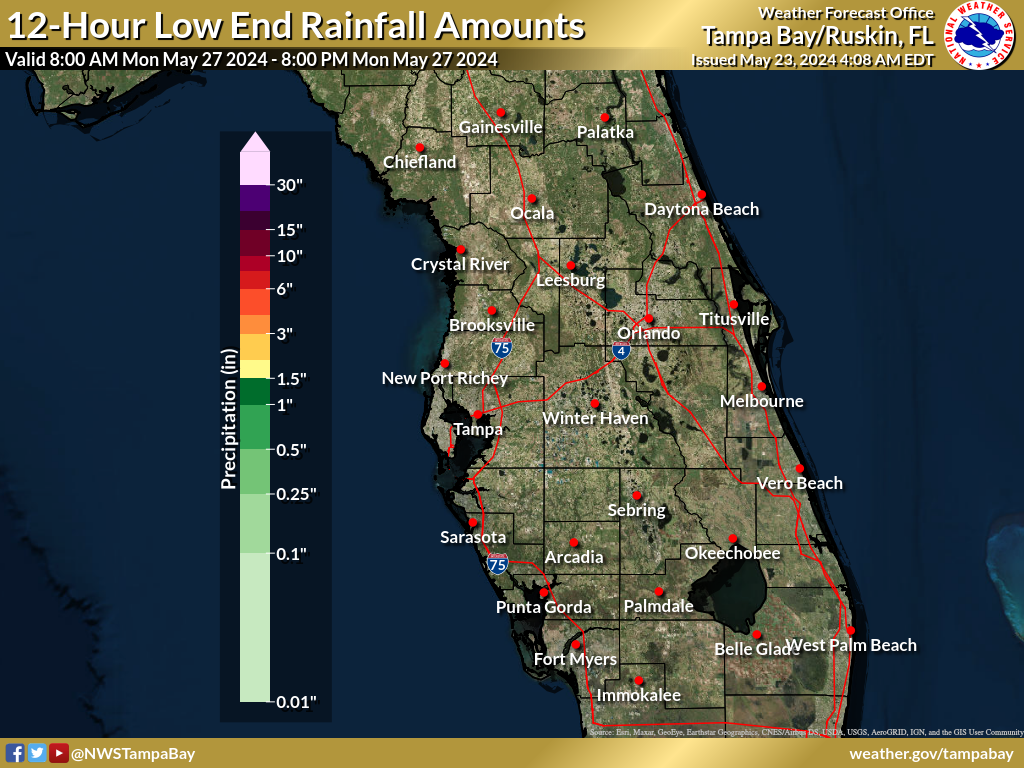 |
Night 5 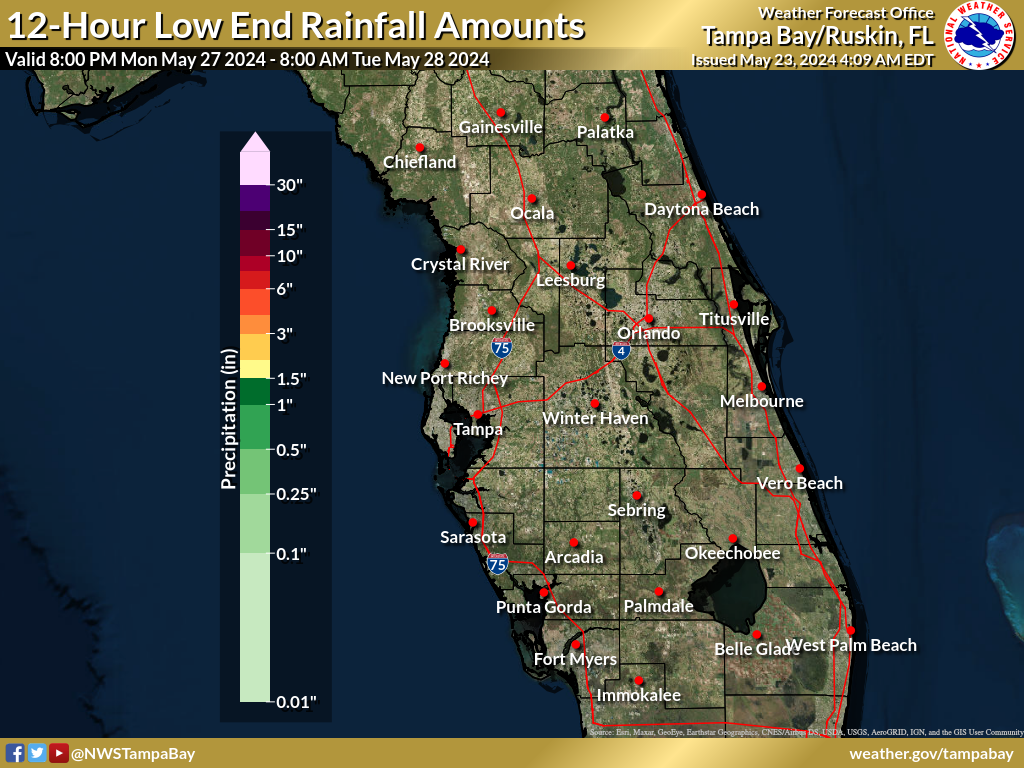 |
Day 6 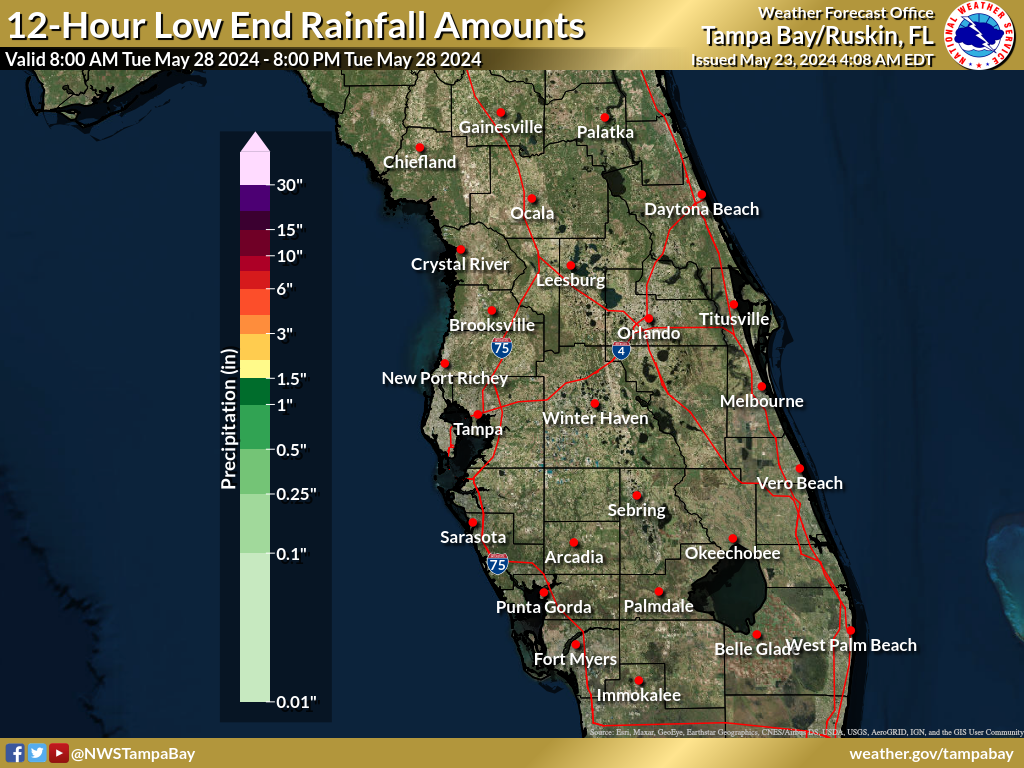 |
Night 6 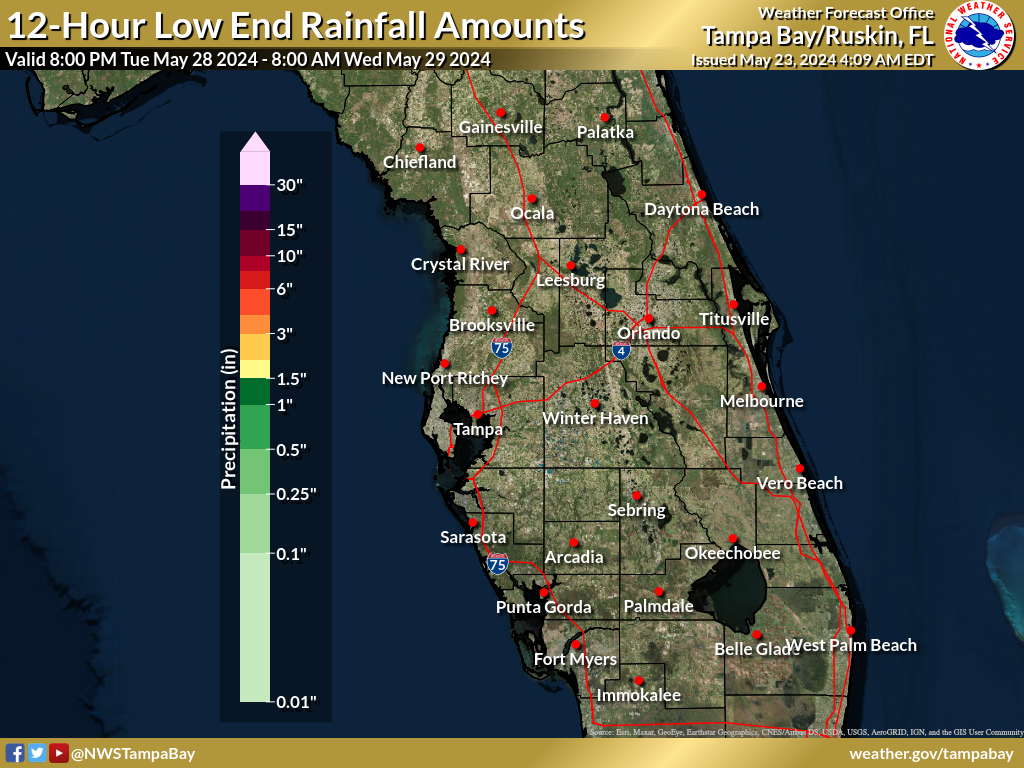 |
Day 7 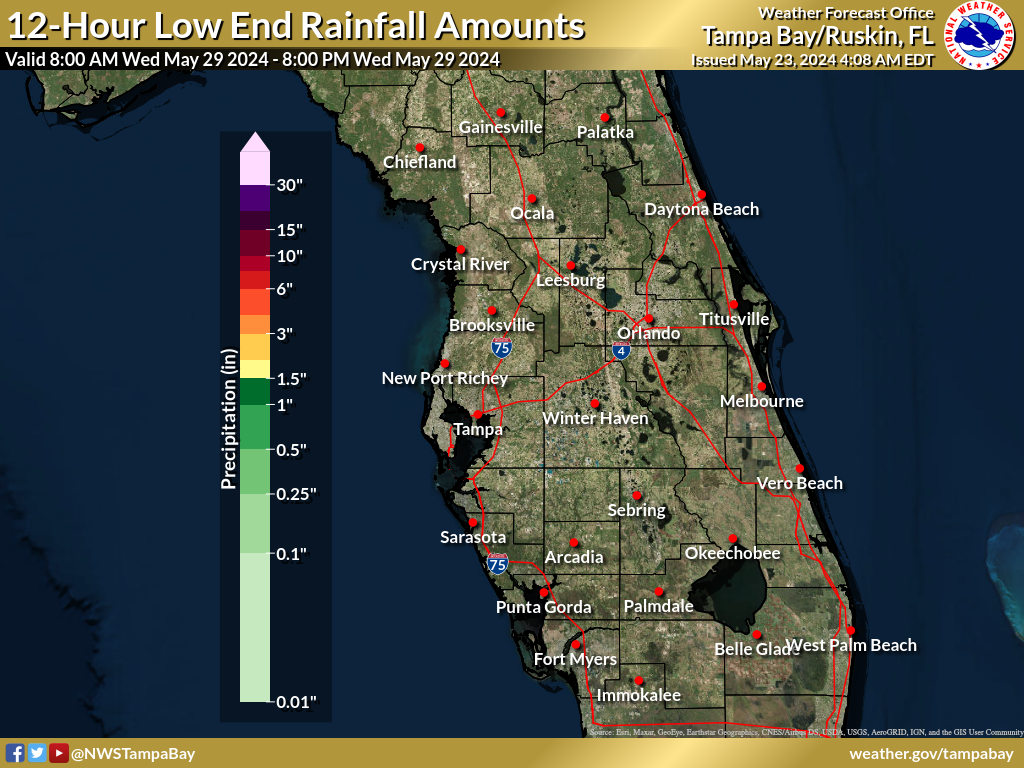 |
Night 7 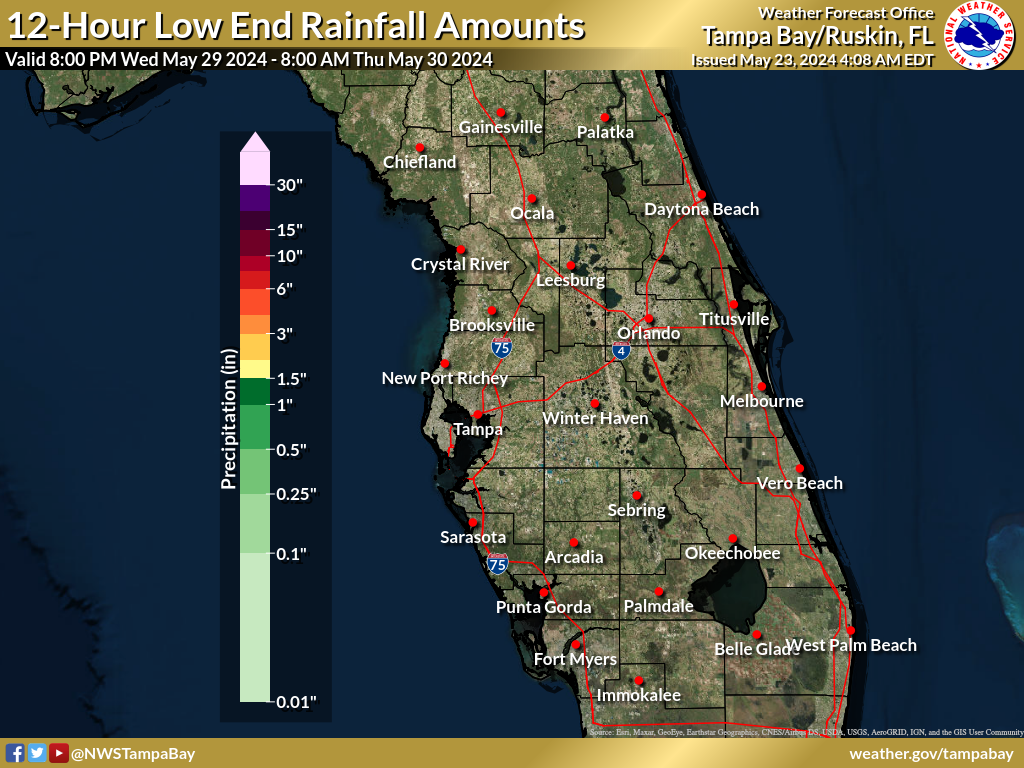 |
Expected 24 Hour Rainfall (in.)
These maps are the official NWS rainfall forecast in inches during the time period shown on the graphic. These rainfall amounts are determined by NWS forecasters to be the most likely outcome based on evaluation of data from computer models, satellite, radar, and other observations.
Day 1 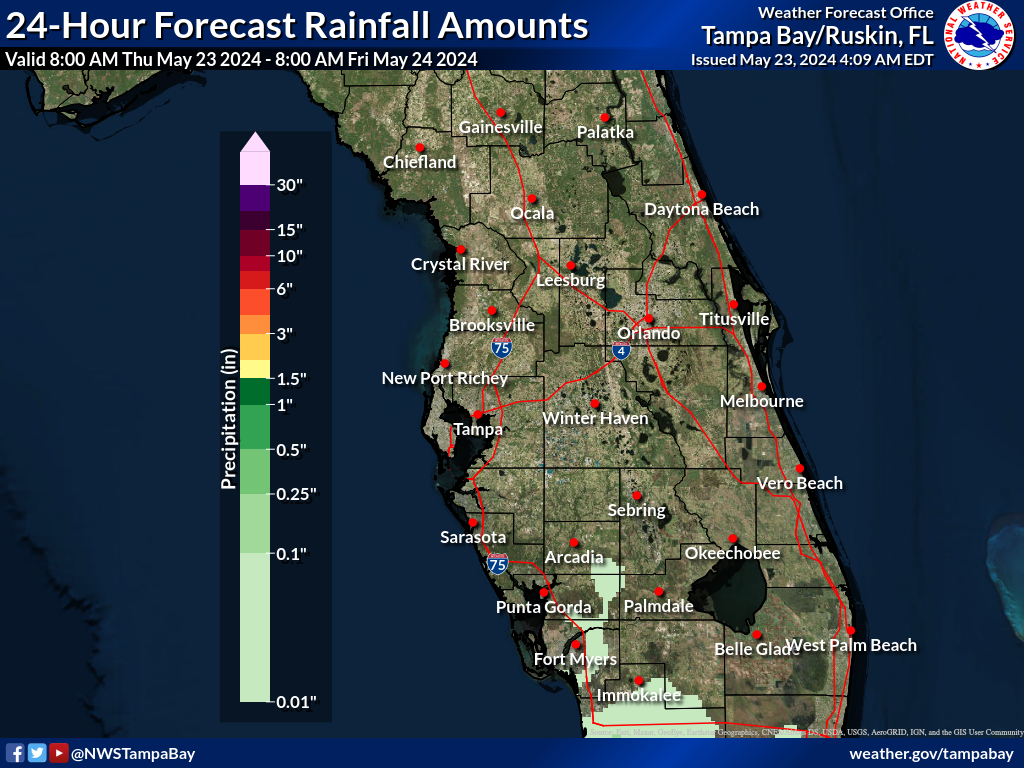 |
Day 2 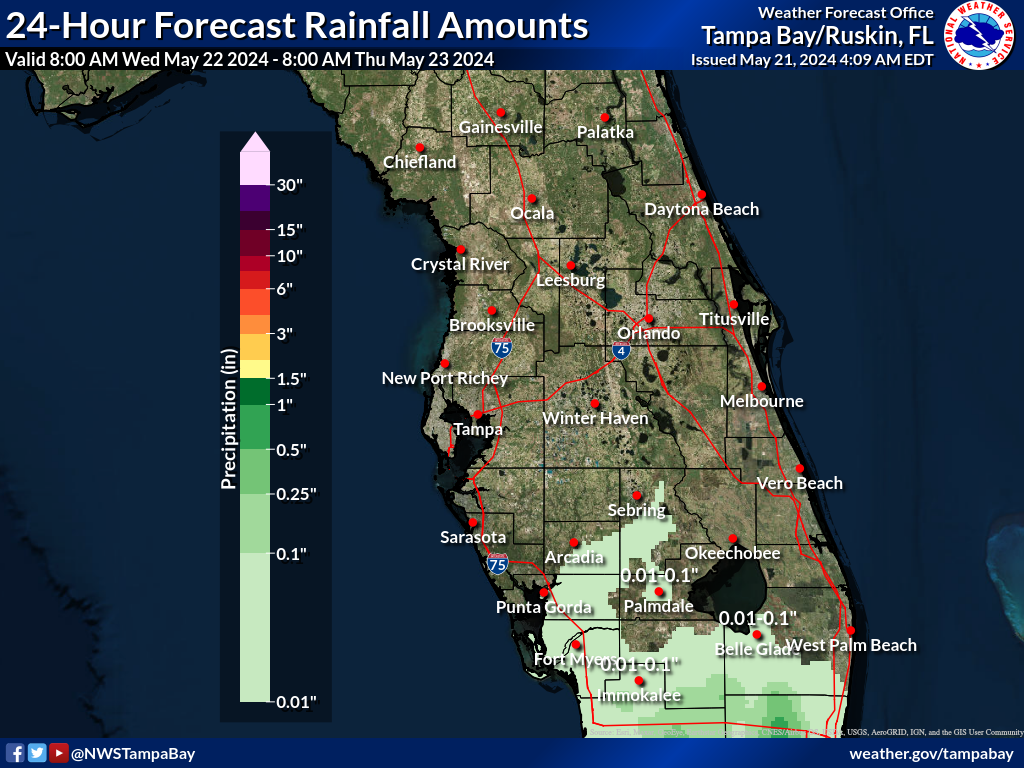 |
Day 3 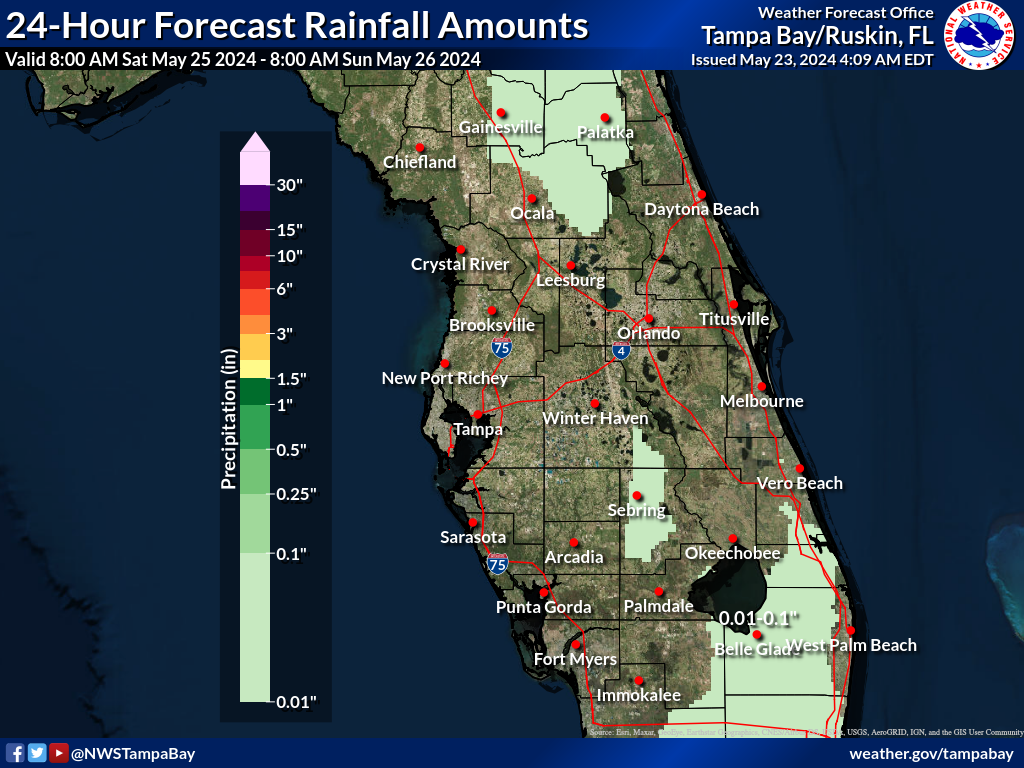 |
Day 4 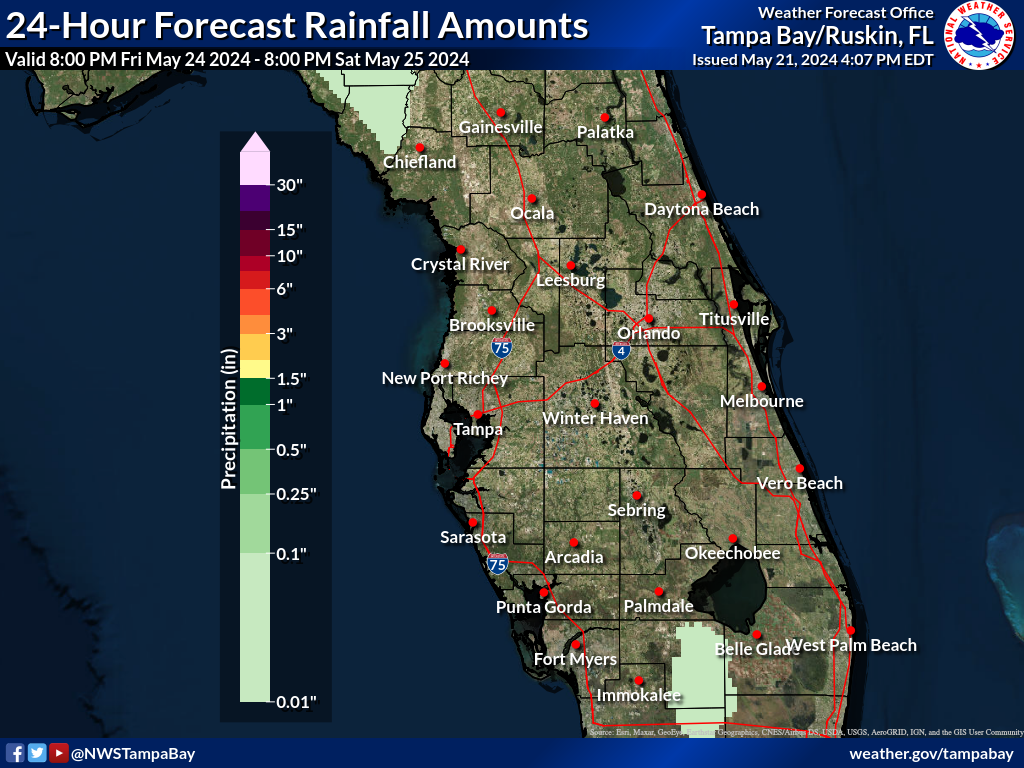 |
Day 5 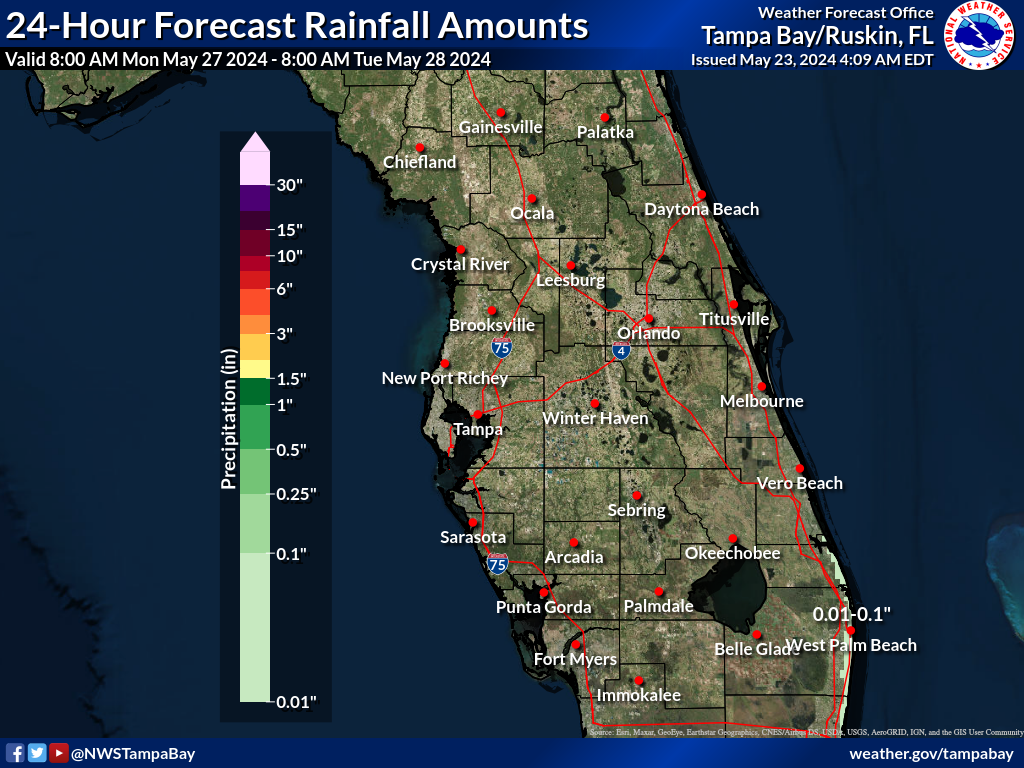 |
Day 6 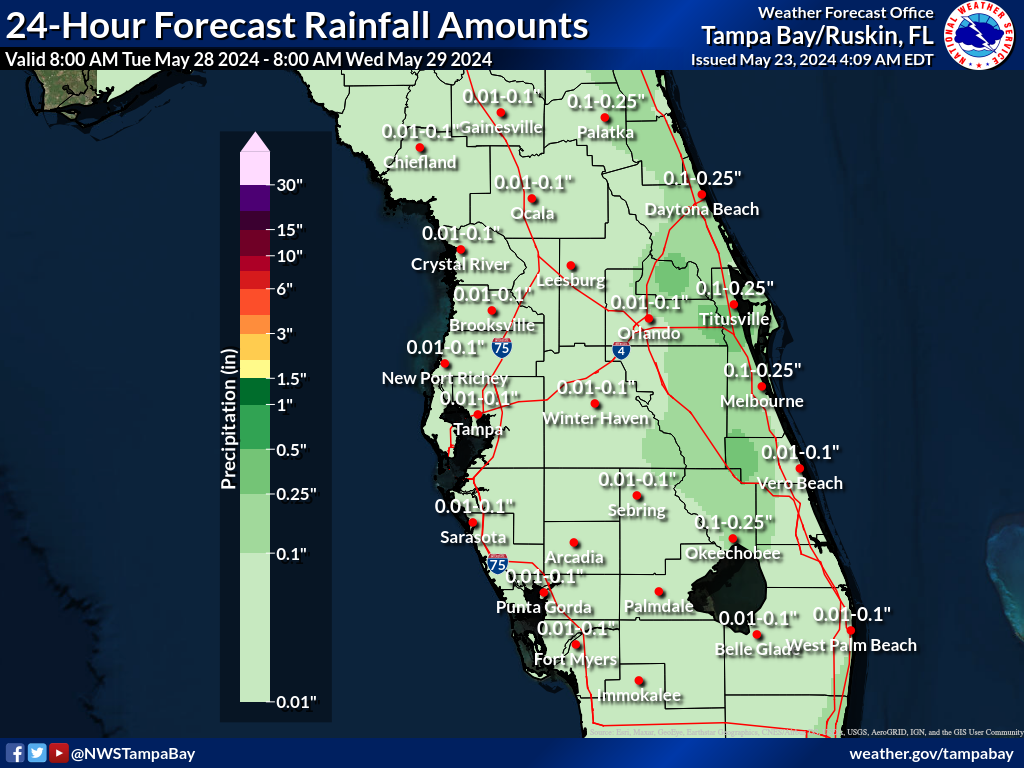 |
Day 7 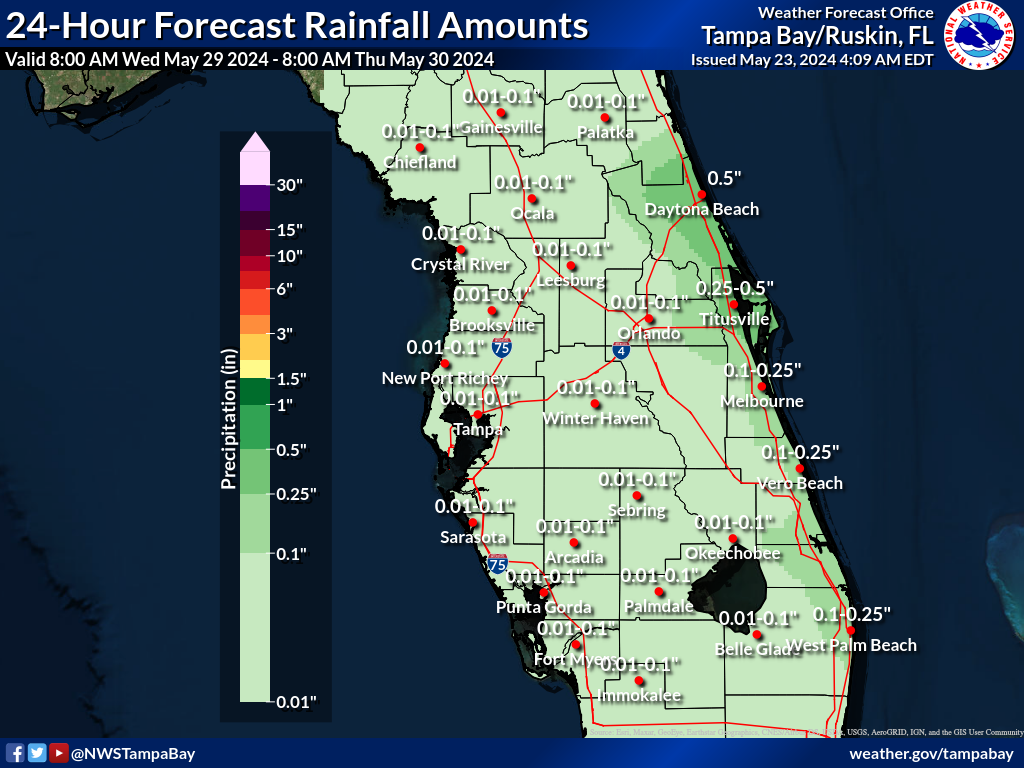 |
Greatest 24 Hour Possible Rainfall (in.)
These maps depict a reasonable upper-end rainfall amount for the time period shown on the graphic, based on many computer model simulations of possible rainfall totals. These higher amounts are an unlikely scenario, with only a 1 in 10, or 10% chance that more rain will fall, and a 9 in 10, or 90% chance that less rain will fall. These amounts can help serve as an upper-end scenario for planning purposes.
Day 1 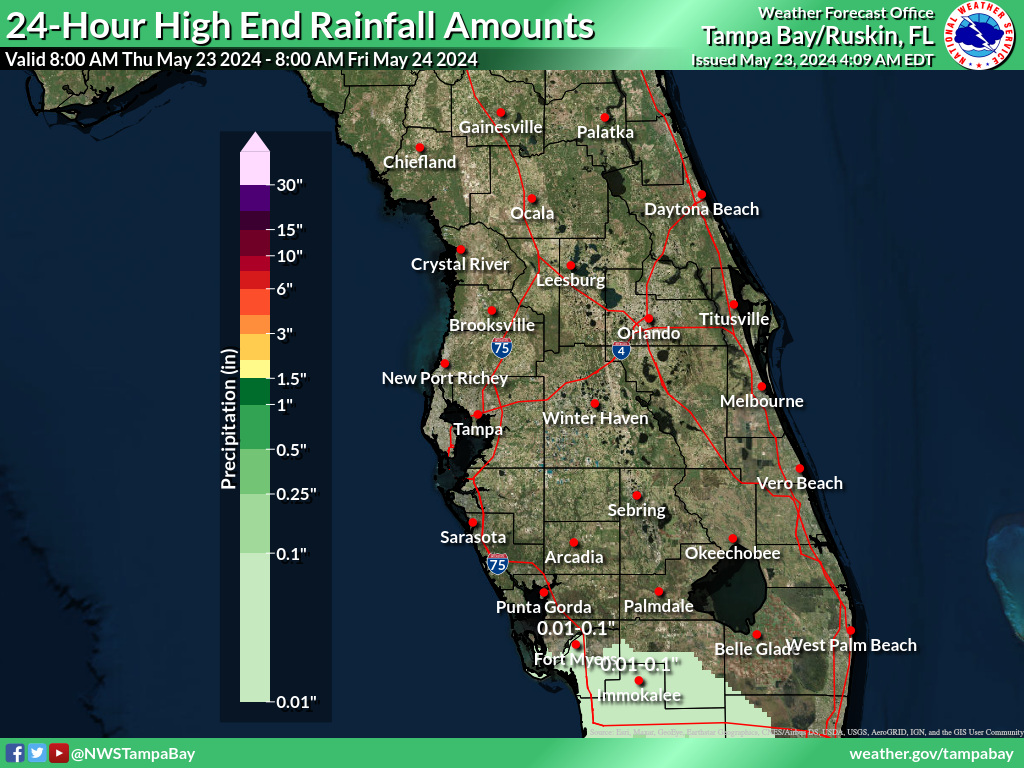 |
Day 2 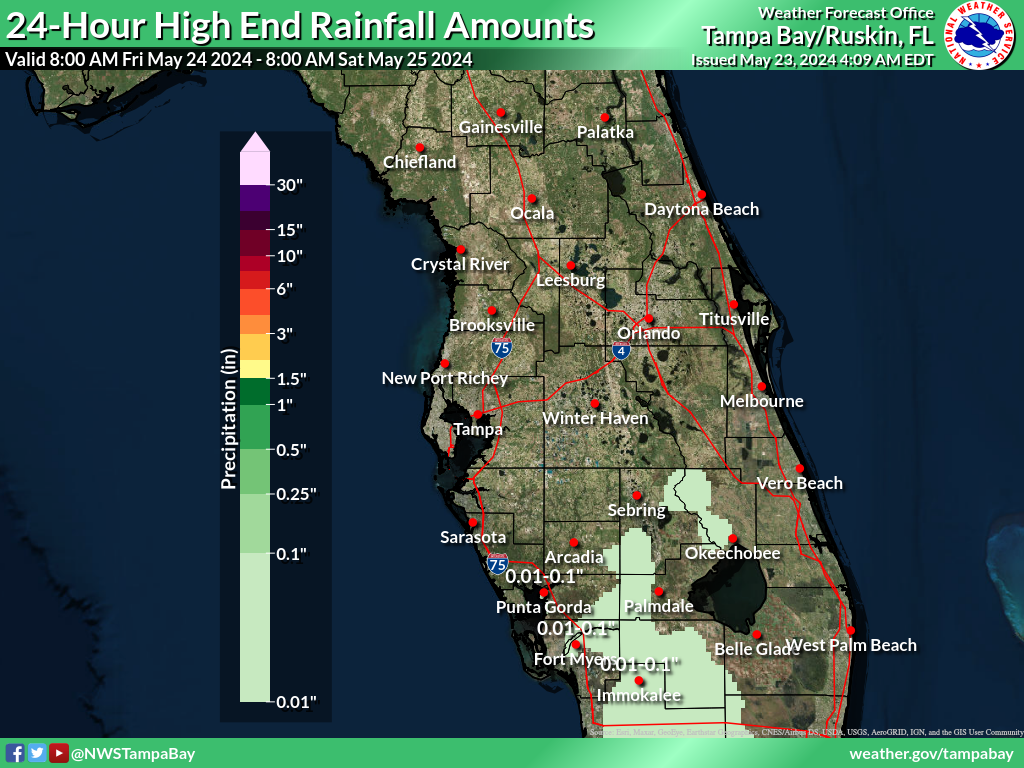 |
Day 3 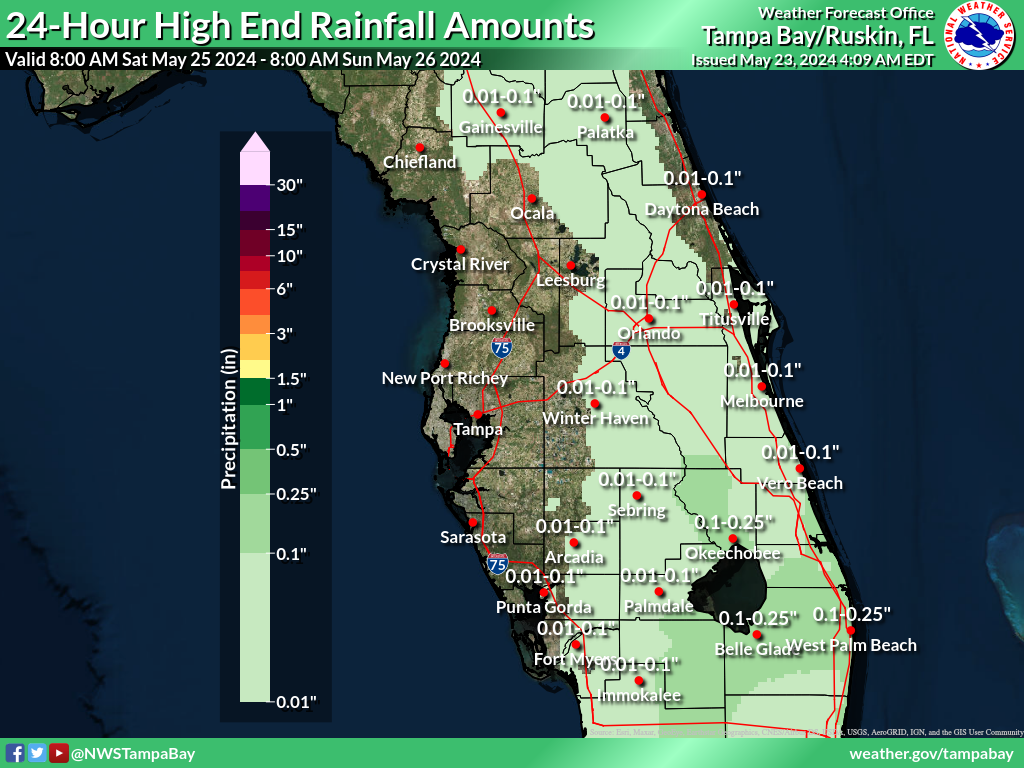 |
Day 4 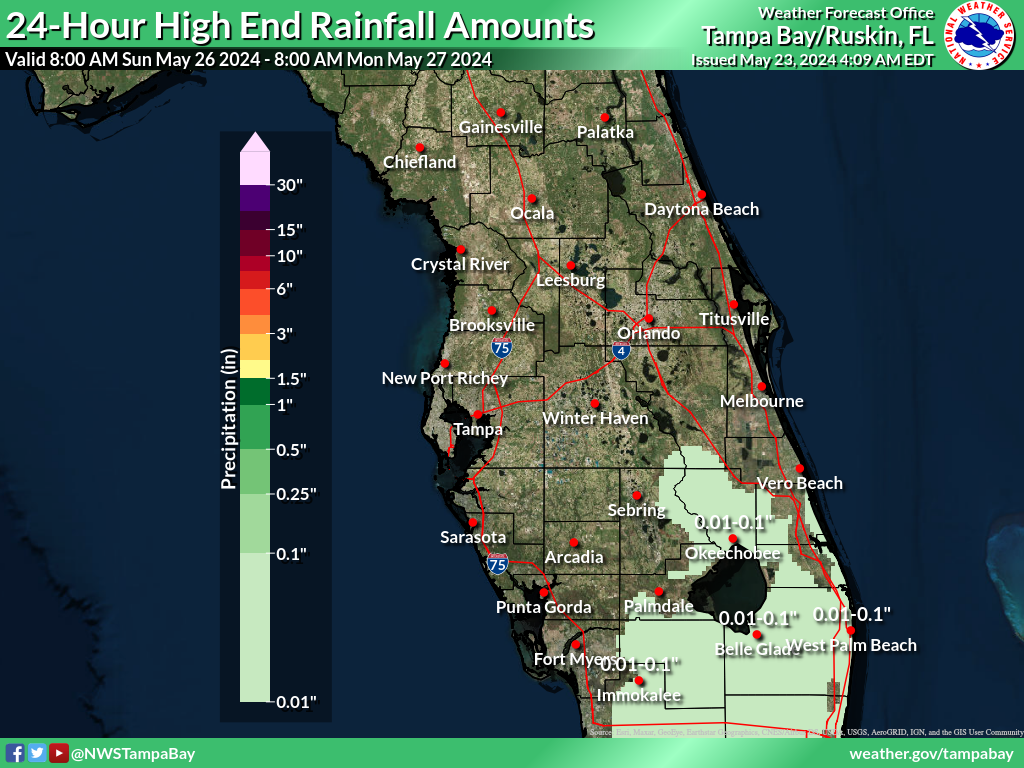 |
Day 5 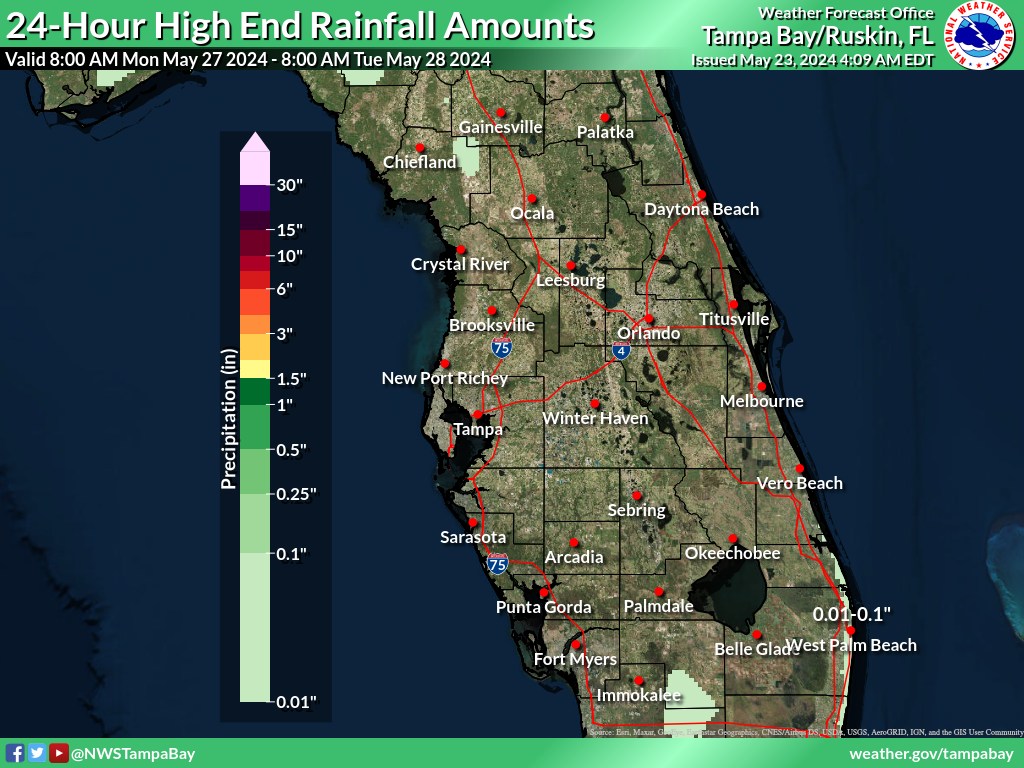 |
Day 6 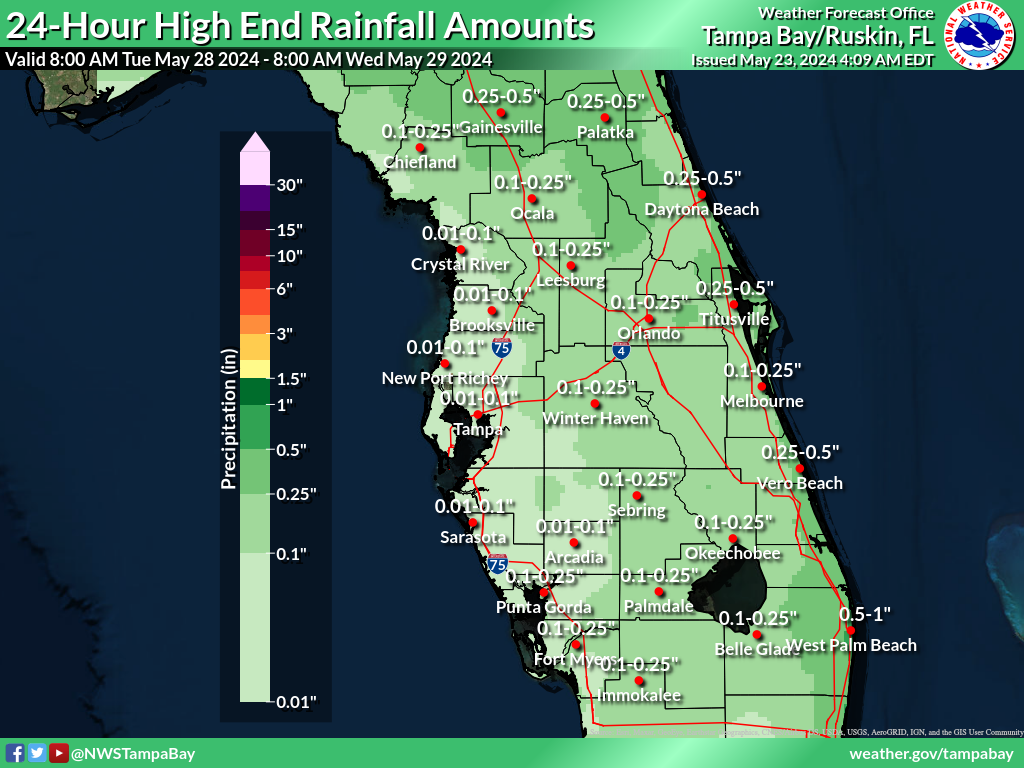 |
Day 7 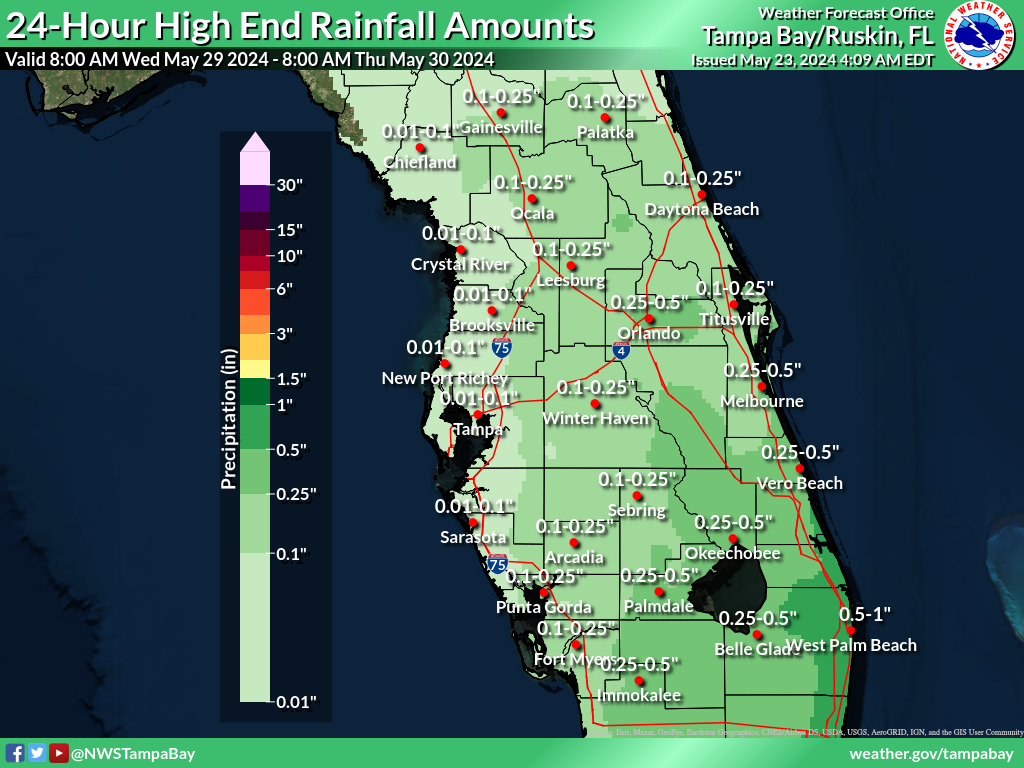 |
Least Possible 24 Hour Rainfall (in.)
These maps depict a reasonable lower-end rainfall amount for the time period shown on the graphic, based on many computer model simulations of possible rainfall totals. These lower amounts are an unlikely scenario, with a 9 in 10, or 90% chance that more rain will fall, and only a 1 in 10, or 10% chance that less rain will fall. These amounts can help serve as a lower-end scenario for planning purposes. On many occasions these graphics will be blank, which depicts that the low end is for no measurable rainfall.
Day 1  |
Day 2  |
Day 3  |
Day 4  |
Day 5 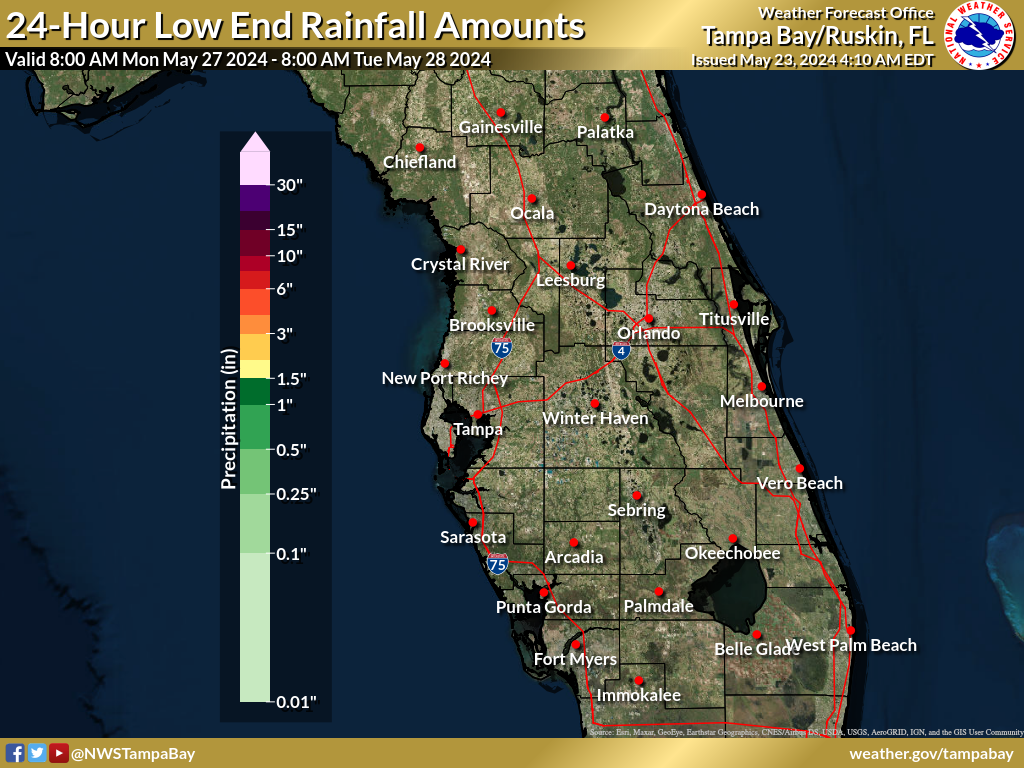 |
Day 6 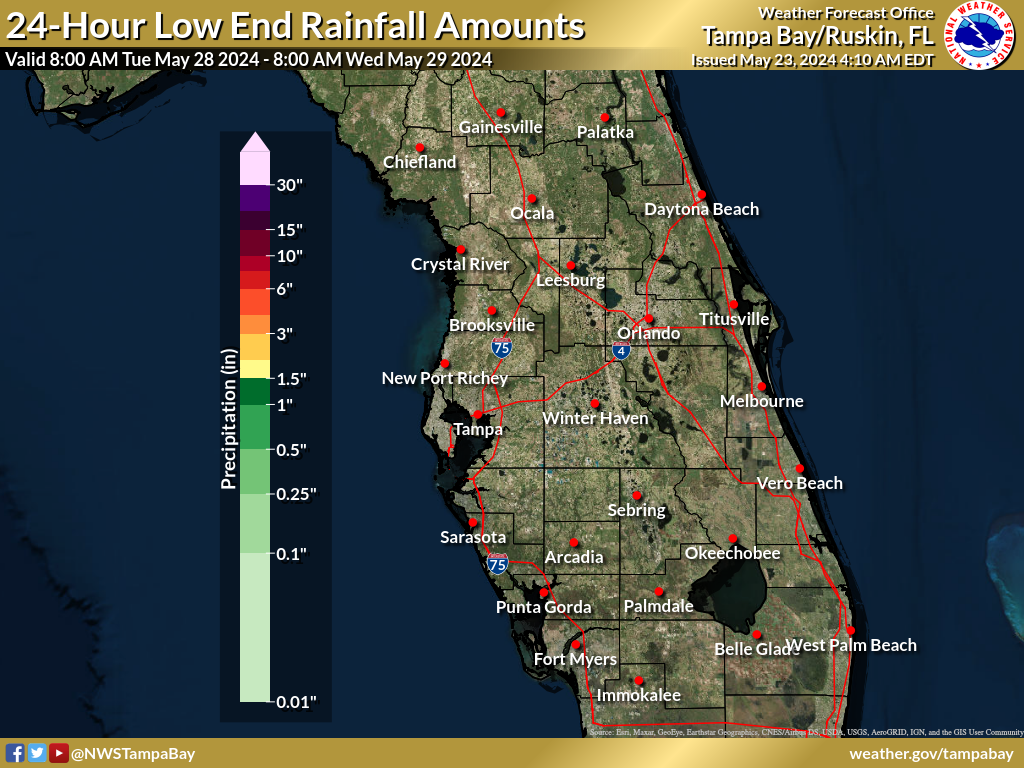 |
Day 7 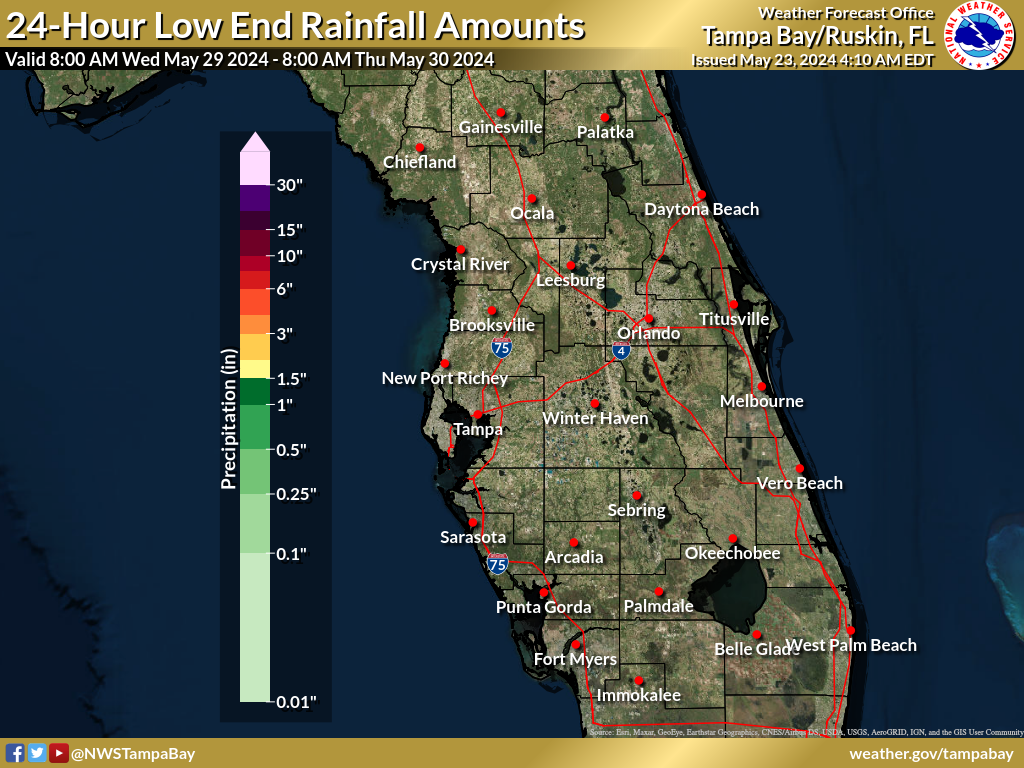 |
Expected Rainfall (in.)
These maps are the official NWS rainfall forecast in inches during the time period shown on the graphic. These rainfall amounts are determined by NWS forecasters to be the most likely outcome based on evaluation of data from computer models, satellite, radar, and other observations.
Day 1-2 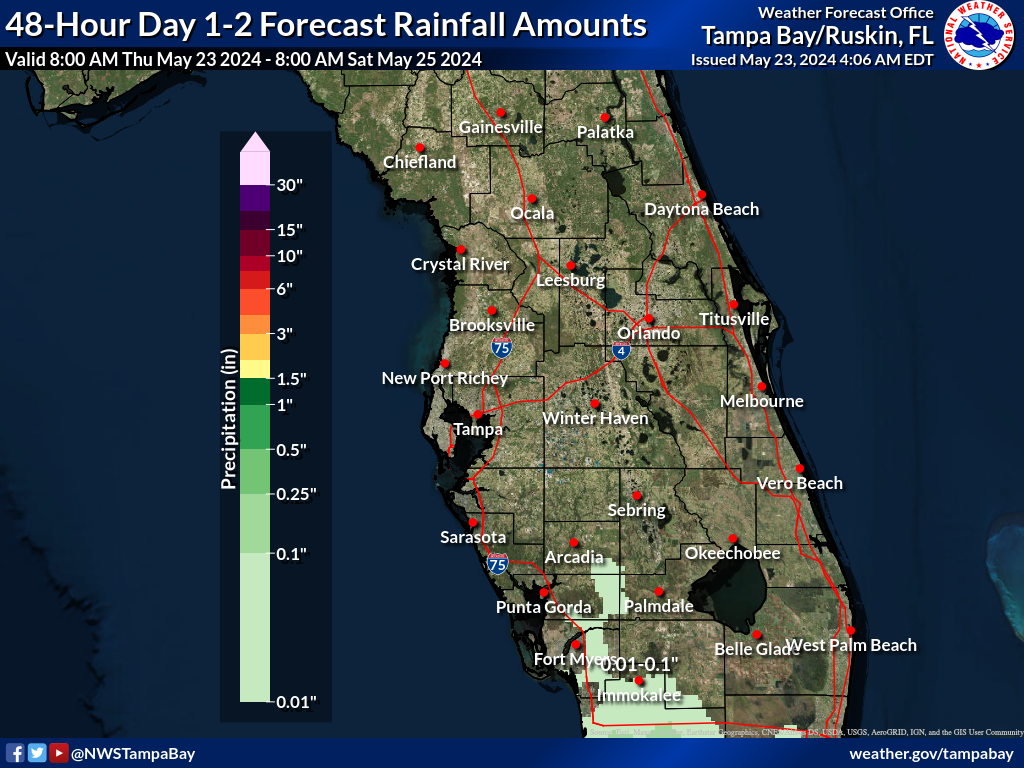 |
Day 1-3 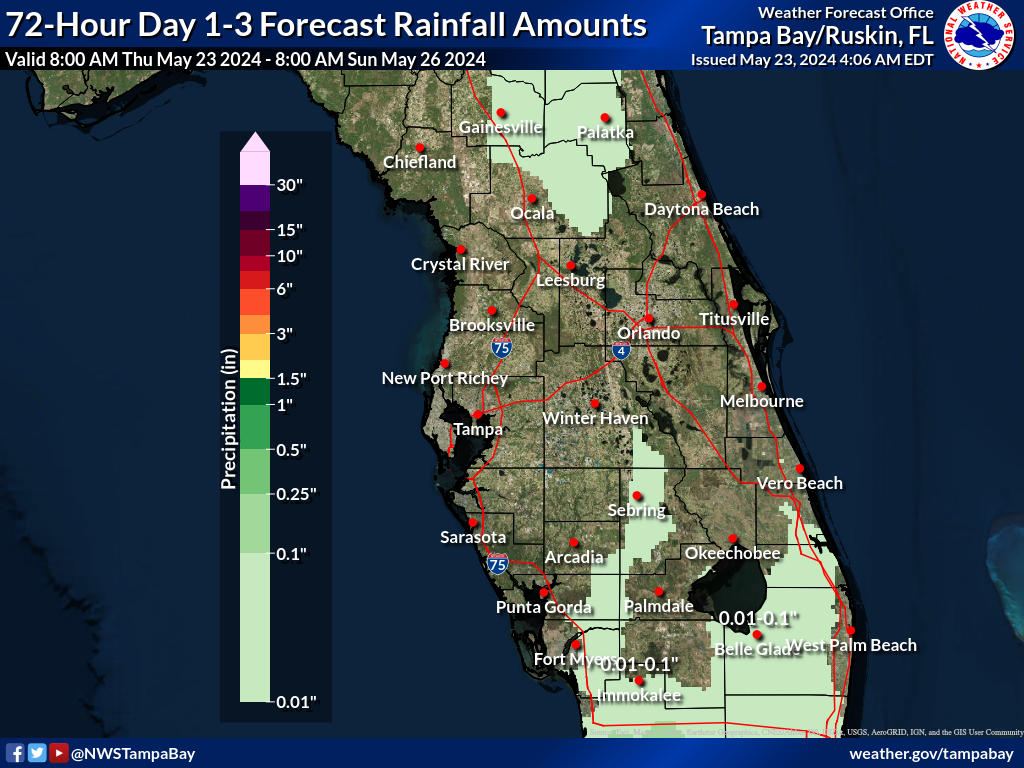 |
Day 1-5 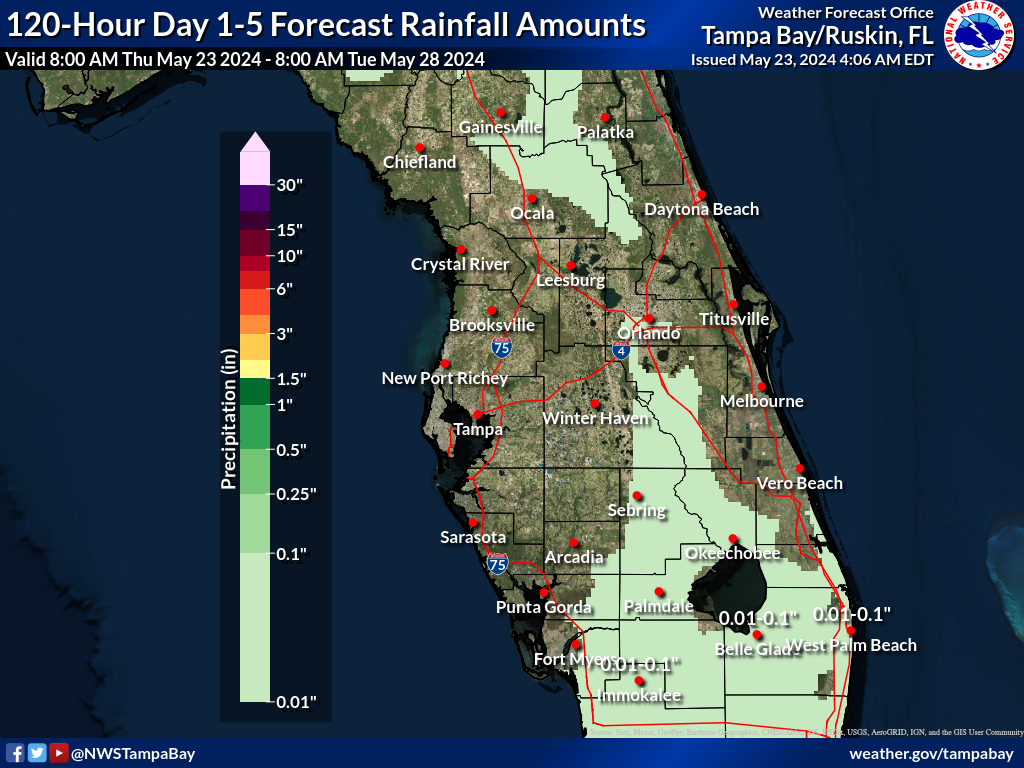 |
Day 1-7 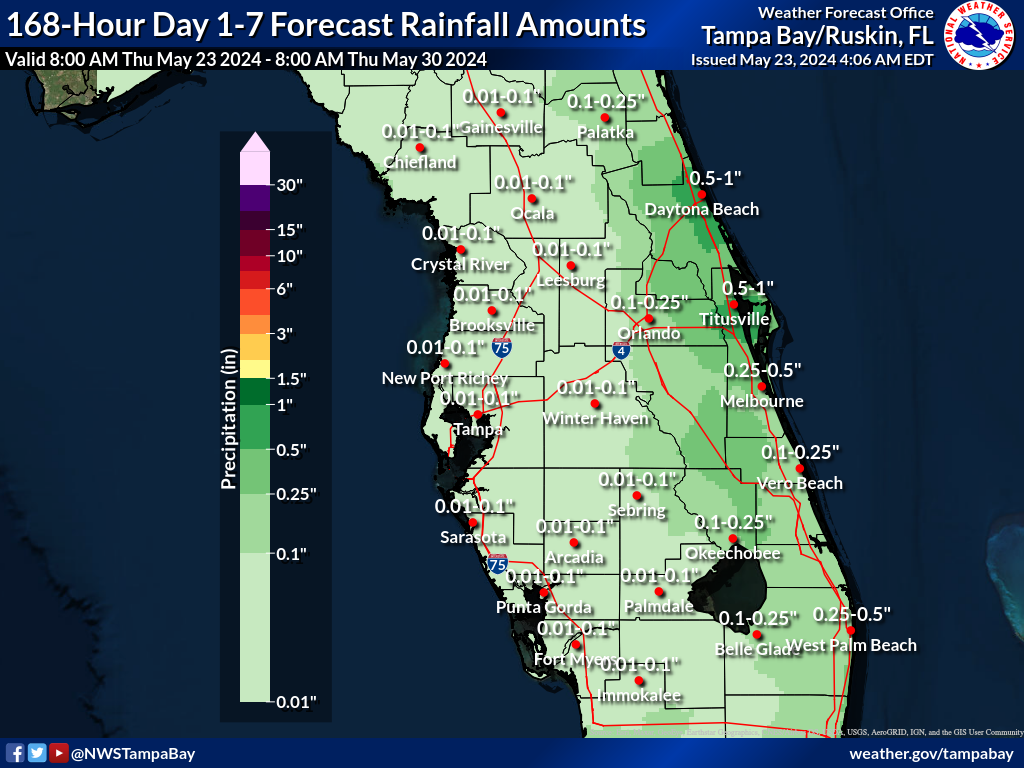 |
Day 2-3 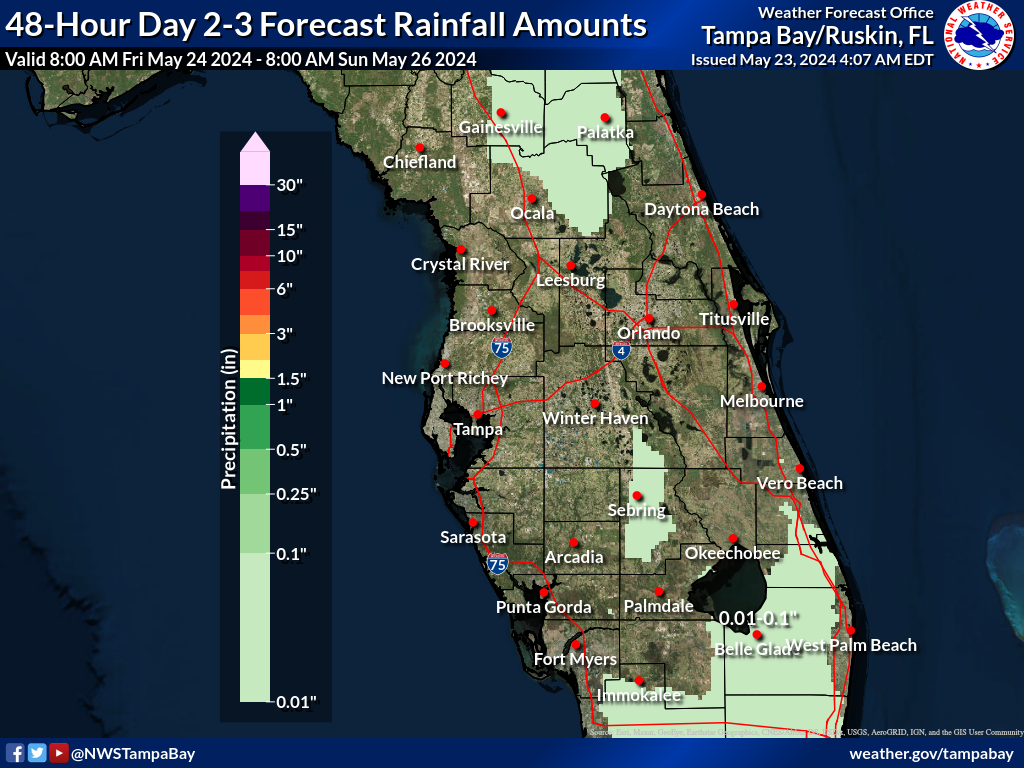 |
Day 3-4 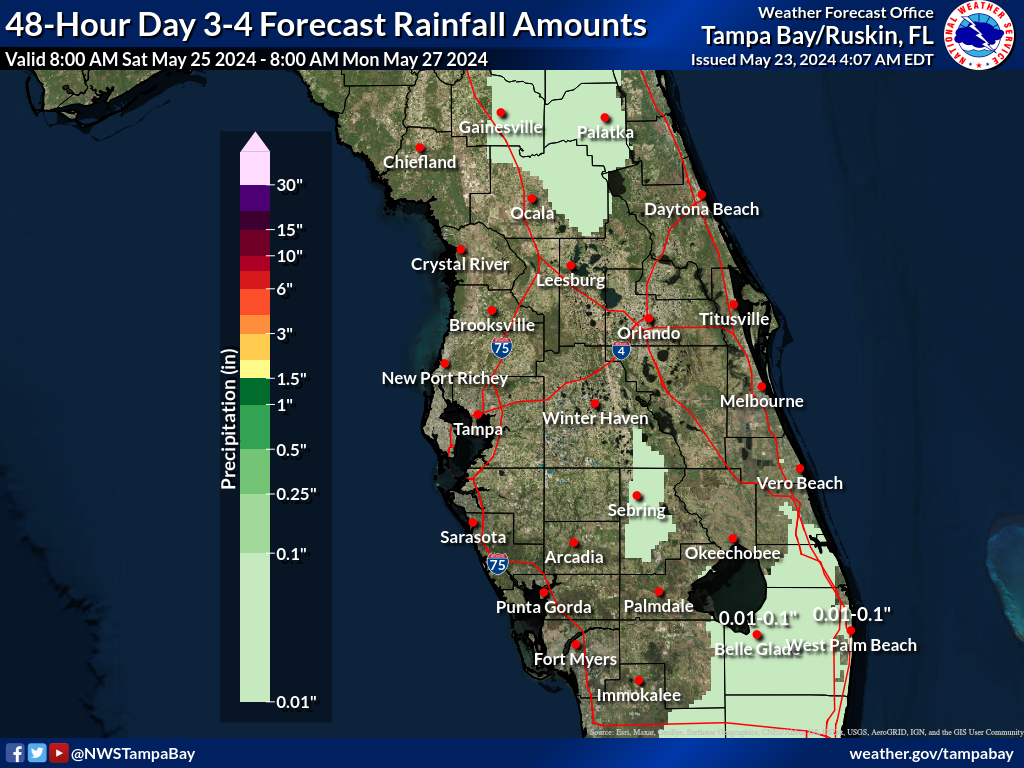 |
Day 4-5 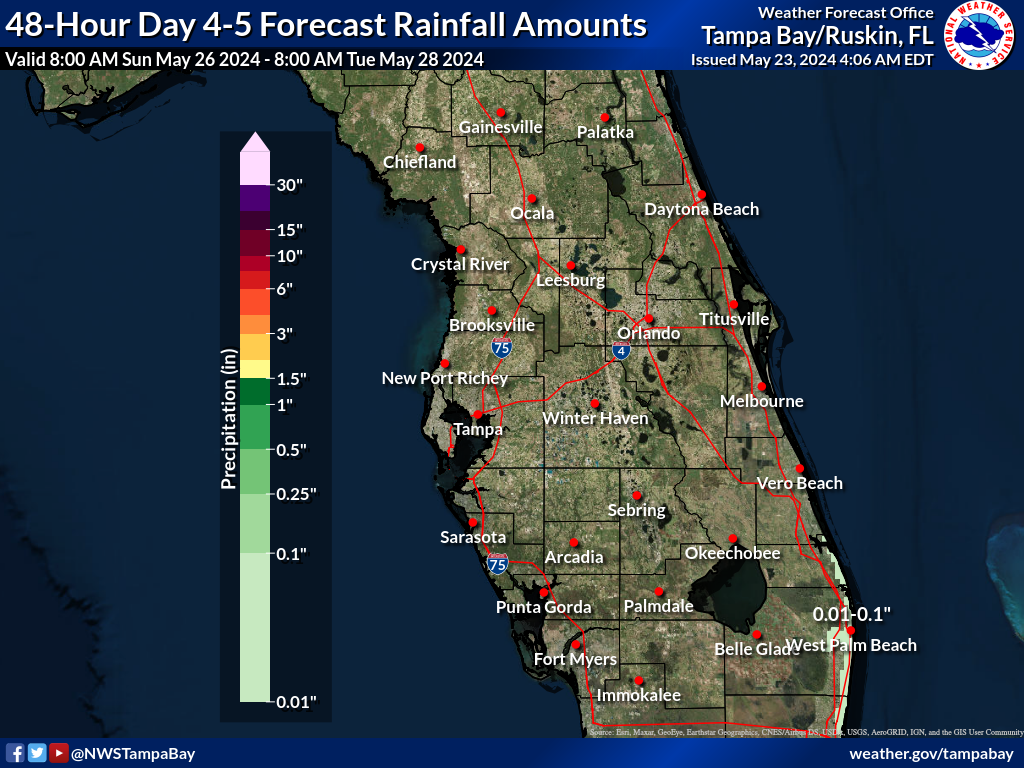 |
Day 6-7 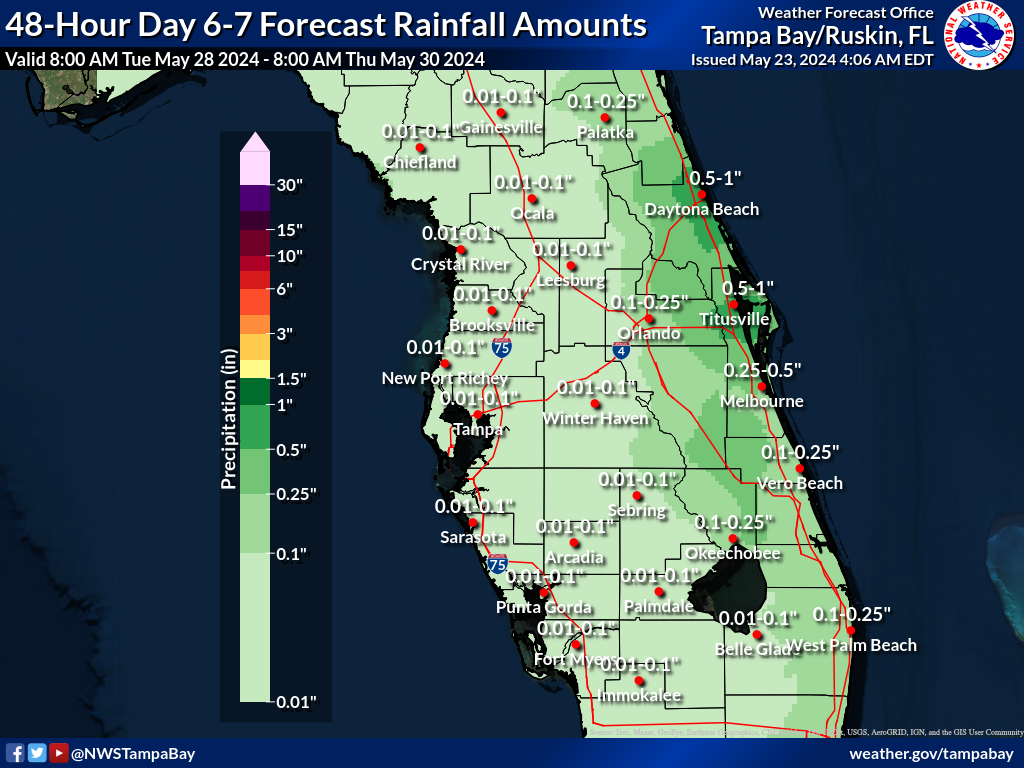 |
Greatest Possible Rainfall (in.)
These maps depict a reasonable upper-end rainfall amount for the time period shown on the graphic, based on many computer model simulations of possible rainfall totals. These higher amounts are an unlikely scenario, with only a 1 in 10, or 10% chance that more rain will fall, and a 9 in 10, or 90% chance that less rain will fall. These amounts can help serve as an upper-end scenario for planning purposes.
Day 1-2 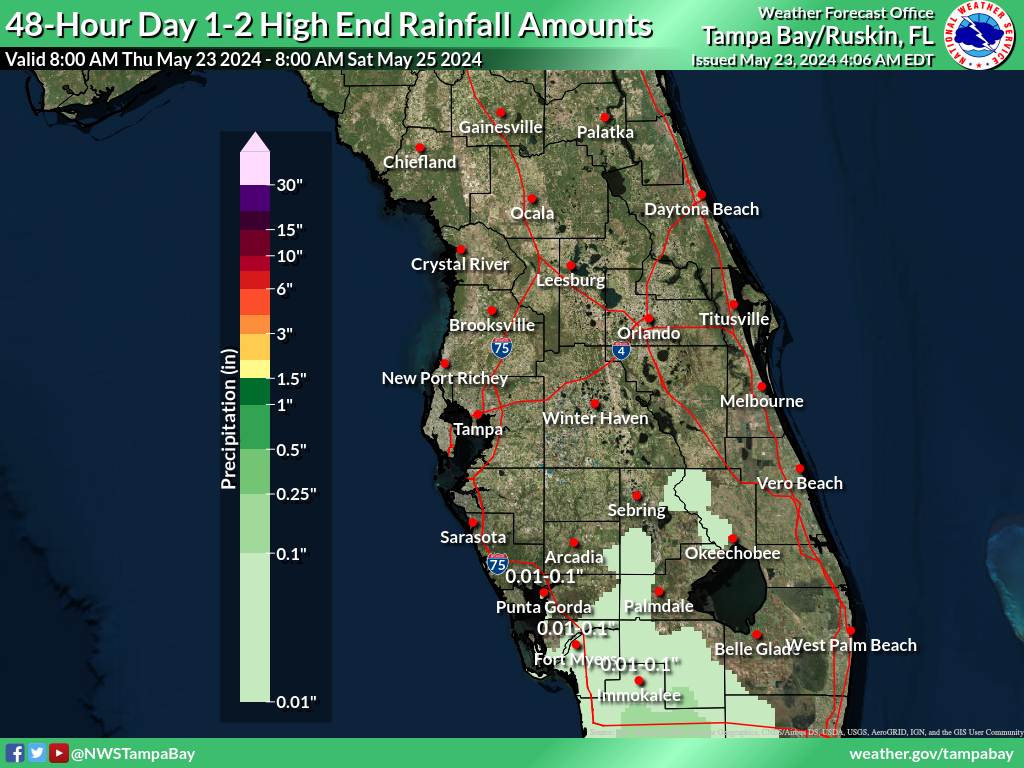 |
Day 1-3 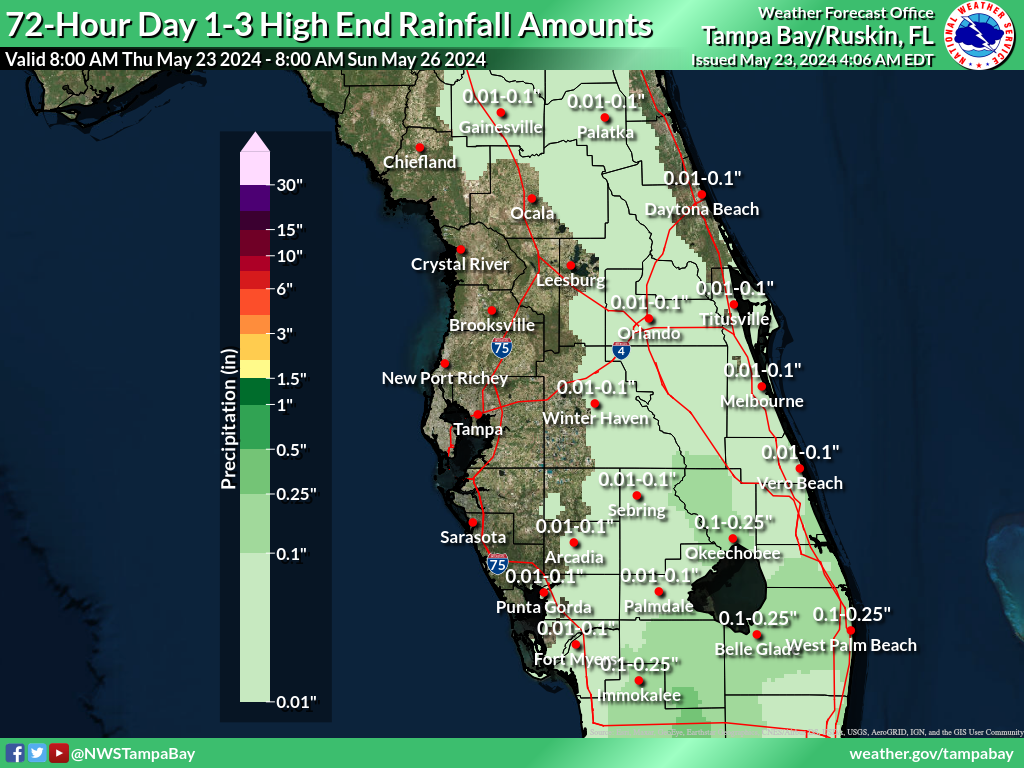 |
Day 1-5 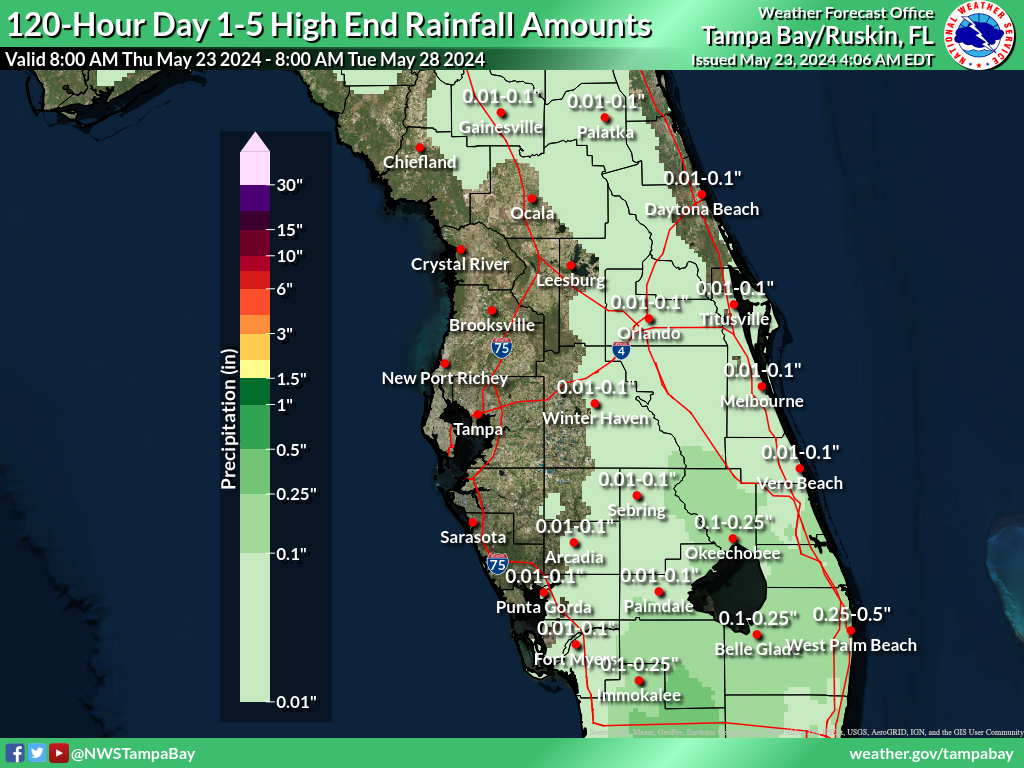 |
Day 1-7 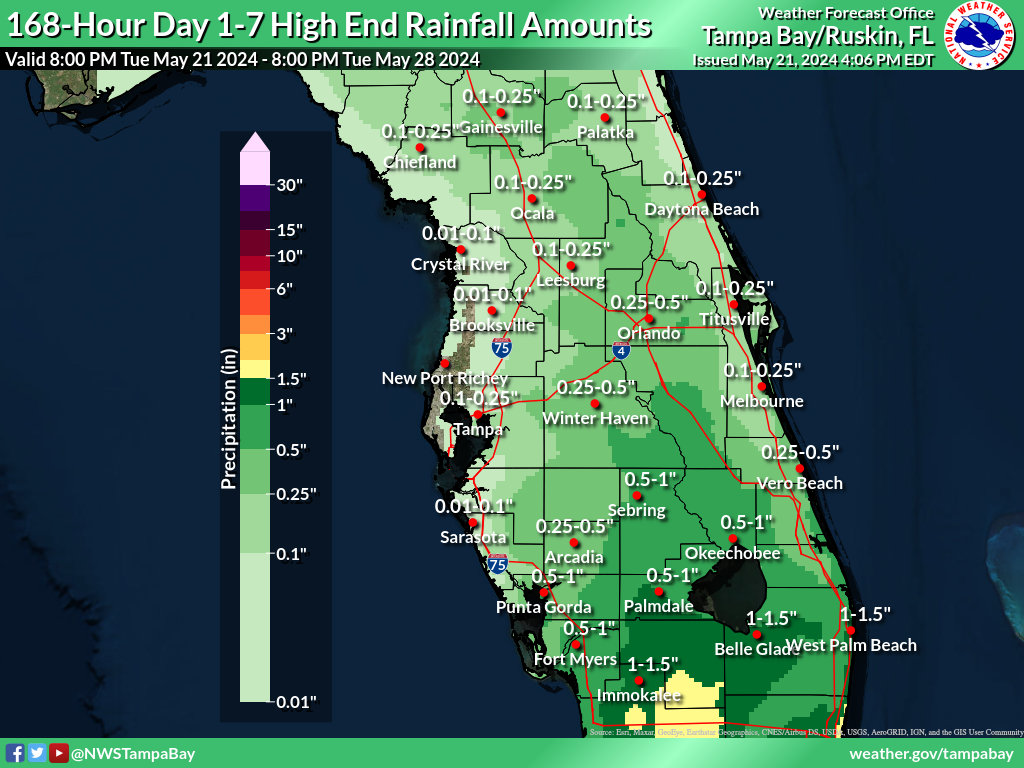 |
Day 2-3 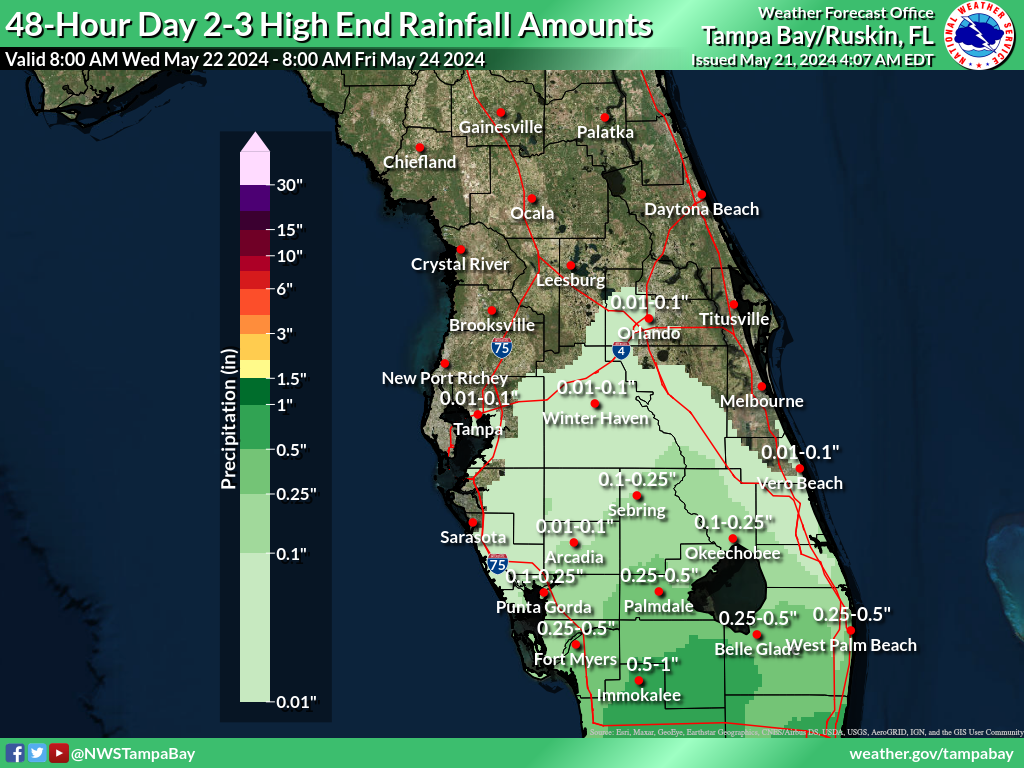 |
Day 3-4 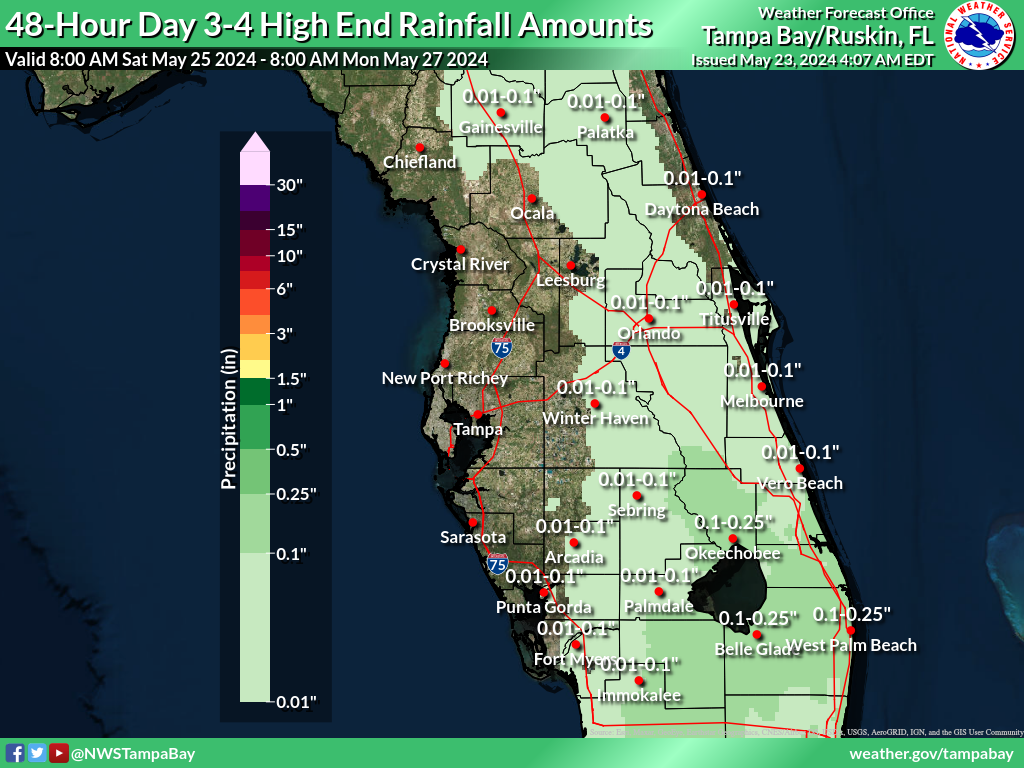 |
Day 4-5 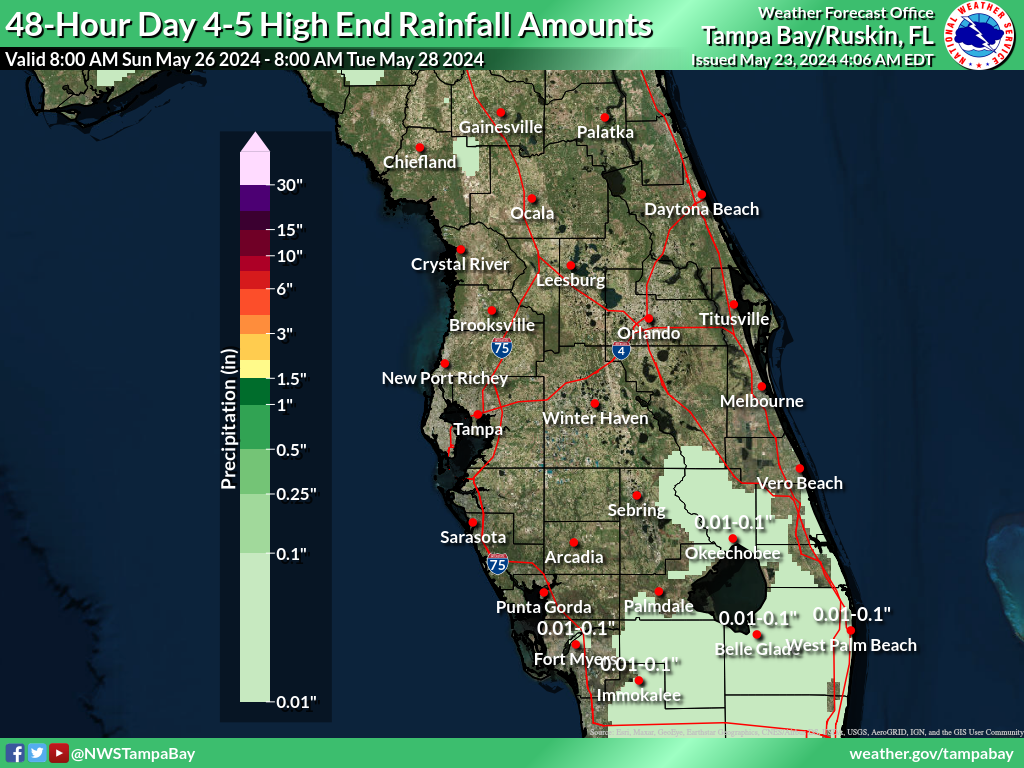 |
Day 6-7 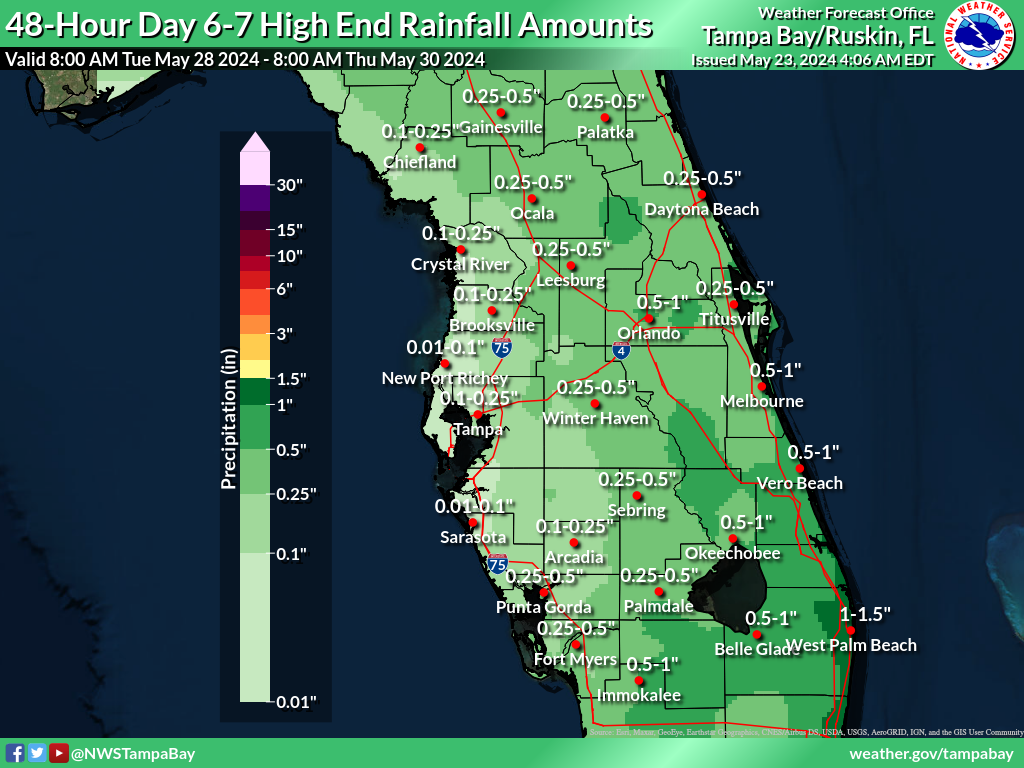 |
Least Possible Rainfall (in.)
These maps depict a reasonable lower-end rainfall amount for the time period shown on the graphic, based on many computer model simulations of possible rainfall totals. These lower amounts are an unlikely scenario, with a 9 in 10, or 90% chance that more rain will fall, and only a 1 in 10, or 10% chance that less rain will fall. These amounts can help serve as a lower-end scenario for planning purposes. On many occasions these graphics will be blank, which depicts that the low end is for no measurable rainfall.
Day 1-2 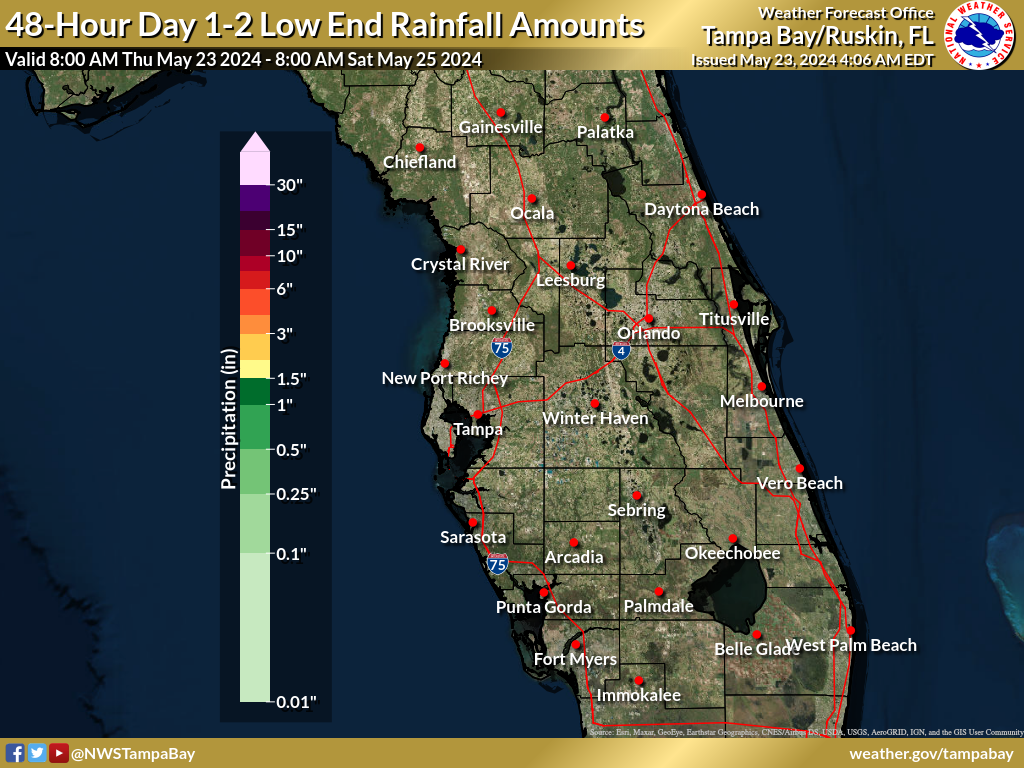 |
Day 1-3 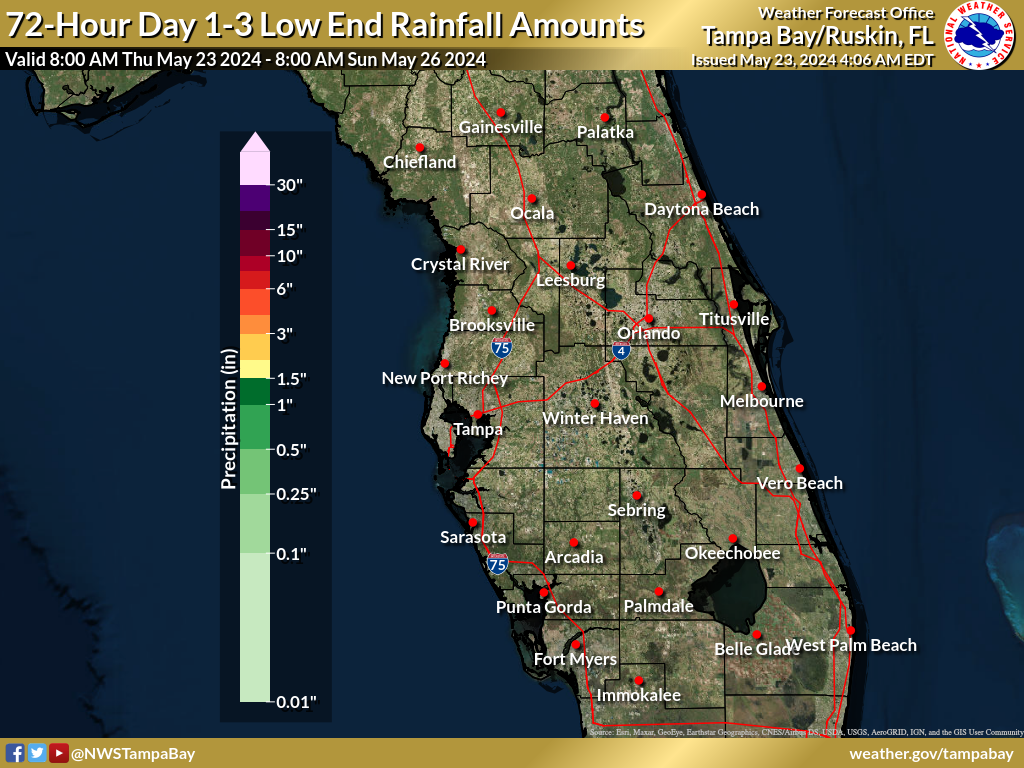 |
Day 1-5 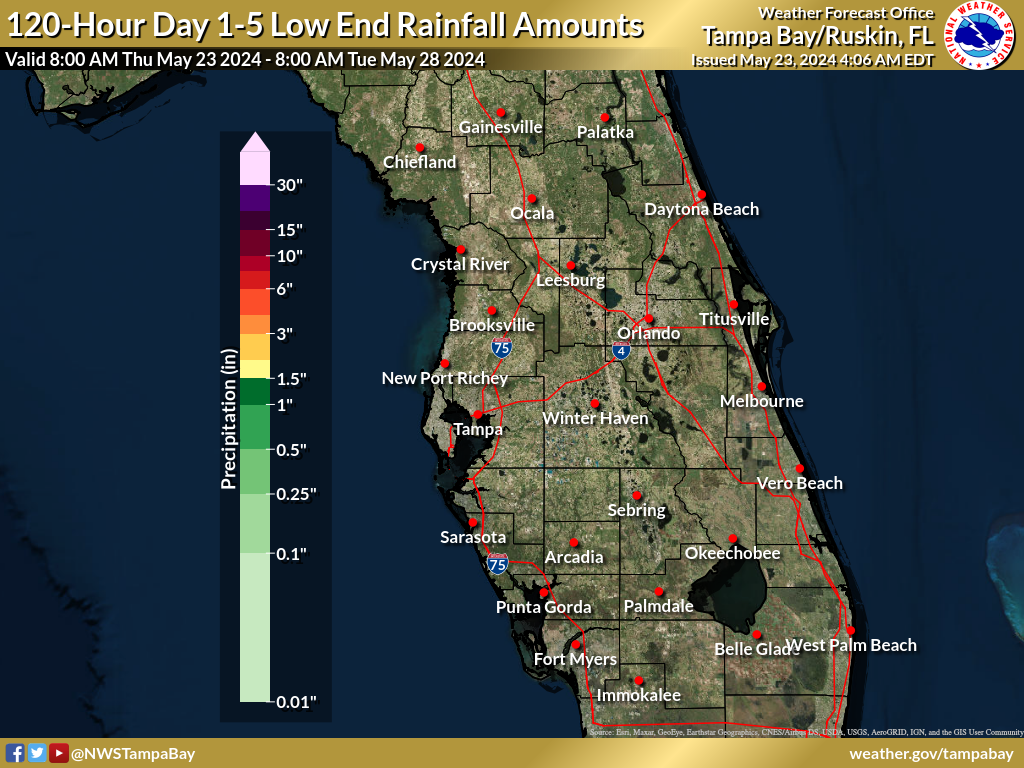 |
Day 1-7 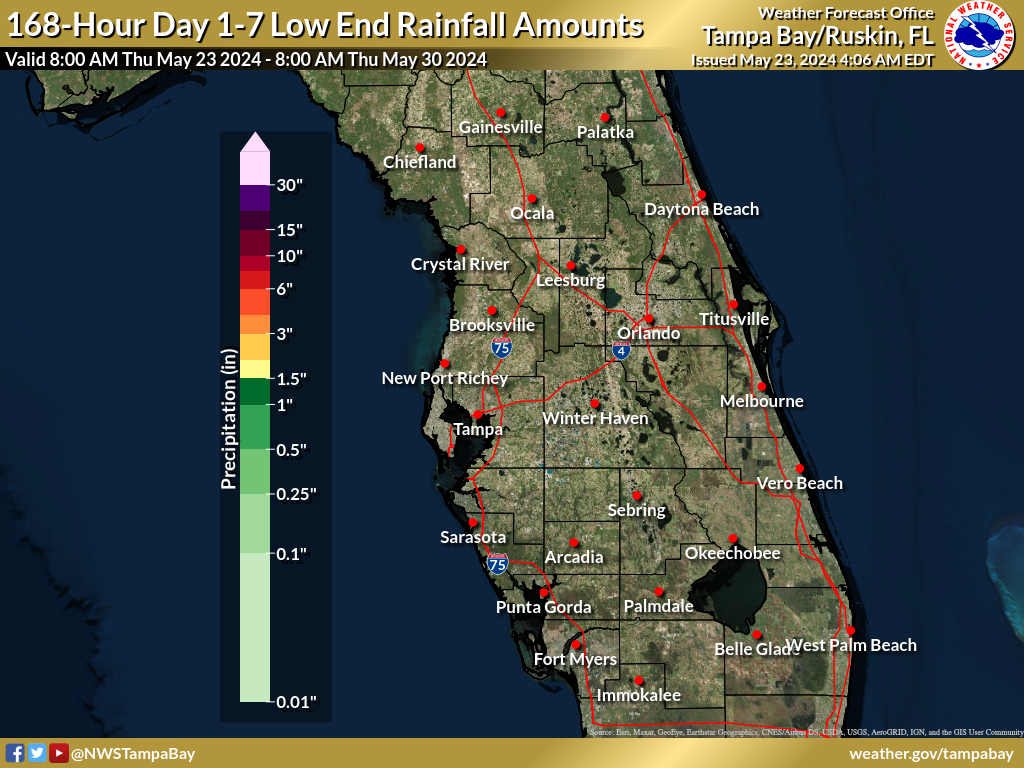 |
Day 2-3 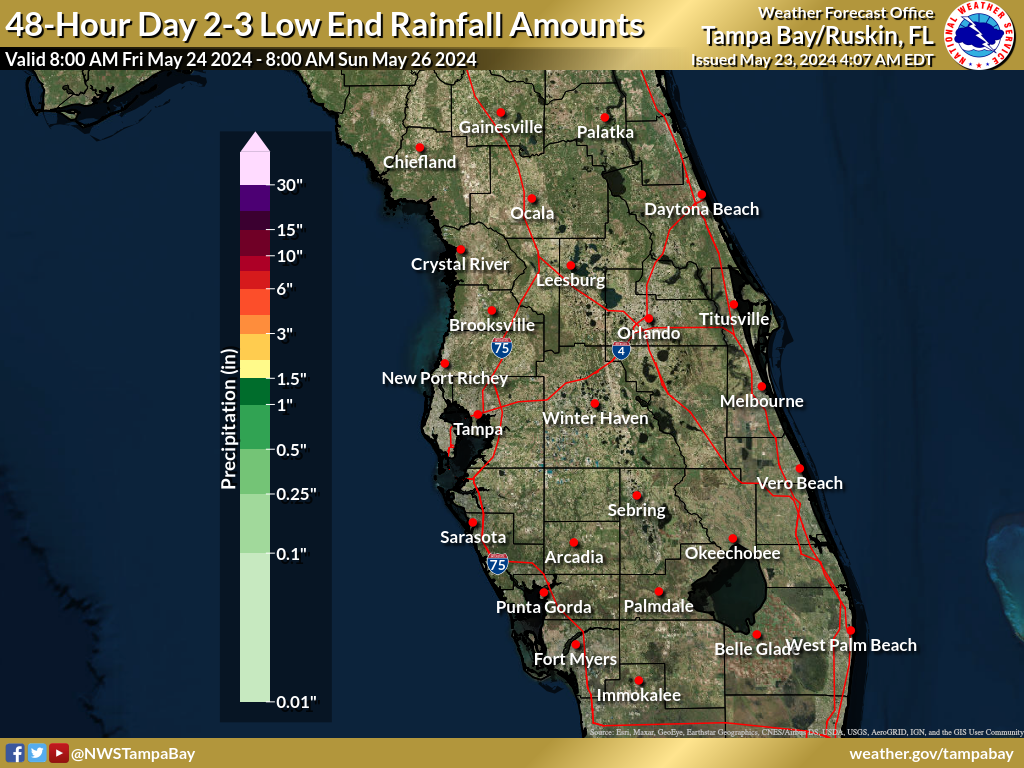 |
Day 3-4 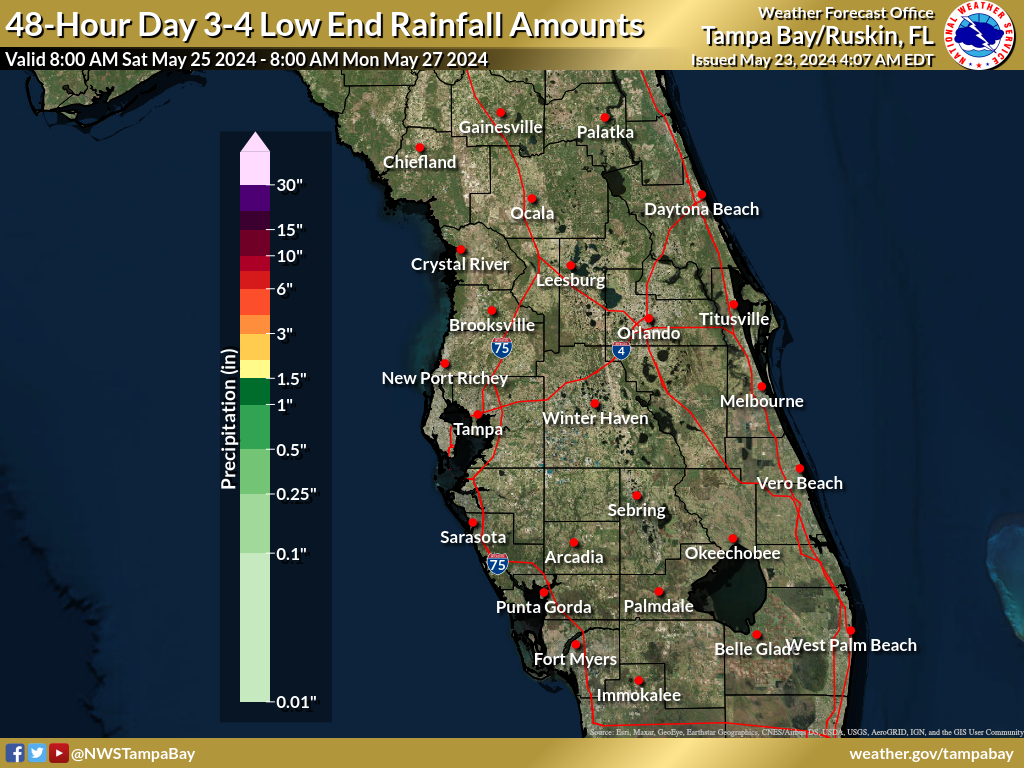 |
Day 4-5 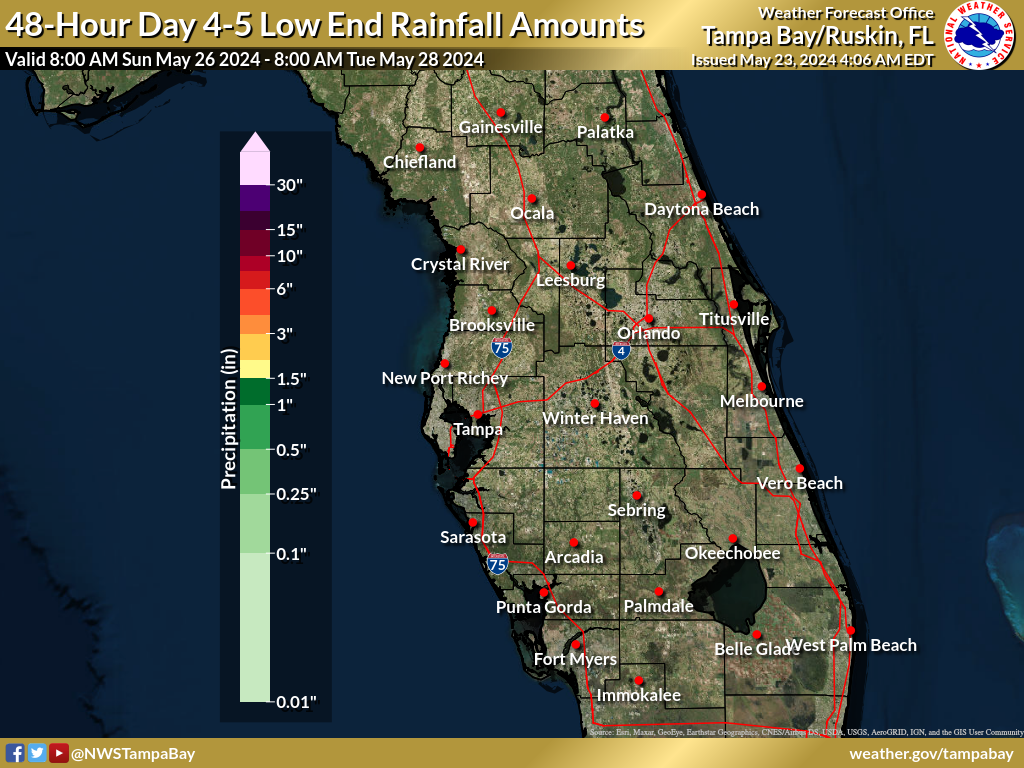 |
Day 6-7 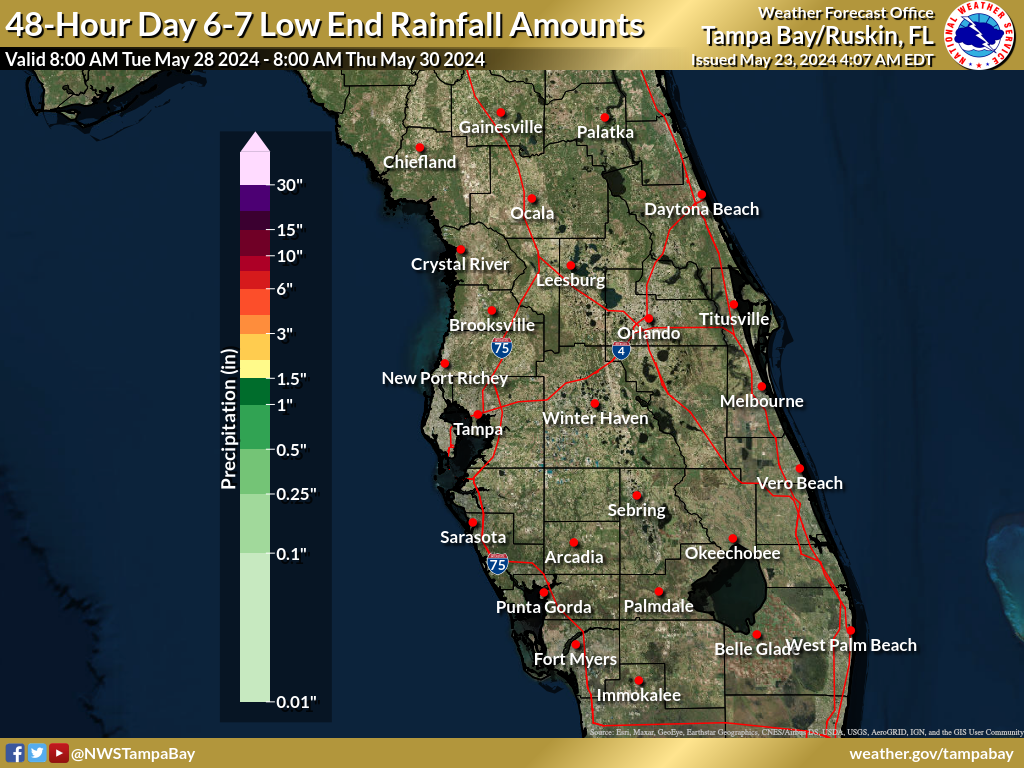 |