| Unseasonably mild with some morning rain showers for Christmas. |
|
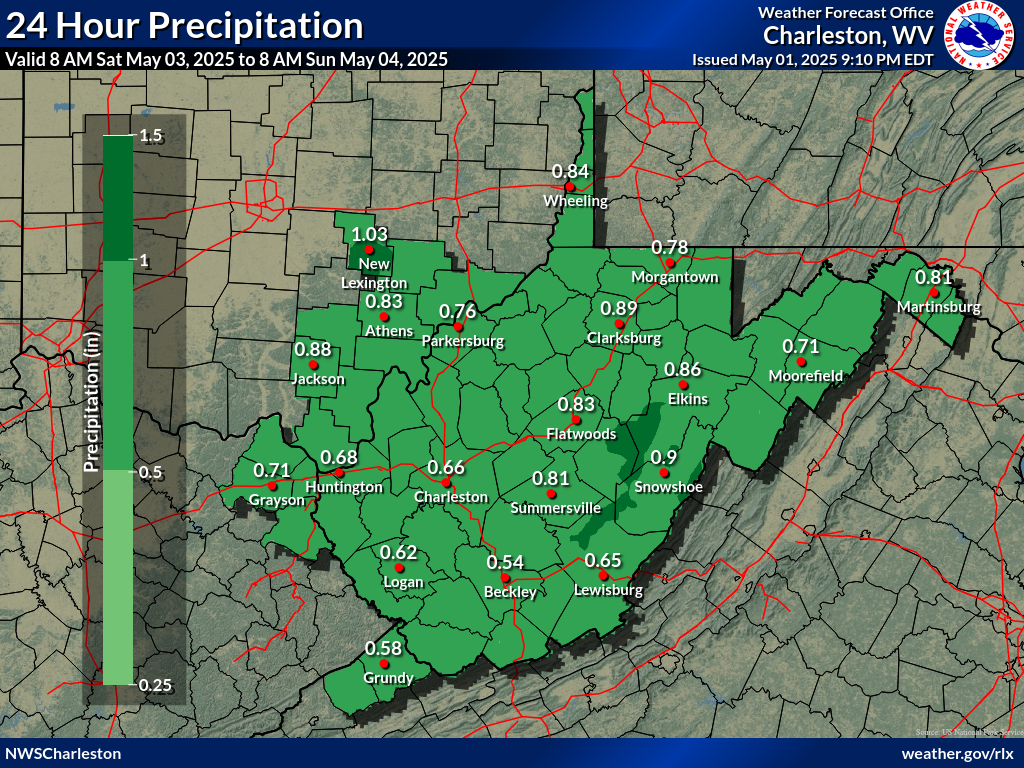
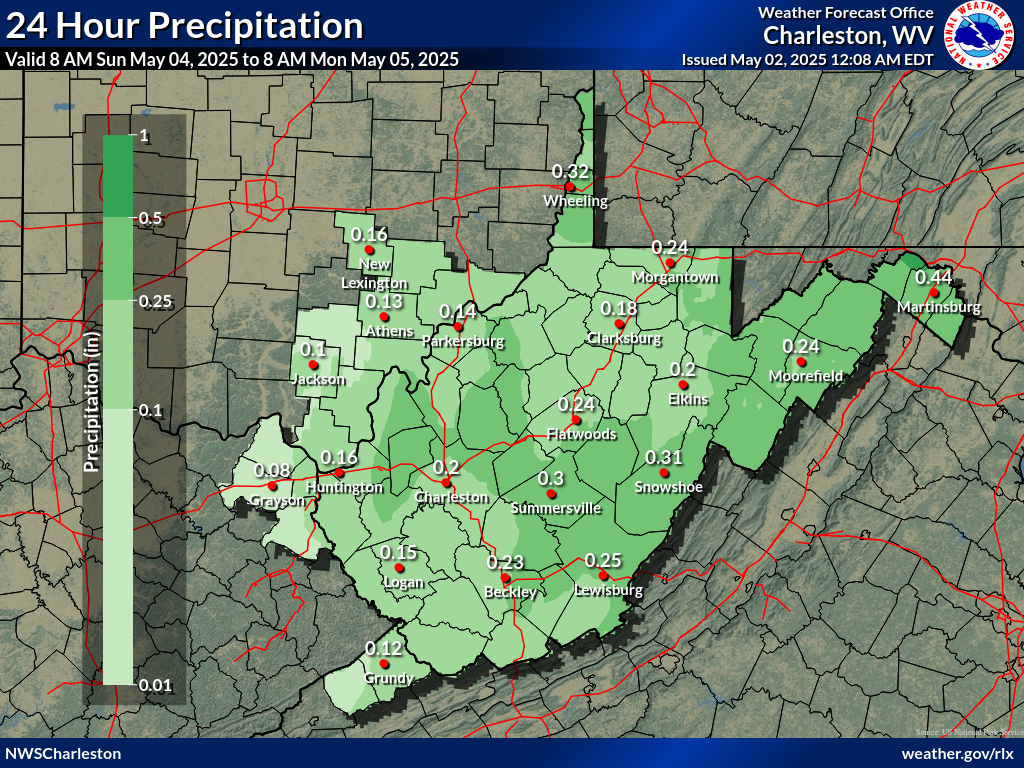
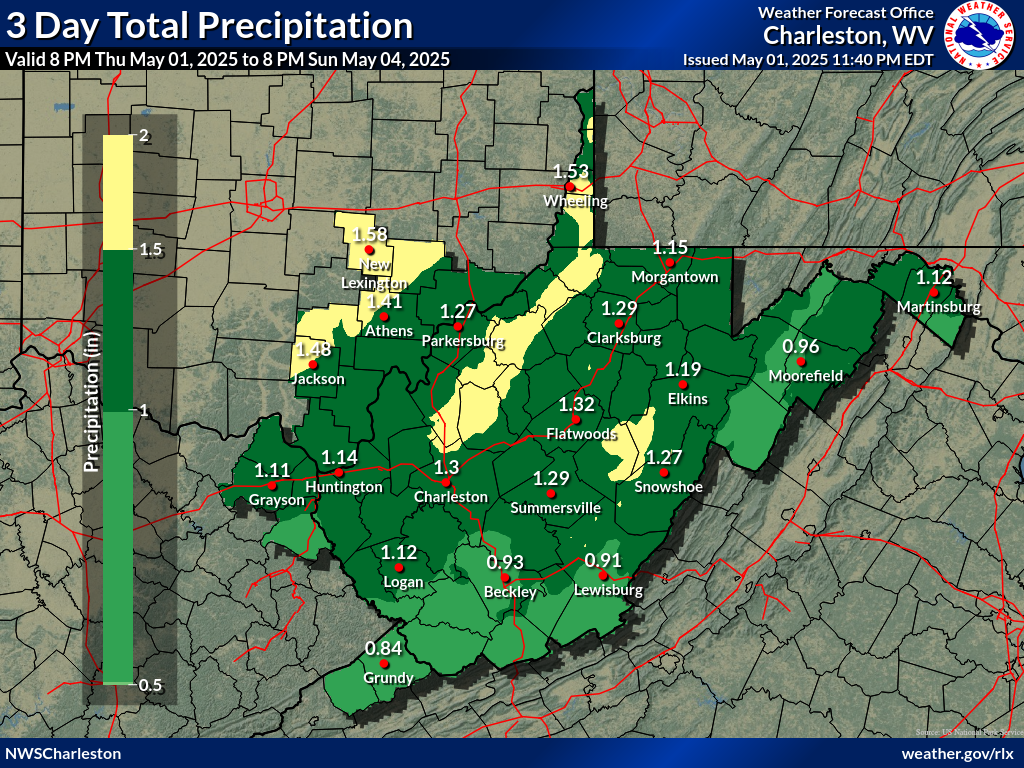
The unseasonably mild weather will continue as rounds of showers impact the area at times early Christmas morning through the weekend. A rumble of thunder could even occur early Christmas morning. Much colder air arrives early next week as an arctic front whips through Sunday night. |
 |
|
|
|||||||||||||||||||||||||||||||||||||||||||||||||||||||||||||||||||||||||||||||||
|
|||||||||||||||||||||||||||||||||||||||||||||||||||||||||||||||||||||||||||||||||||
 NWS Charleston, WV Radar Loop |
 Regional Radar Loop |
 Jackson, KY |
 Wilmington, OH |
 Pittsburgh, PA |
 Sterling, VA |
 Blacksburg, VA |
 Morristown, TN |
||
| Click Here for Interactive Radar Display | ||||
 |
 GeoColor Satellite Image |
 Infrared Satellite Image Infrared Satellite Image |
 Water Vapor Image |
 |
 |
 |
 |
| GOES-East Visible | GOES-East Lightning Mapper | GOES-East Infrared | GOES-East Water Vapor |
| Additional Satellite Imagery | |||
 US Surface Analysis |
 US Surface Analysis with Radar |
 US Surface Temps | N America | World |
| Hourly Weather Roundups | Regional Temp/Precip Summaries | Miscellaneous Links |
| West Virginia | Supplemental Obs | West Virginia | COOPs | CoCoRaHS | Rain Gauge Monitor |
| East Kentucky | East KY | Hourly Rainfall | WV | |OH | VA |
| Ohio | Ohio | Srn Ohio | COOPs | CoCoRaHS WV | KY | OH | VA |
| Pennsylvania | Pennsylvania Wrn COOPs | Cntl COOPs |
Road Conditions WV | KY | OH | VA |
| Maryland & DC Area | Maryland & DC Area | COOPs | Kentucky Mesonet |
| Virginia | Virginia | COOPs | | Snowfall |
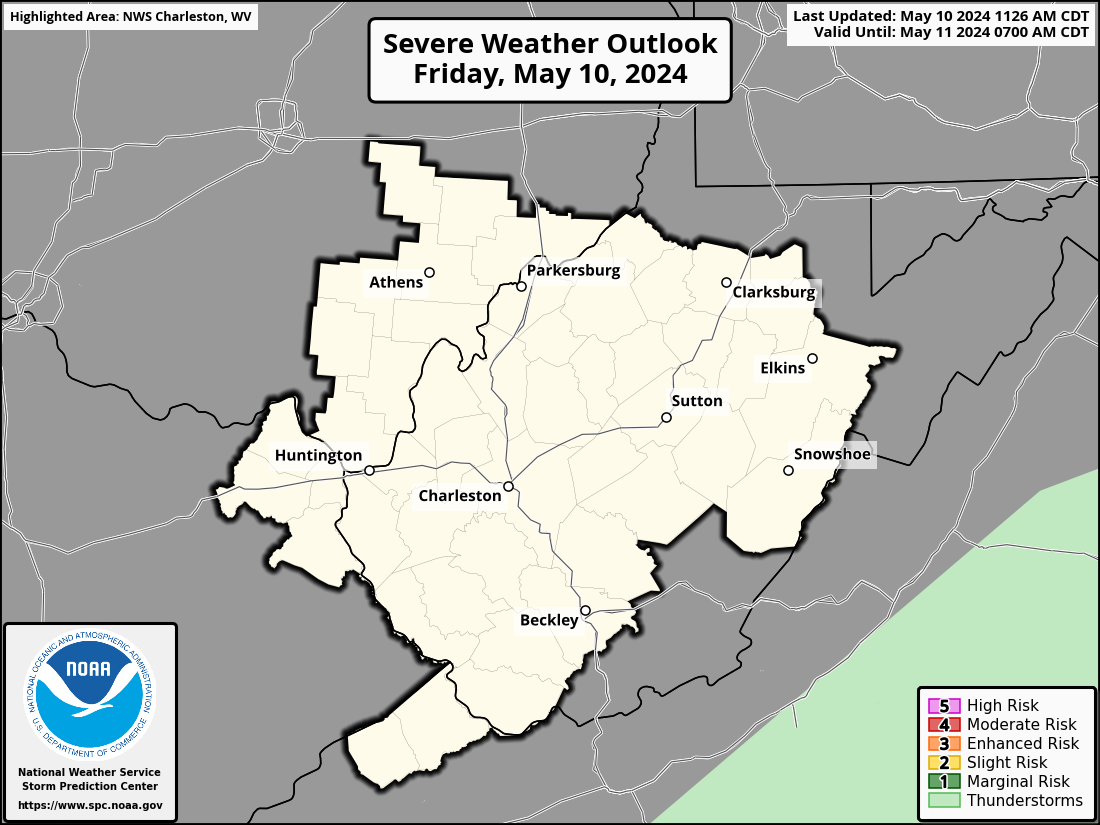
| Day 1 Severe Thunderstorm Outlook | Day 2 Severe Thunderstorm Outlook | Day 3 Severe Thunderstorm Outlook |
 |
 |
 |
| SPC Day 1 Discussion | SPC Day 2 Discussion | SPC Day 3 Discussion |
 |
Current Watches |
Storm Trend Discussions |
Today's Storm Reports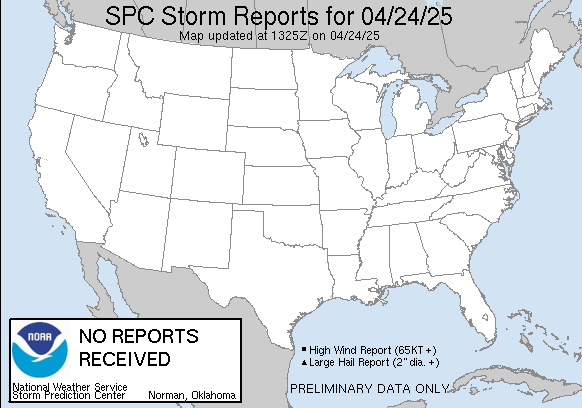 |
Yesterday's Storm Reports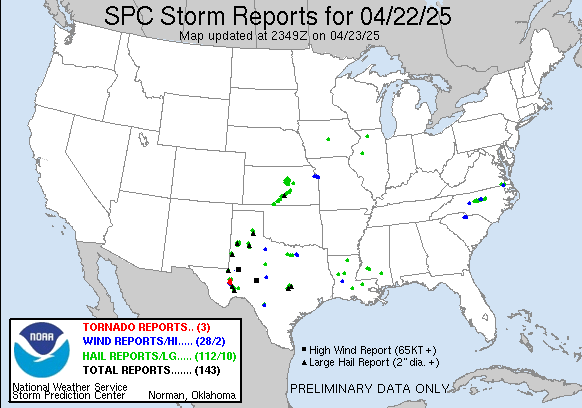 |
| SPC Day 1 Thunderstorm Outlook | SPC Day 1 Tornado Outlook | SPC Day 1 Severe Wind Outlook | SPC Day 1 Severe Hail Outlook |
 |
 |
 |
 |
| SPC Day 1 Thunderstorm Outlook Discussion | |||
| SPC Day 2 Thunderstorm Outlook | SPC Day 2 Tornado Outlook | SPC Day 2 Severe Wind Outlook | SPC Day 2 Severe Hail Outlook |
 |
 |
 |
 |
| SPC Day 2 Thunderstorm Outlook Discussion | |||
| SPC Day 3 Thunderstorm Outlook | SPC Day 4-8 Thunderstorm Outlook |
 |
 |
| SPC Day 3 Outlook Narrative | SPC Day 4-8 Outlook Narrative |
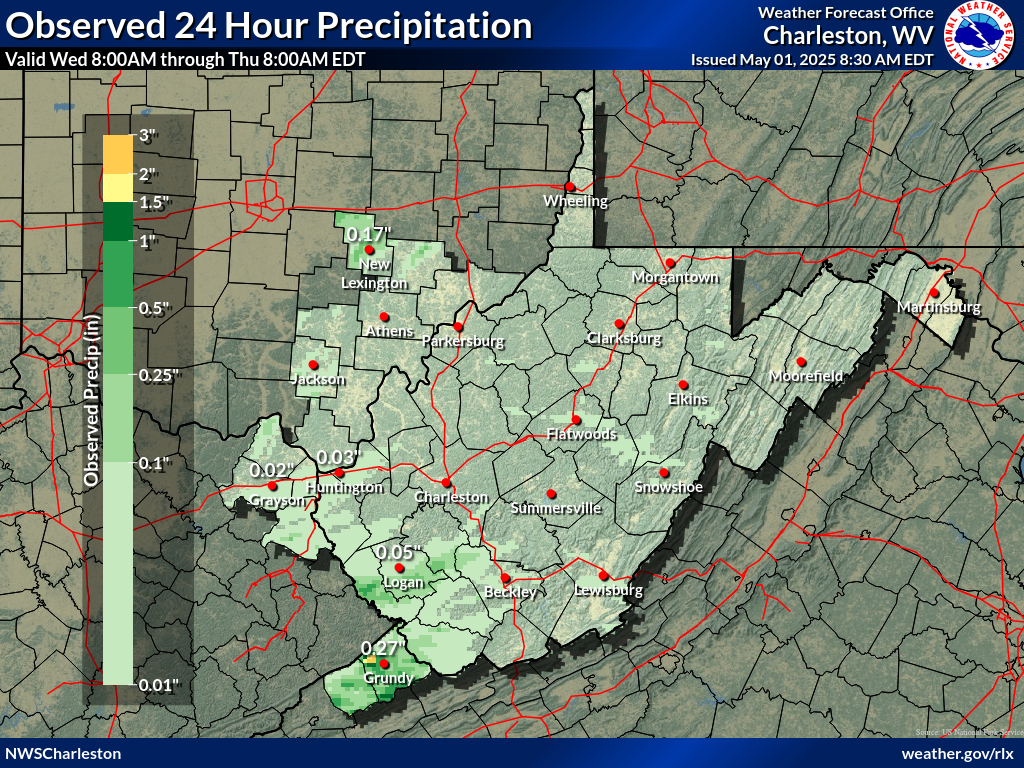
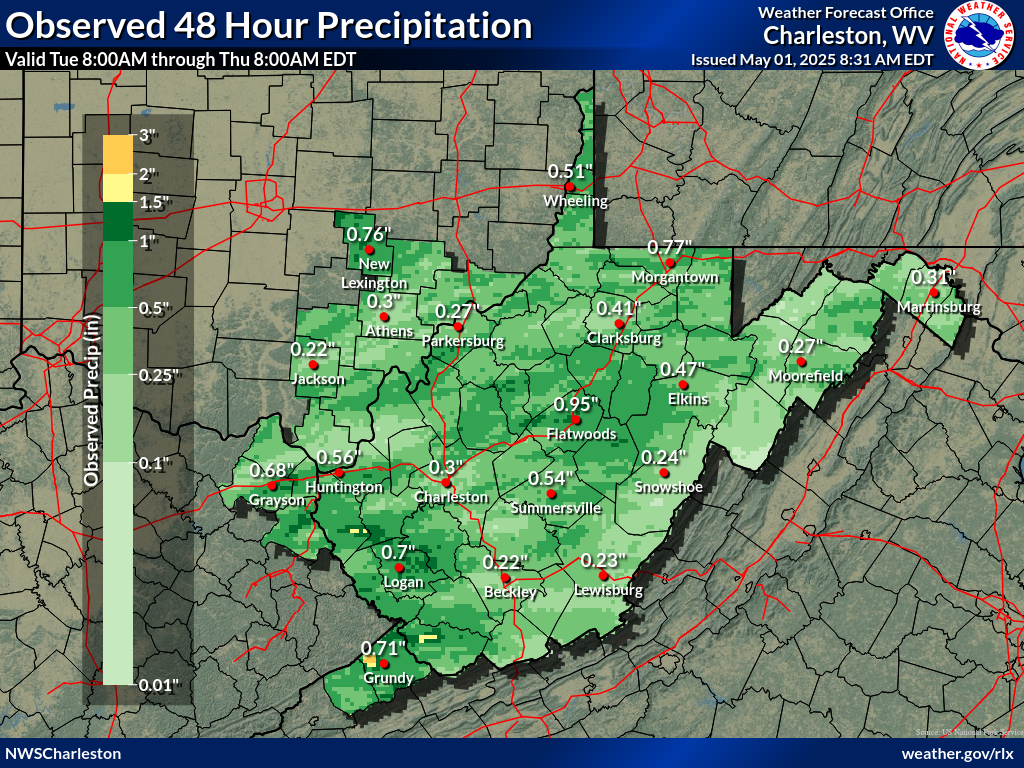
| How Much Rain Has Fallen? (Interactive) | ||
 |
 |
 |
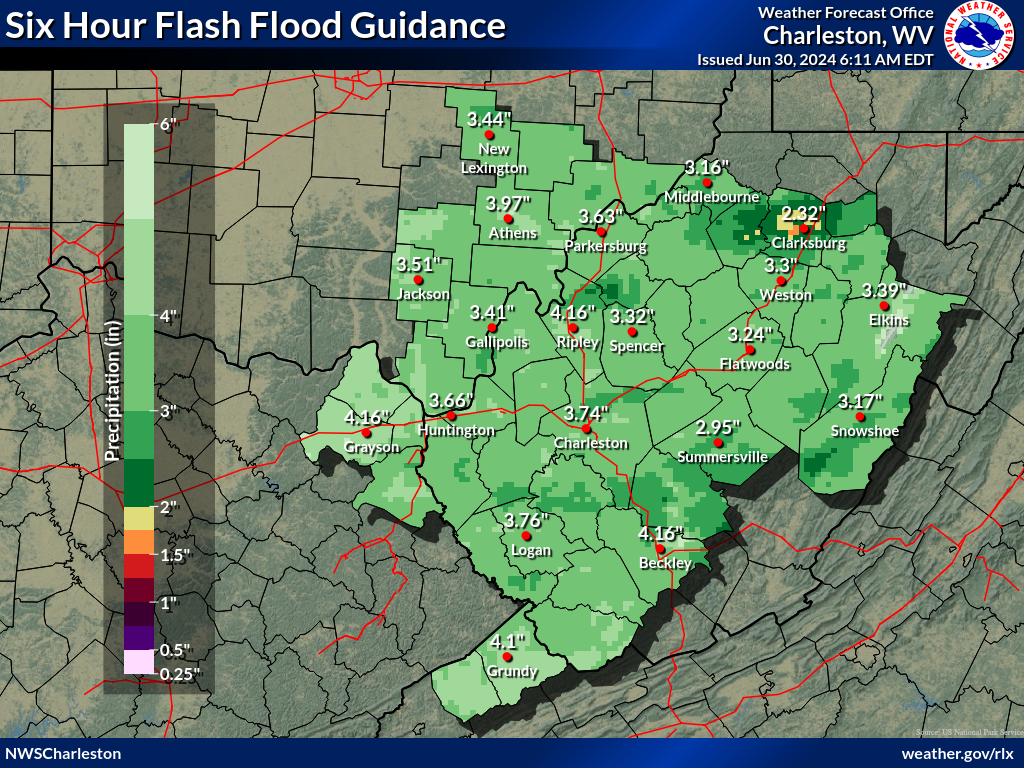
| Flash Flood Guidance |
Flash Flood Guidance (FFG) provides a general indication of the amount of rainfall evenly distributed over various durations (in hours), necessary to cause small streams to overflow their natural banks. During heavy rainfall, accurate interpretation of the guidance consists of the combination of rainfall that has already occurred plus any additional rainfall that can be confidently expected to fall over the same location in the immediate future.
It should be noted that FFG values represent estimates of average soil moisture and stream flow conditions. Flooding may occur with less rainfall than indicated in areas of high rainfall intensities, impervious surfaces, or steep slopes.
| 1 Hour | 3 Hour | 6 Hour |
 |
 |
 |
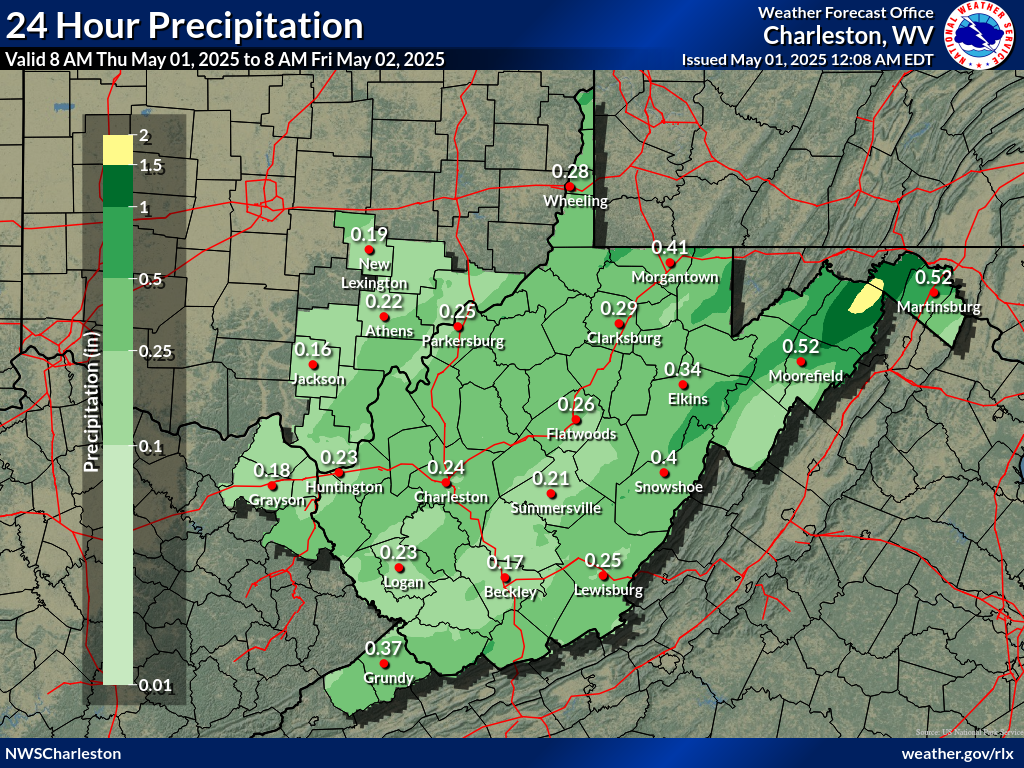
| Precipitation Forecasts | |||
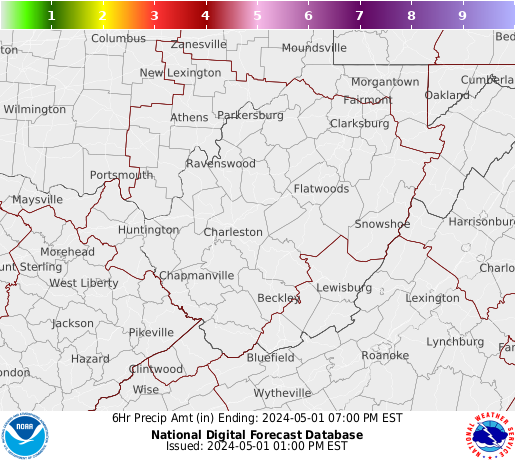
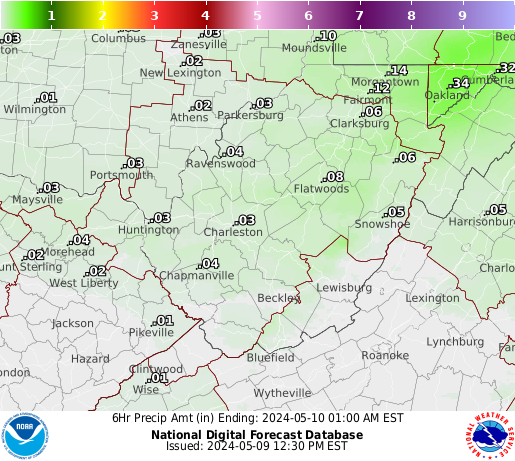
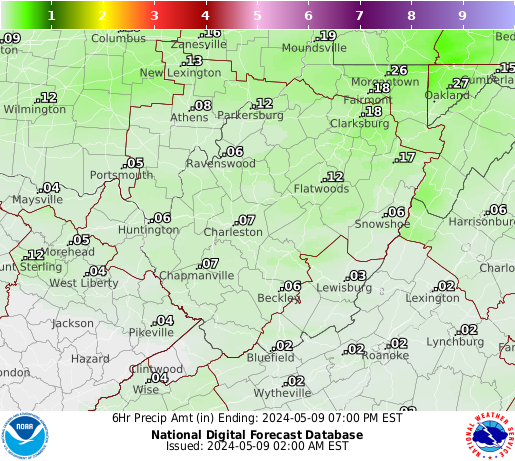
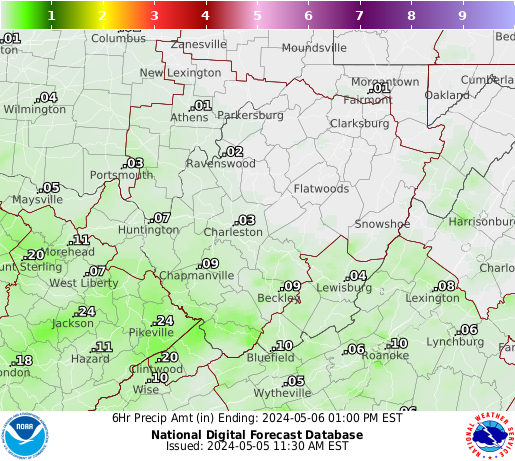
| Today's Precip Forecast | Tomorrow's Precip Forecast | Day 3 Precip Forecast | Day 1 - 3 Total Precip Forecast |
 |
 |
 |
 |
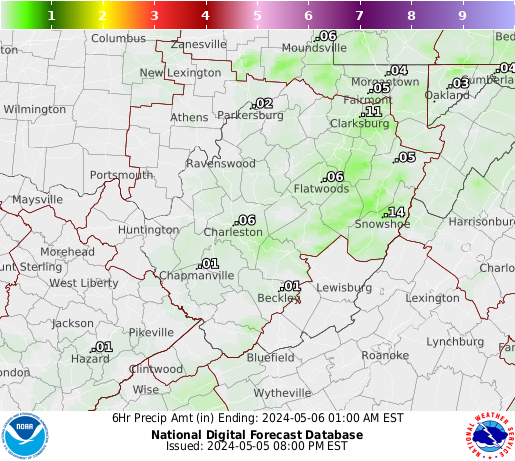
| 0 to 6 hours | 6 to 12 hours | 12 to 18 hours | 18 to 24 hours | 24 to 30 hours | 30 to 36 hours | |
 |
 |
 |
 |
 |
 |
 |
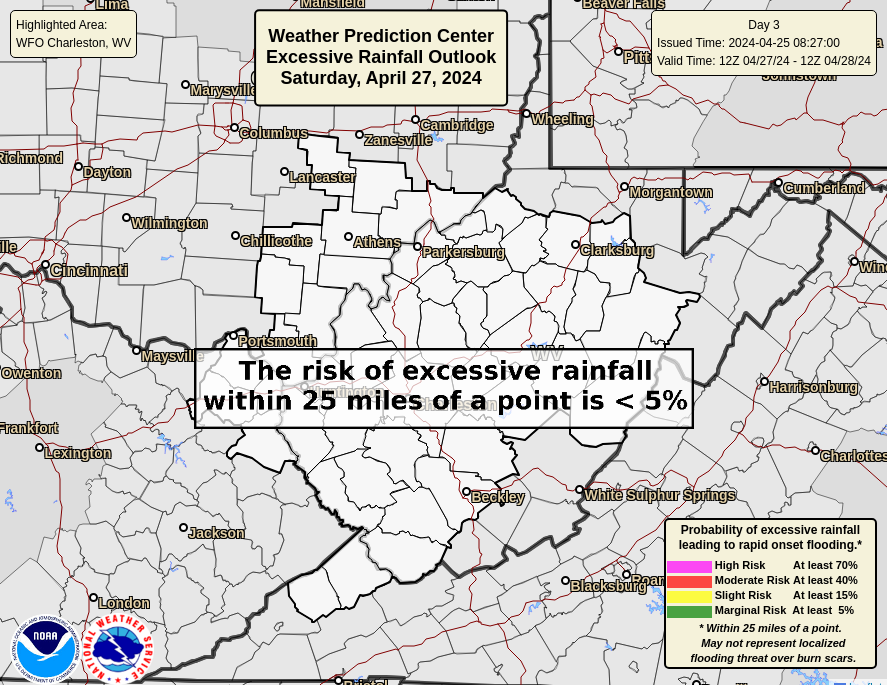
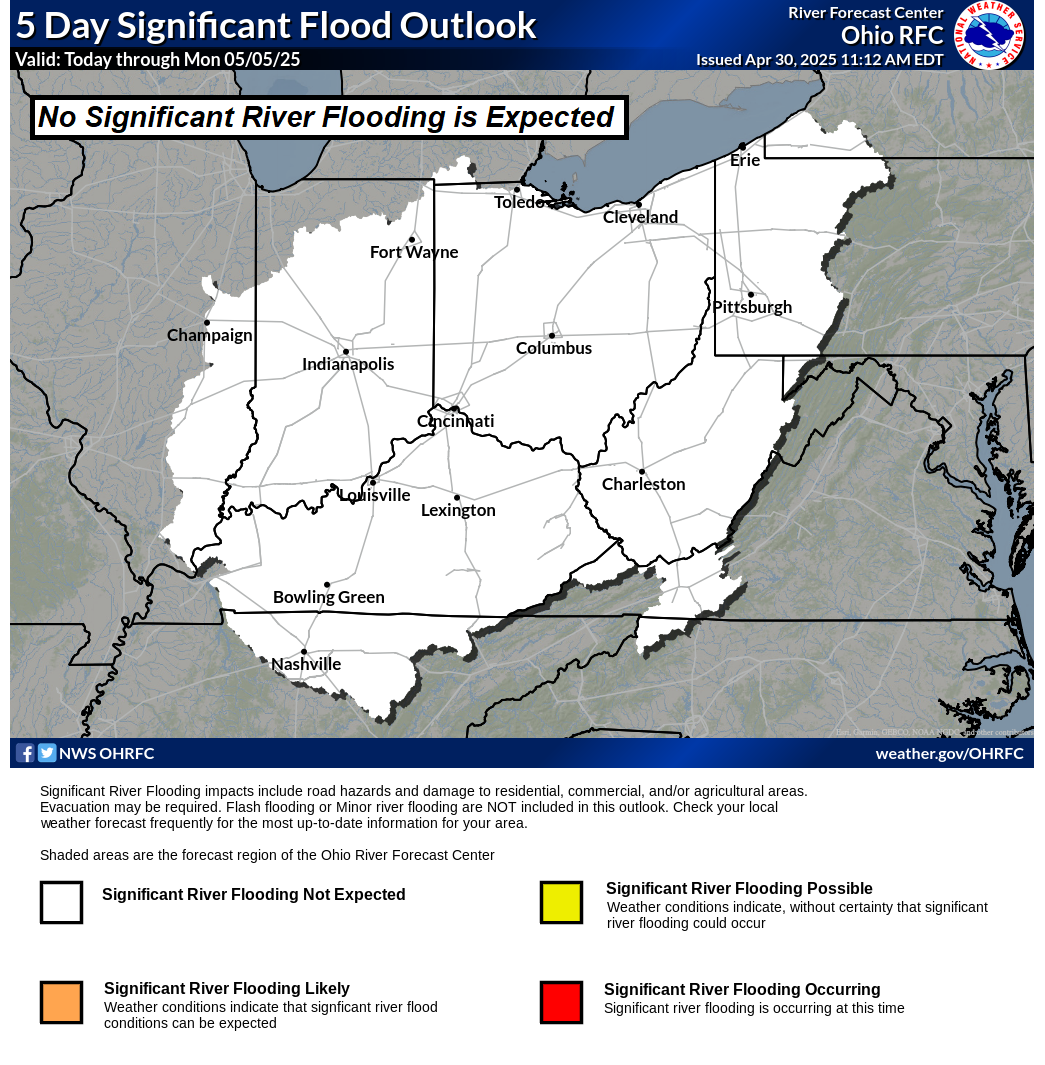
| Day 1 Excessive Rainfall Outlook | Day 2 Excessive Rainfall Outlook | Day 3 Excessive Rainfall Outlook | Ohio River Basin Flood Outlook |
 |
 |
 |
 |
| Day 1 Precipitation | Day 2 Precipitation | Day 3 Precipitation |
 |
 |
 |
| Day 4-5 Precipitation | Day 6-7 Precipitation | 7-Day Total Precipitation |
 |
 |
 |
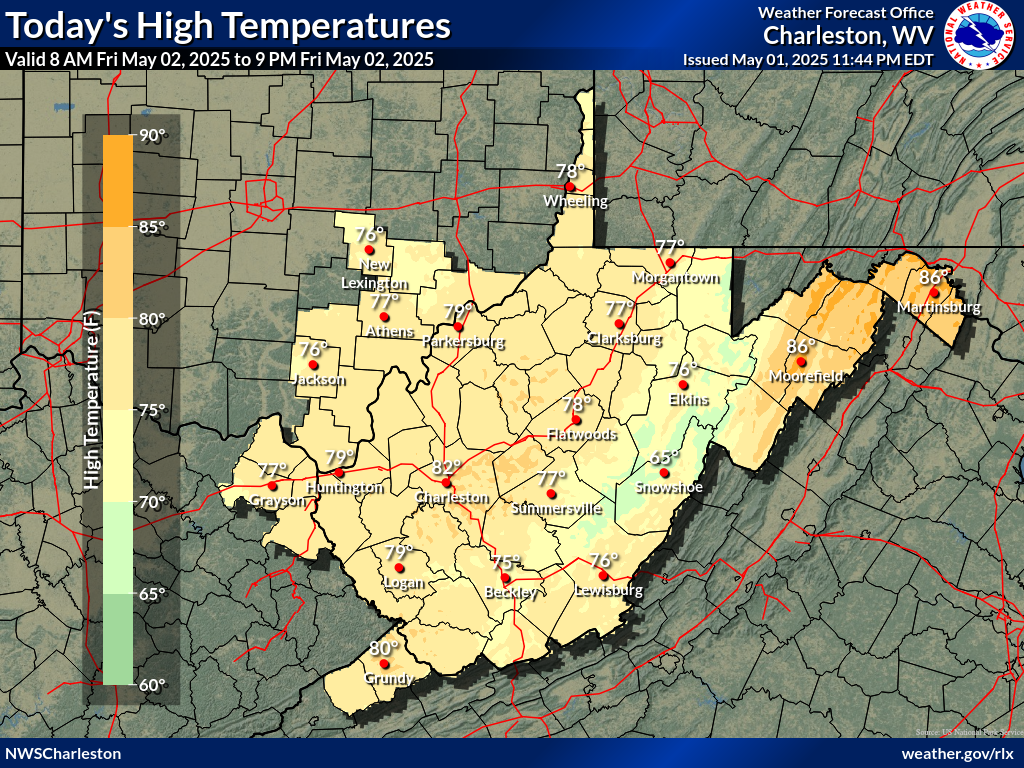
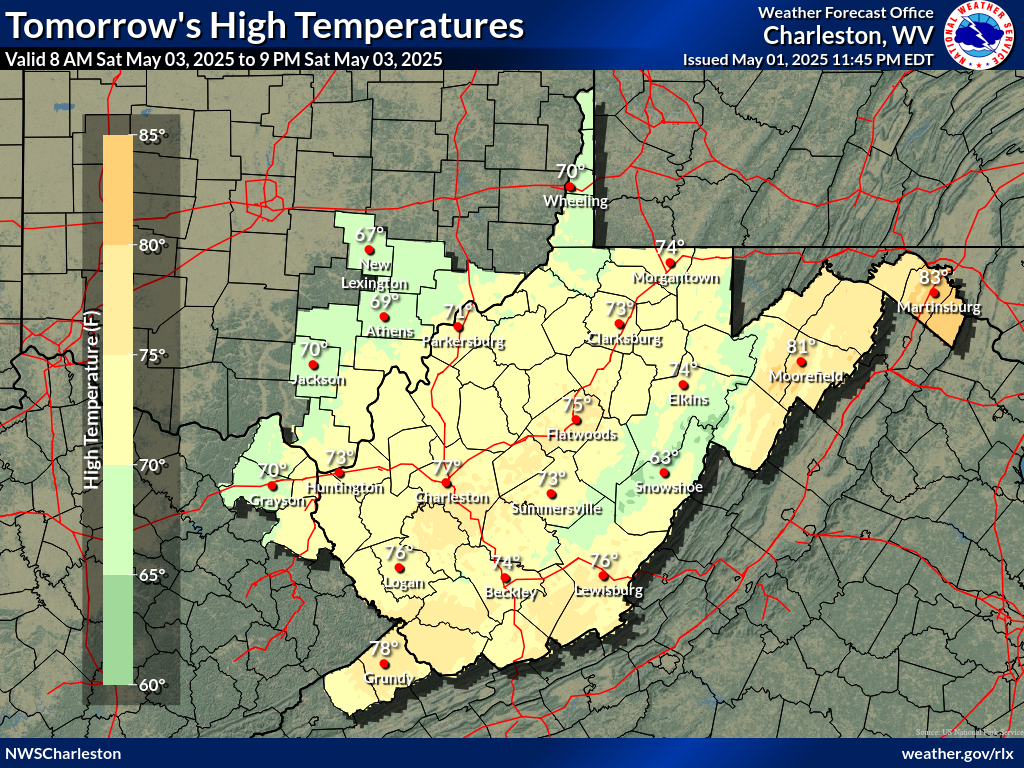
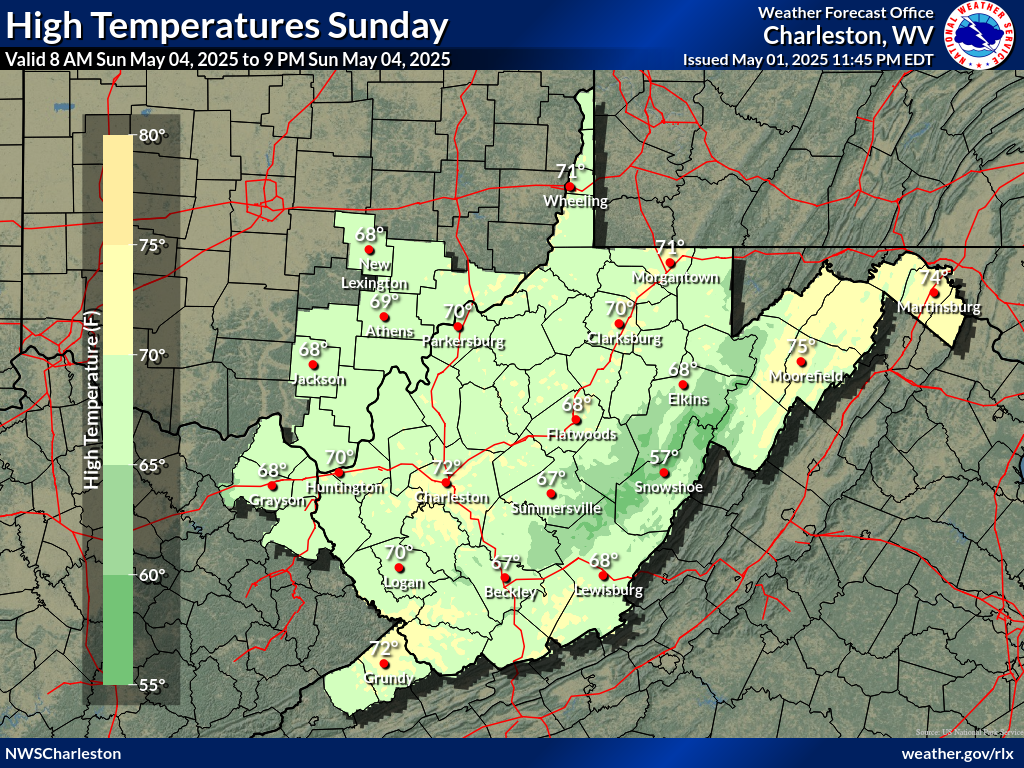
| Day 1 Max Temp | Day 2 Max Temp | Day 3 Max Temp |
 |
 |
 |
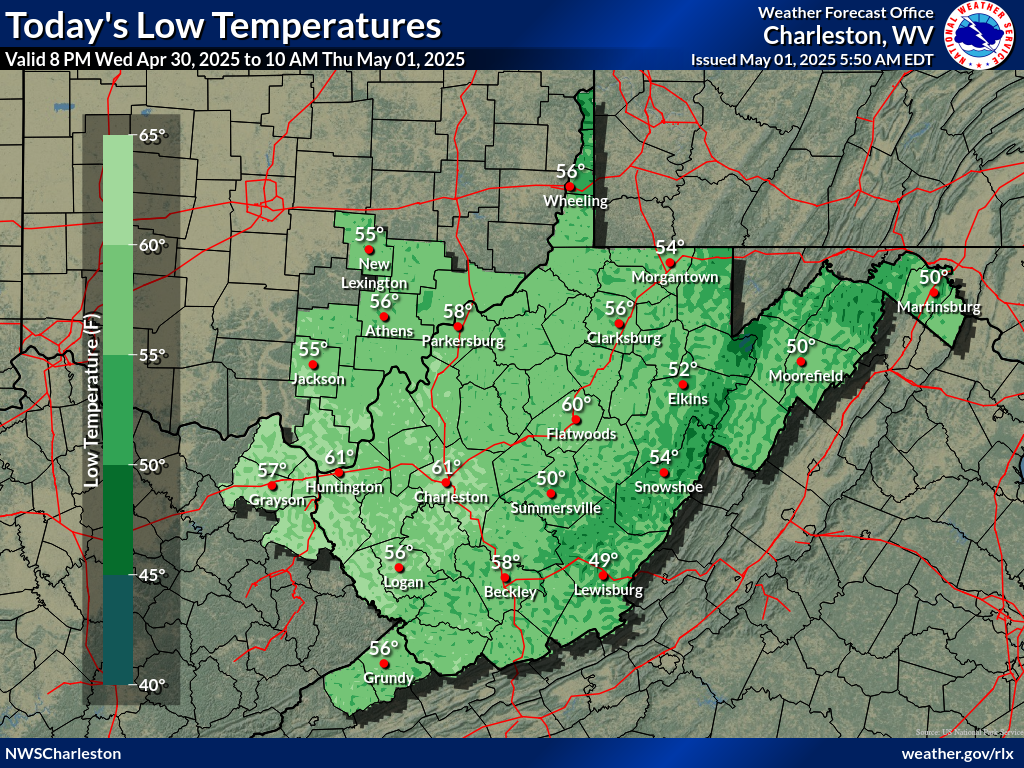
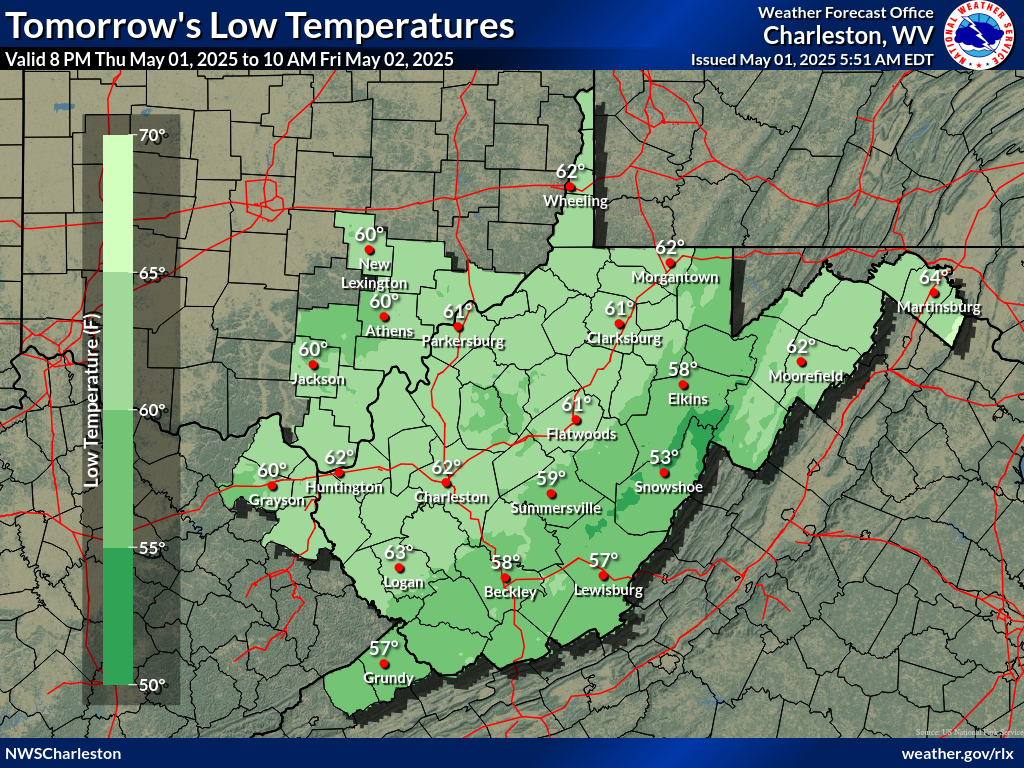
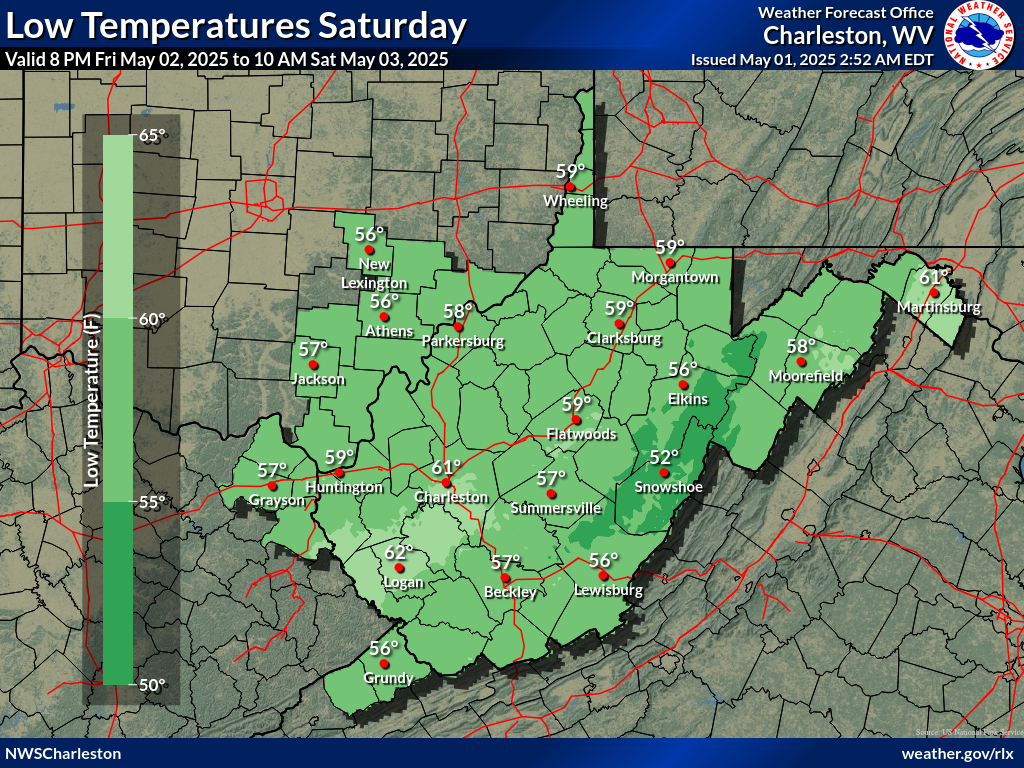
| Day 1 Min Temp | Day 2 Min Temp | Day 3 Min Temp |
 |
 |
 |
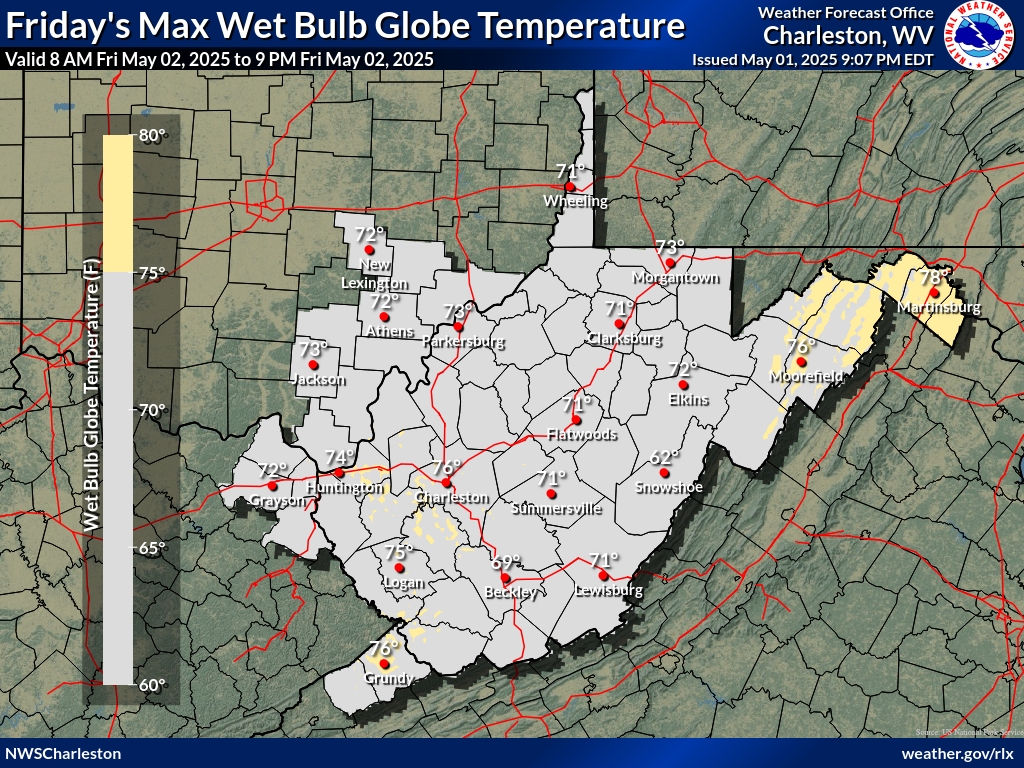
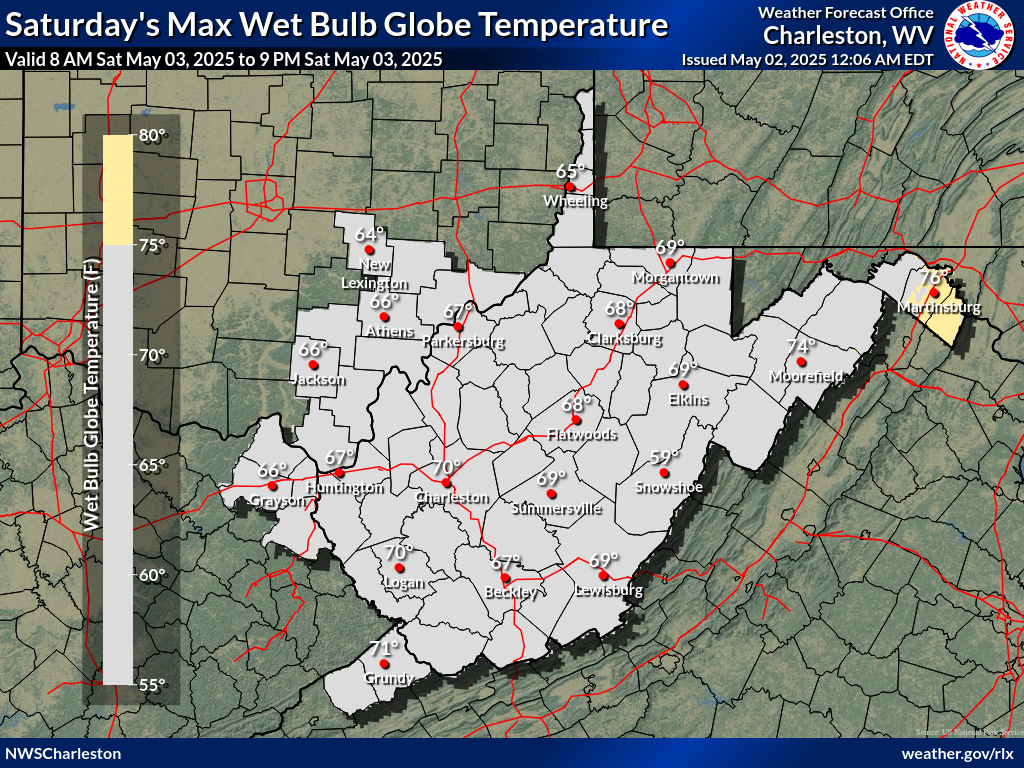
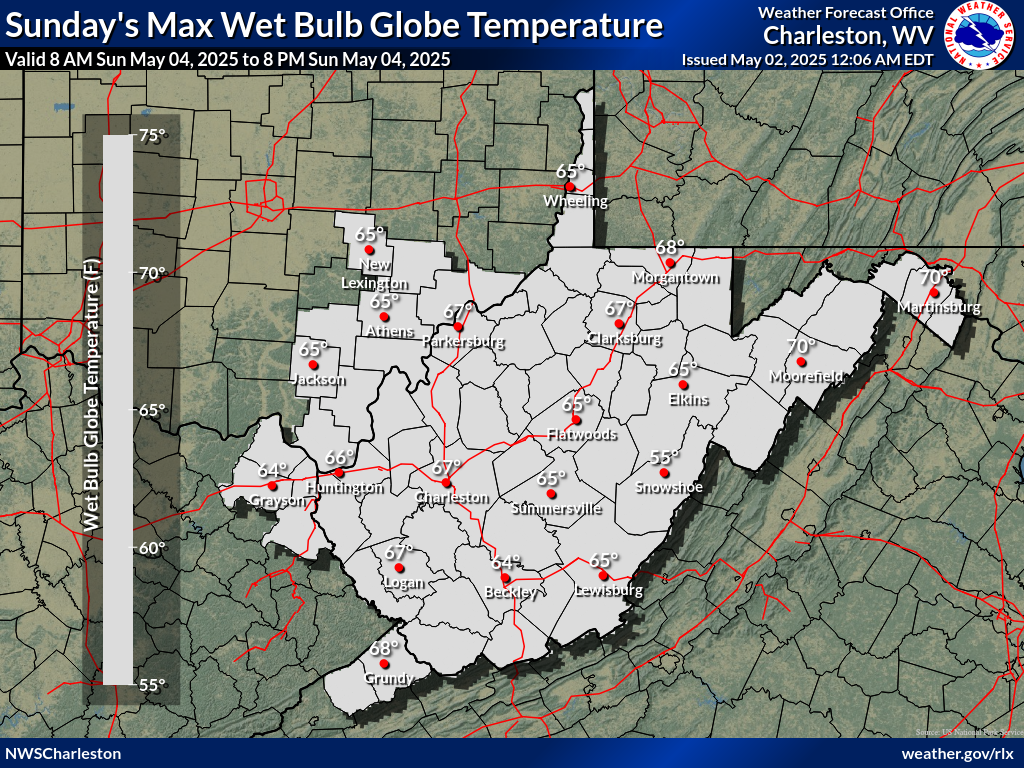
| Day 1 Max WBGT | Day 2 Max WBGT | Day 3 Max WBGT |
 |
 |
 |
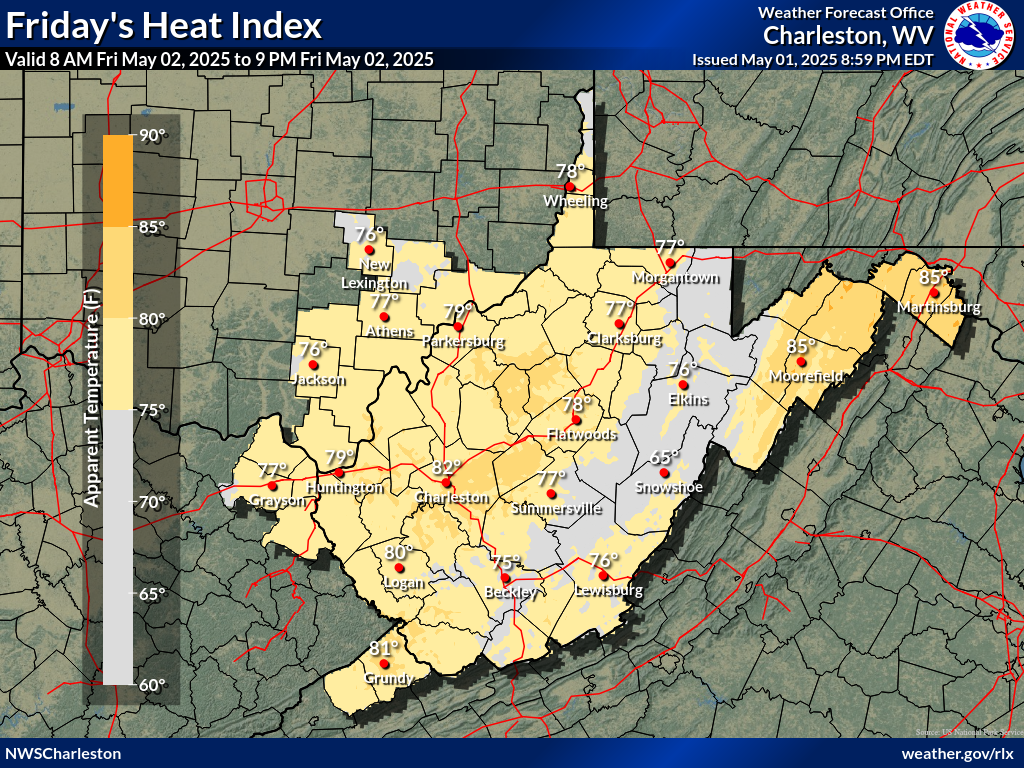
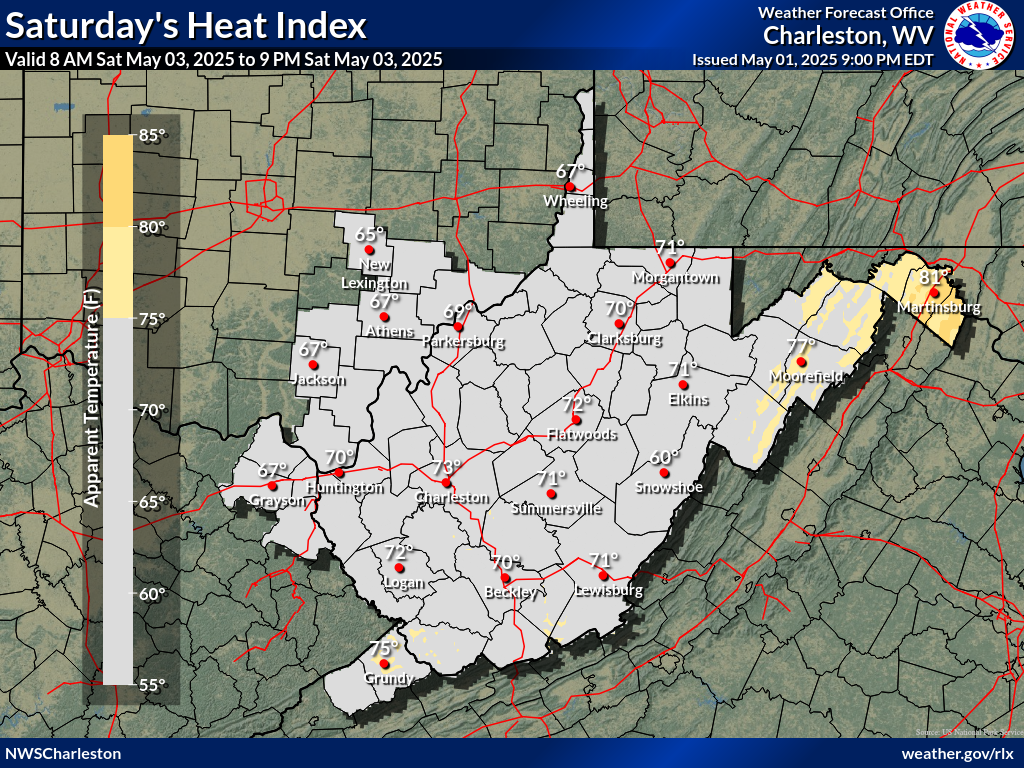
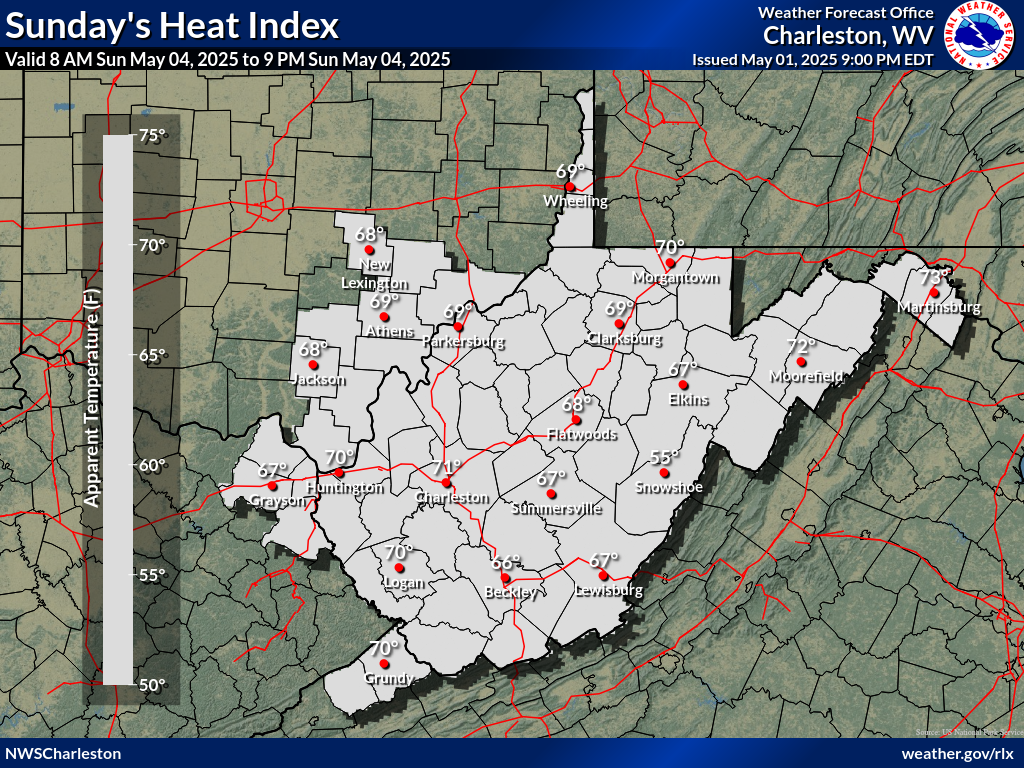
| Day 1 Max Heat Index | Day 2 Max Heat Index | Day 3 Max Heat Index |
 |
 |
 |
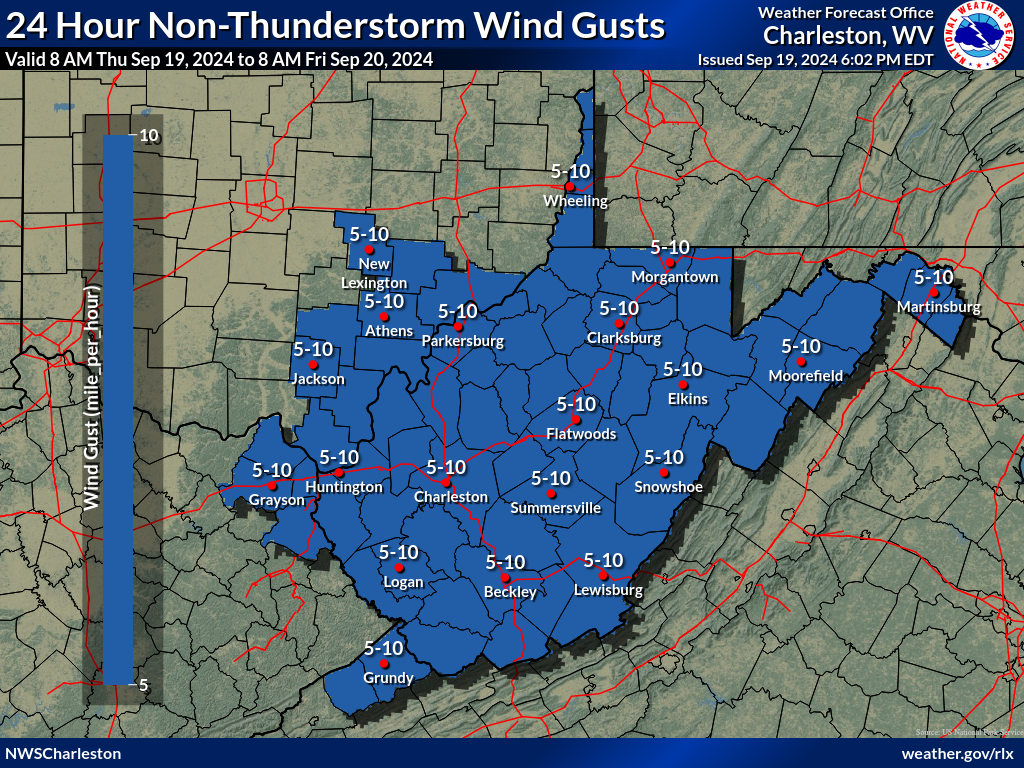
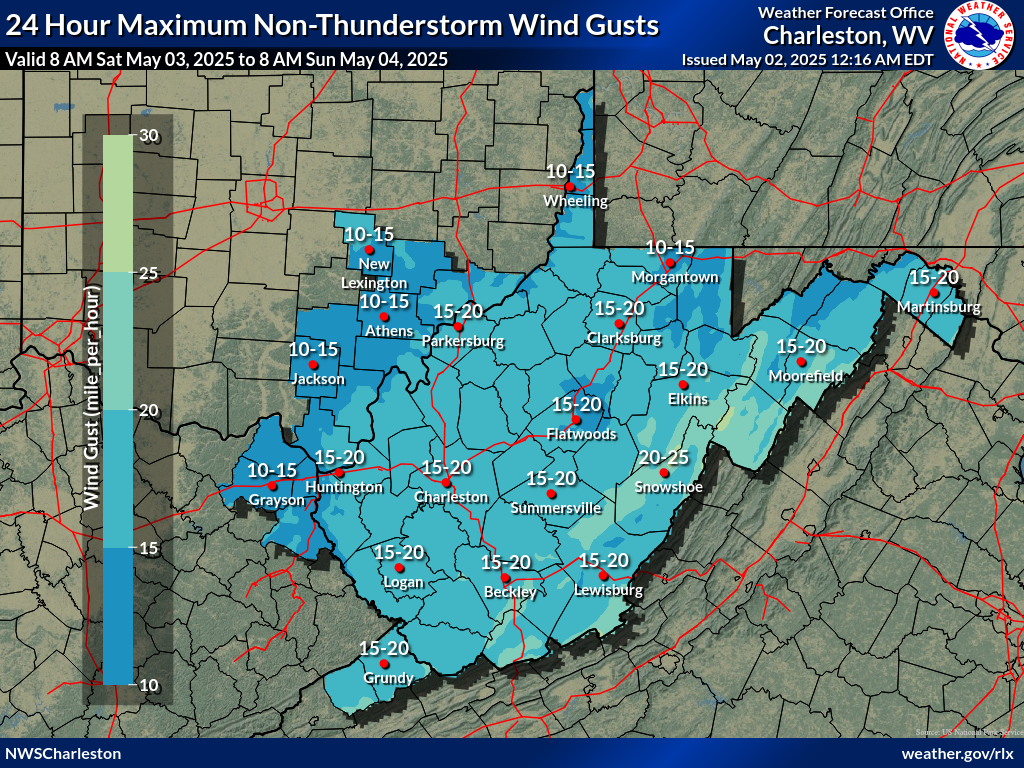
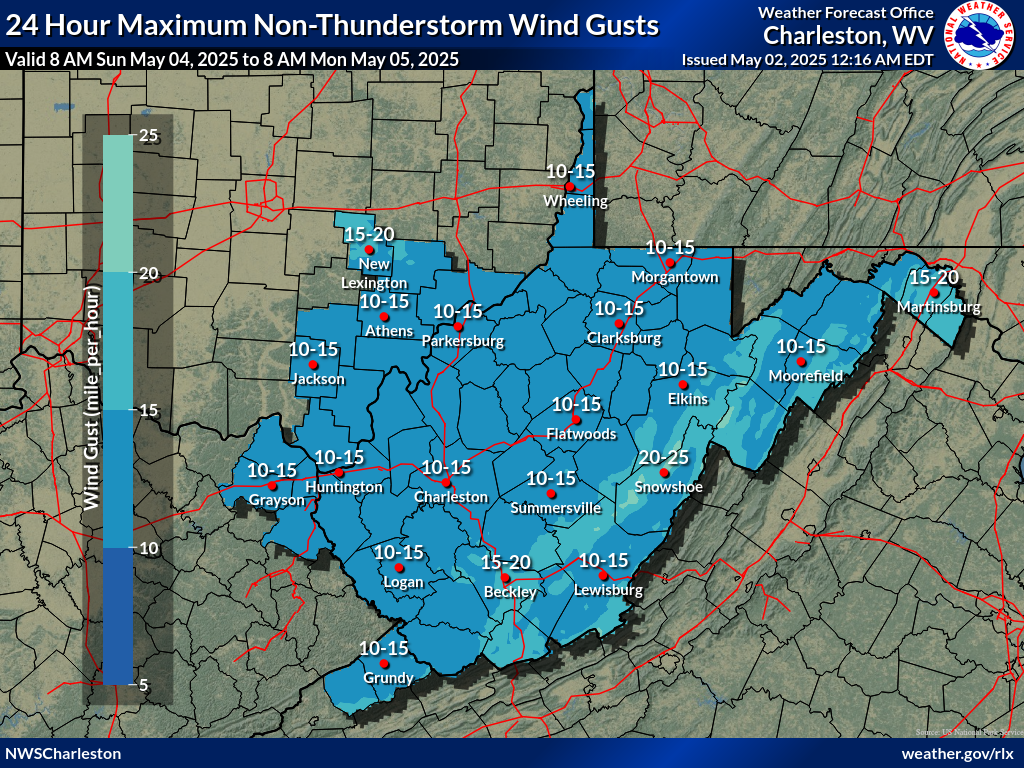
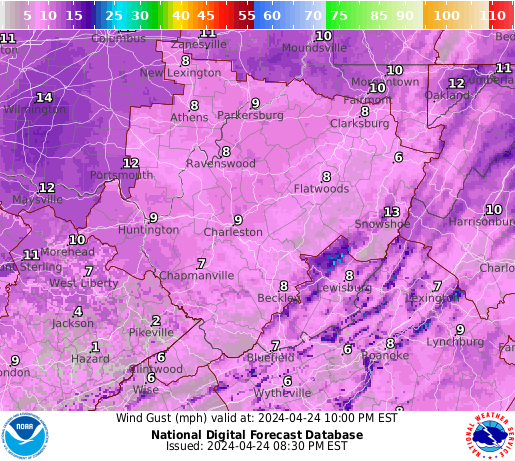
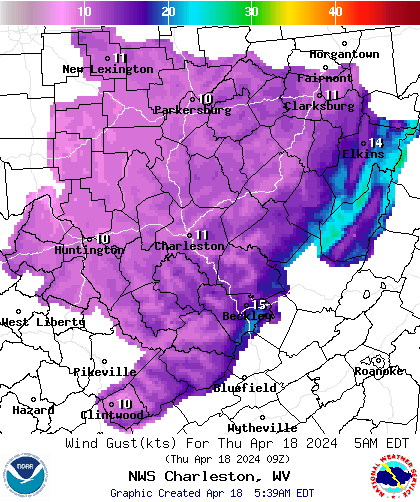
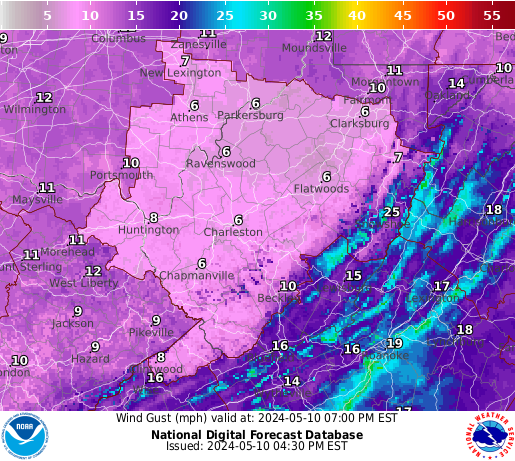
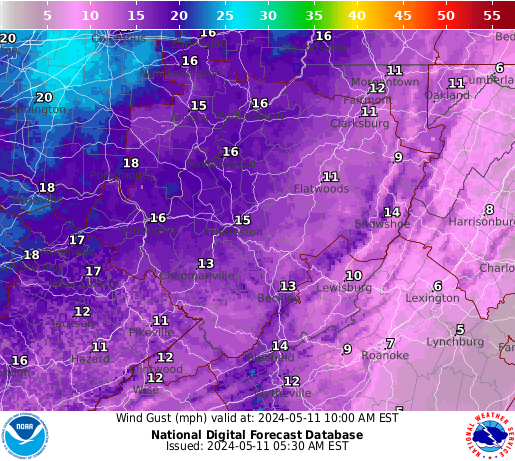
| Day 1 Max Wind Gusts | Day 2 Max Wind Gusts | Day 3 Max Wind Gusts |
 |
 |
 |
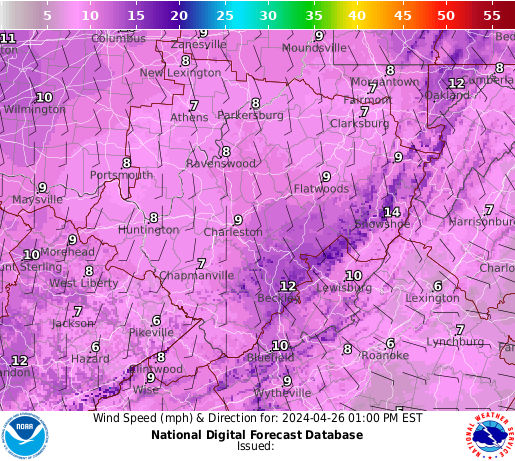
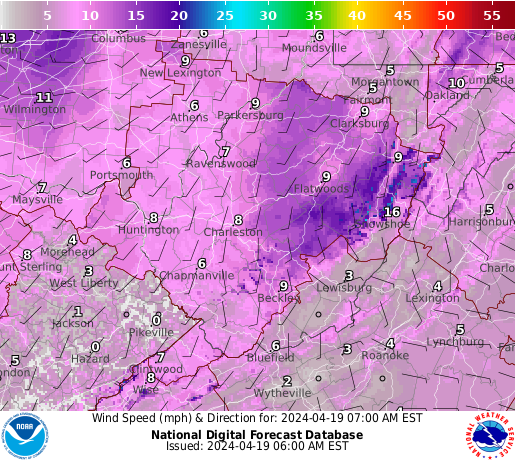
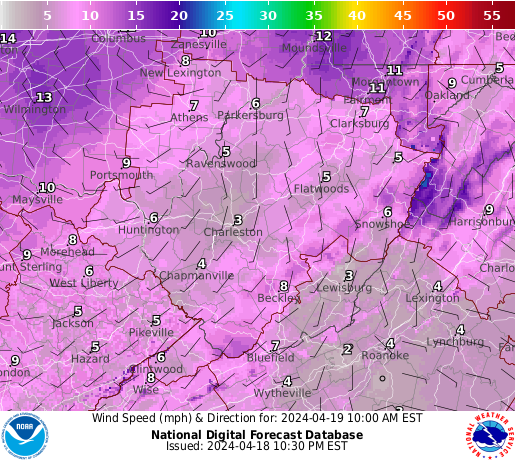
| 3 Hourly Wind Speed & Direction Forecasts |
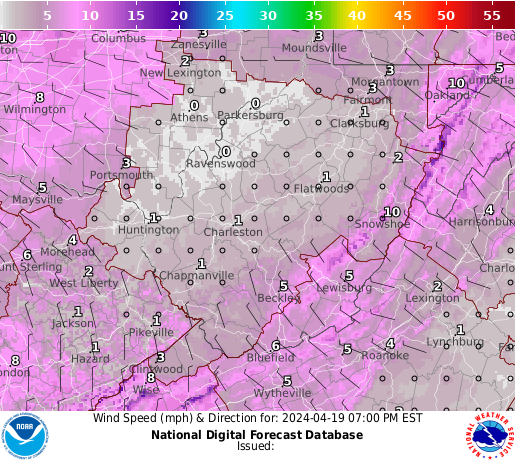 |
 |
 |
 |
 |
 |
|
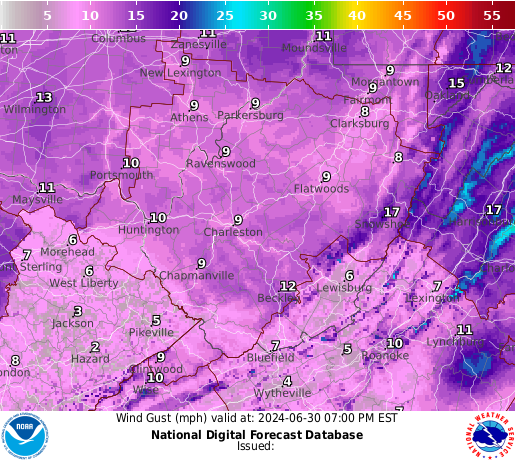
| 3 Hourly Wind Gusts |
 |
 |
 |
 |
 |
 |
|
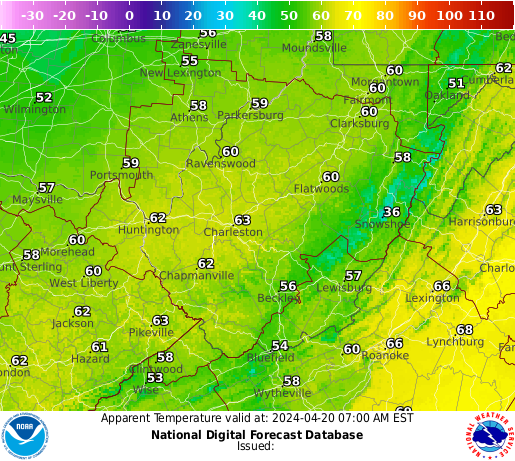
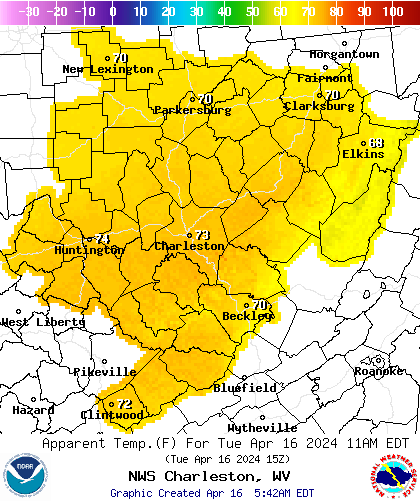
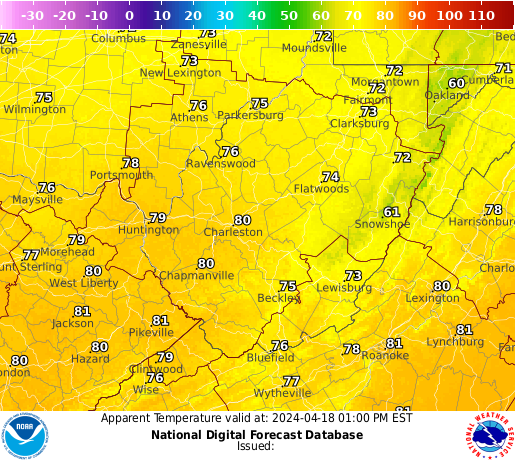
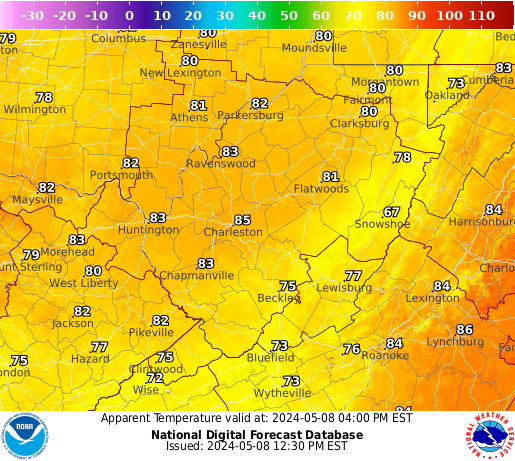
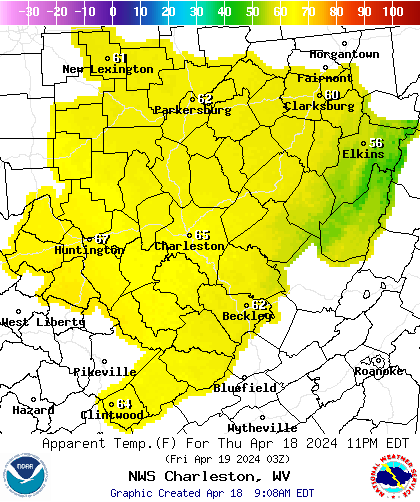
| 3 Hourly Apparent Temerature |
 |
 |
 |
 |
 |
 |
|
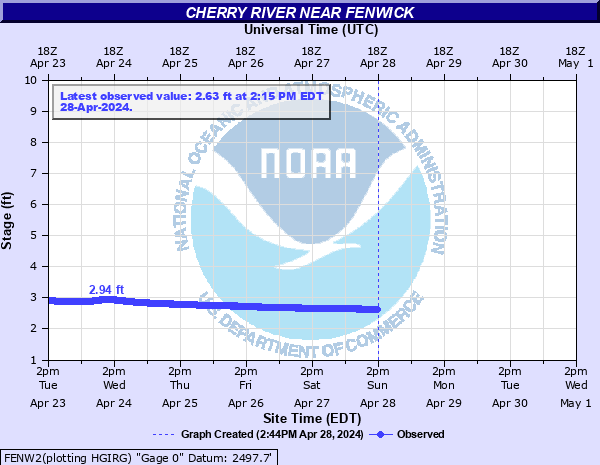
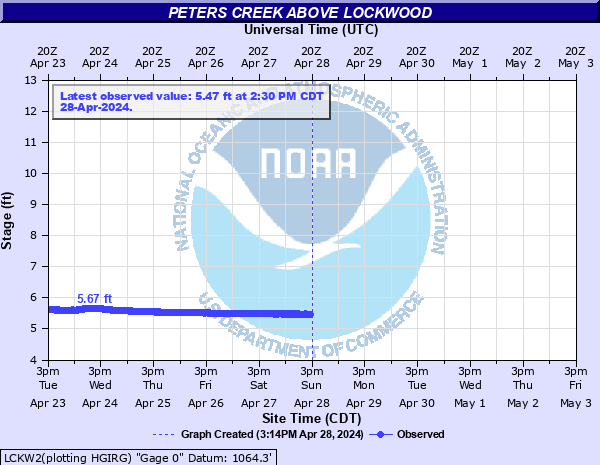
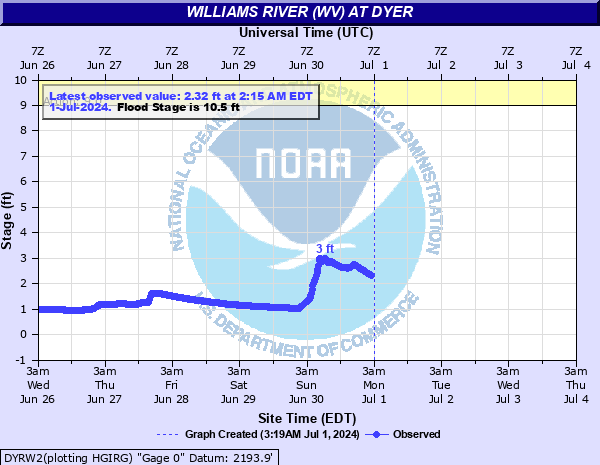
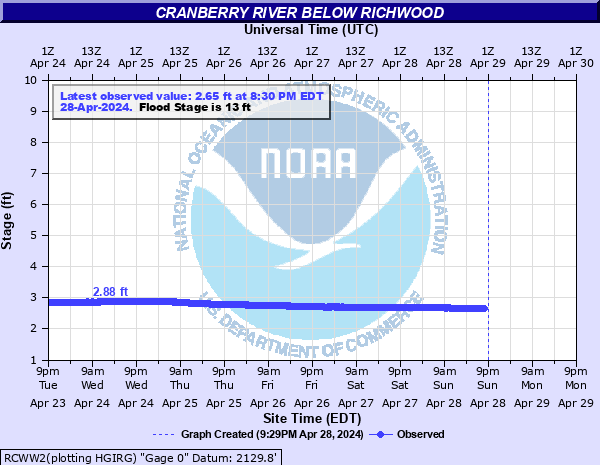
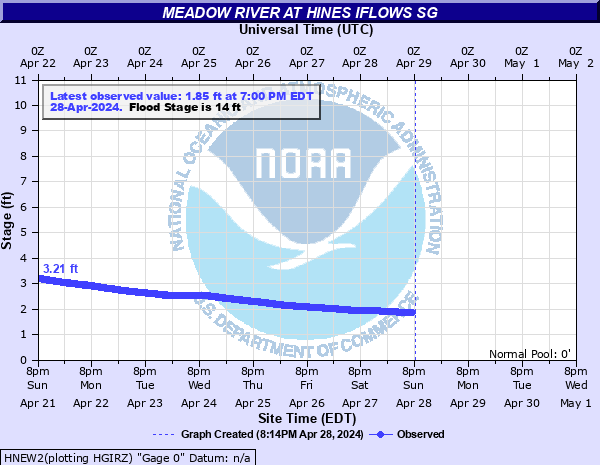
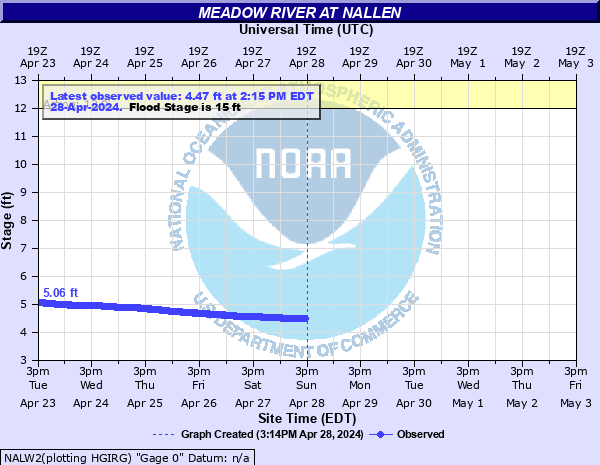
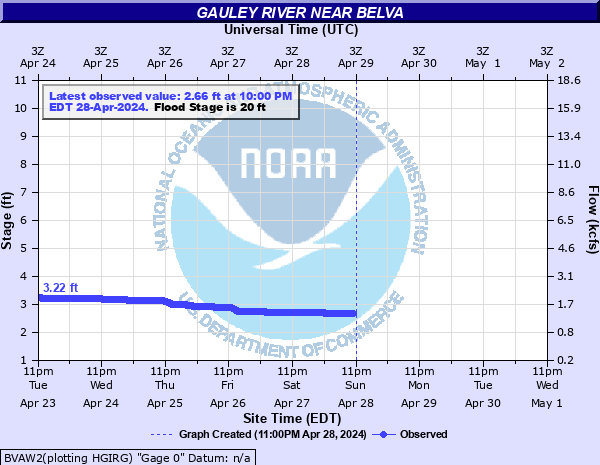
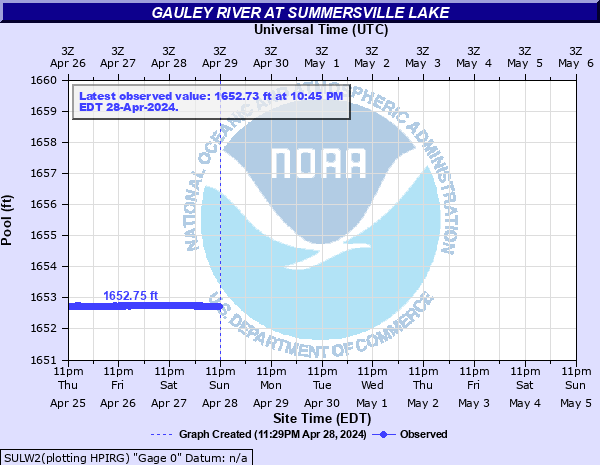
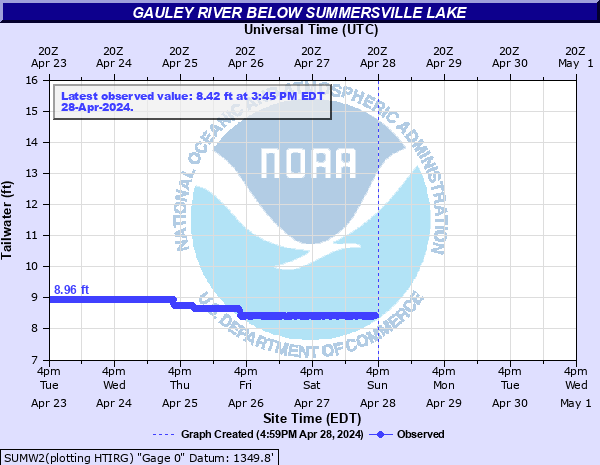
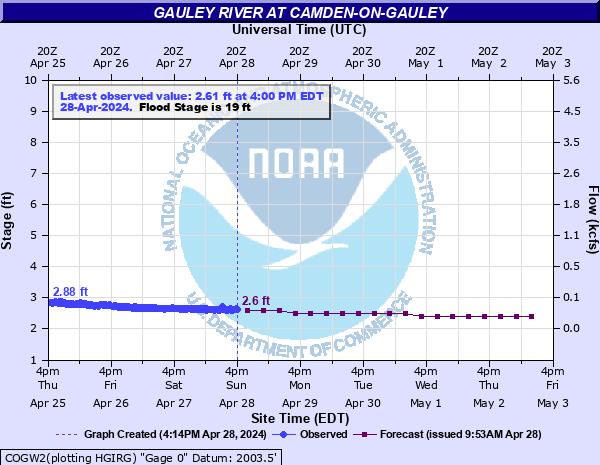
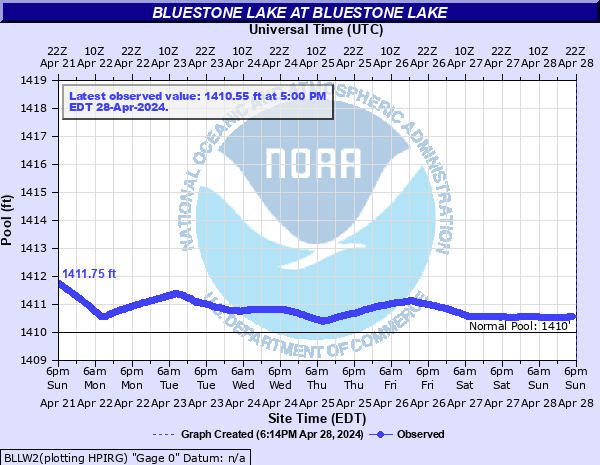
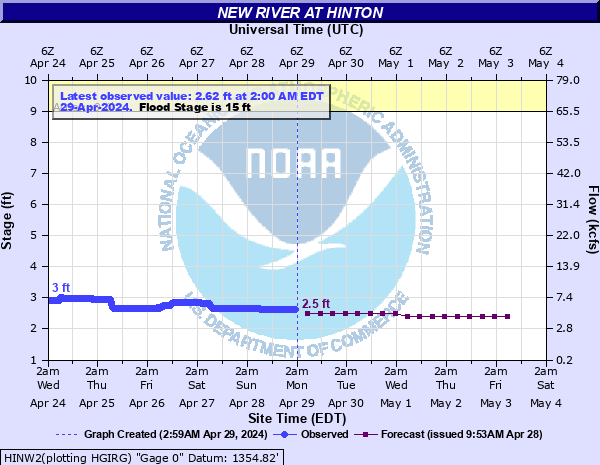
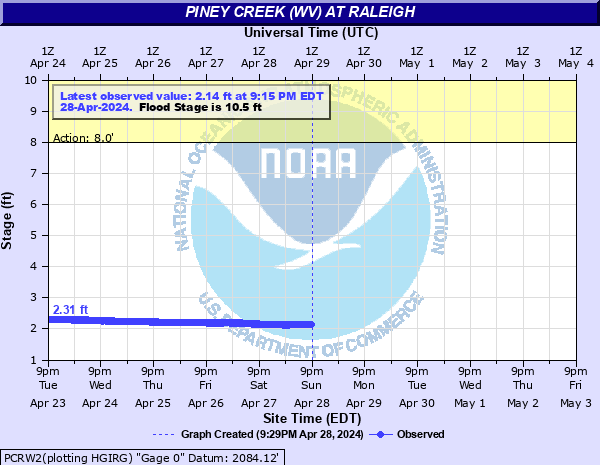
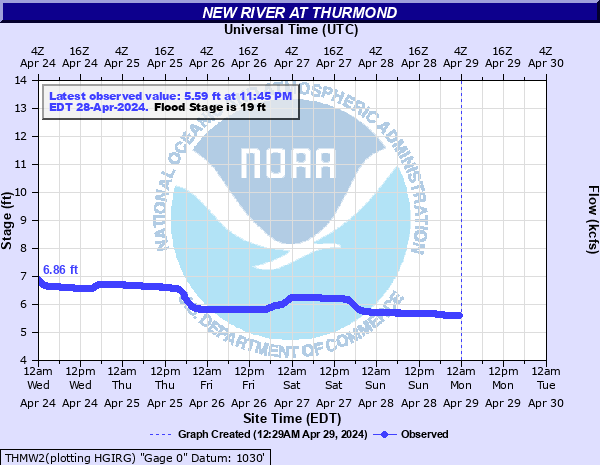
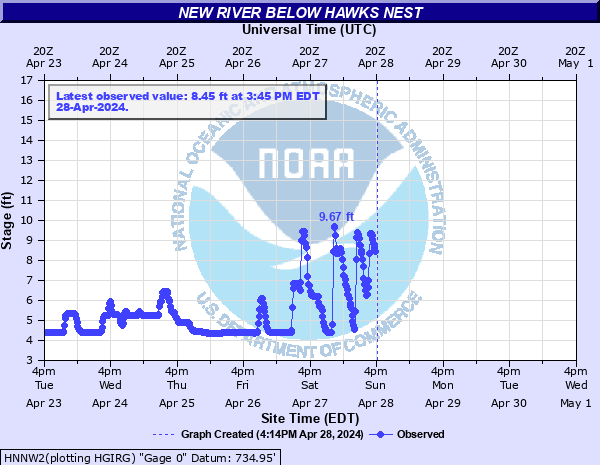
Mouse over each site to display hydrograph.
Hydrographs (showing stages and flows over time) are available through NWPS (National Water Prediction Service) by clicking site names.
|
|||||||||||||||||||||||||||||||||||||||||||||||||||||||||||||||||||||||||||||||||||||||||||||||||||||||||||||||||||||||||||||||||||||||||||||||||||||||||||||||||||||||||||||||||||||||||
|
|
|||||||||||||||||||||||||||||||||||||||||||||||||||||||||||||||||||||||||||||||||||||||||||||||||||||||||||||||||||||||||||||||||||||||||||||||||||||||||||||||||||||||||||||||||||||||||
| Kanawha Basin Dams | ||||||||||
 |
|
|||||||||
|
 |
|
|||||||||
|
 |
|
|
|||||||||||||||||||||||||||||||||||||||||||||||||||||||||||||||||||||||||||||||||||||||||||||||||||||||||||||||||||||||||||||||||||||||||||||||||||||||||||||||||||||