Winter Storm February 11 - 13th 2006
After a quiet winter season in the months of December and January winter finally made an appearance by mid February. Zonal flow resulted in above average normal temperatures and Pacific based storms during the first several weeks of winter. Temperatures then fell below normal for the first part of February due to a persistent ridge of high pressure across the western United States, which resulted in reinforced shots of cold air over the eastern United States. Below is a statement issued by the National Weather Service summarizing a warm January in the middle Ohio Valley.
PUBLIC INFORMATION STATEMENT
NATIONAL WEATHER SERVICE CHARLESTON WV
1026 AM EST WED FEB 1 2006
...PUBLIC INFORMATION STATEMENT...
WEATHER-WISE...JANUARY 2006 WILL BE REMEMBERED FOR ITS LACK OF SNOW AND COLD. OLD MAN WINTER SEEMED TO VISIT ONLY FOR A DAY AT A TIME...THEN LEAVE. THIS ALLOWED ABOVE NORMAL TEMPERATURES TO CONTROL THE MID OHIO VALLEY AND CENTRAL APPALACHIANS.
WHEN A MONTHLY MEAN TEMPERATURE DEVIATES FROM NORMAL BY ABOUT 2 DEGREES, IT IS QUITE NOTICEABLE BY MOST FOLKS. THIS JANUARY WAS 8 TO 12 DEGREES ABOVE NORMAL.
HERE IS REPRESENTATIVE DATA FOR SPECIFIC SITES...
THE AVERAGE MONTHLY TEMPERATURE AT THE TRI STATE AIRPORT FOR THE ASHLAND...IRONTON...HUNTINGTON VICINITY WAS 44.0 DEGREES...OR 11.3 DEGREES WARMER THAN USUAL. IT WAS THEIR 5TH WARMEST JANUARY ON RECORD.
AT CHARLESTON...THE AVERAGE JANUARY TEMPERATURE WAS 43.2 DEGREES. THAT IS 9.8 DEGREES ABOVE A NORMAL JANUARY. IT WAS THE 9TH WARMEST JANUARY FOR THE CAPITAL CITY.
IN THE MID OHIO VALLEY...PARKERSBURG AVERAGE JANUARY TEMPERATURE WAS 42.3 DEGREES...OR 11.2 DEGREES WARMER THAN USUAL. IT WAS THE 4TH WARMEST JANUARY...ON THE BOOKS...AT PARKERSBURG.
THE COOPERATIVE OBSERVERS SITE IN DOWNTOWN CLARKSBURG HAD AN AVERAGE TEMPERATURE FOR JANUARY OF 39.5 DEGREES. THAT`S THE 5TH WARMEST JANUARY FOR CLARKSBURG.
ACROSS THE SOUTHERN MOUNTAINS AT BECKLEY...THE AVERAGE MONTHLY TEMPERATURE WAS 39.2 DEGREES...OR 8.8 DEGREES ABOVE NORMAL. IT WAS THE 7TH WARMEST JANUARY FOR BECKLEY.
EVEN IN THE NORTHERN MOUNTAINS...THE AVERAGE MONTHLY TEMPERATURE WAS 38.5 DEGREES AT ELKINS. THAT IS 9.9 DEGREES WARMER THAN USUAL. IT WAS THE 8TH WARMEST JANUARY FOR THAT TYGART RIVER VALLEY COMMUNITY.
IN TERMS OF SNOW...ONLY 0.2 INCHES FELL AT HUNTINGTON...WHICH TIES
1924 AND 1934 FOR THE THIRD LEAST AMOUNT OF SNOW IN JANUARY FOR
THAT OHIO RIVER COMMUNITY.
Below is a table of snowfall for the months of December and January along with total snowfall from February 11 - 13th. Notice how Charleston and Huntington met or exceeded their season to date totals in just this storm.
|
Location |
December 2005 |
January 2006 |
February 11 -13th 2006 |
|
Charleston |
4.7 |
3.1 |
7.1 |
|
Huntington |
0.6 |
0.2 |
3.0 |
|
Beckley |
5.3 |
7.5 |
14.0 |
|
Elkins |
16.2 |
11.8 |
6.0 |
Snowfall totals for the winter season were below normal, but a low pressure system ejecting out of the Gulf Coast States February 11th changed all that. With a clipper crossing Friday February 10, colder weather preceded the storm, allowing for precipitation to take the form of snow for the most part. Light rain was observed briefly during the overnight hours Friday night across southern West Virginia, northeast Kentucky, and southwestern Virginia. As the clocked moved towards dawn Saturday, precipitation changed to all snow area wide. The northern extent of precipitation reached Elkins by dawn, while heaver precipitation and moderate snow occurred in southwestern Virginia by Saturday morning.
Surface temperatures hovered around freezing in the valleys, and soil temperatures were in the mid 30s. As a result, snow accumulations during the day Saturday where confined to hilltops and ridges in the lowlands, and the mountains. By midday Saturday, 1 to 3 inches was common in the mountains and higher elevations in the lowlands. Pocahontas County received 5 to 6 inches by 12pm Saturday as did the higher elevations in southwestern Virginia like Breaks Interstate Park. Snow continued during the day and accumulated little over lower elevations in the lowlands. Meanwhile, it continued to pile up in the mountains. Snowfall reports Saturday evening depicted widespread 4 to 8 inch snow totals in the mountains and 1 to 3 inches in the lowlands.
The surface low continued up the eastern seaboard Saturday night and snow persisted across most of Charleston's forecast area. Snow began to taper off after dawn Sunday with the surface low off the Jersey shore. The upper air system and northwest winds kept the snow machine going in the mountains. A band of moderate to at times, heavy snow tracked across southern Ohio, northeast Kentucky, and southern West Virginia in response to the aforementioned upper air system. Snowfall rates with this band where an inch an hour and persisted for two to three hours. Prior to the accumulation with the snow band, only an inch of snow fell over southeast Ohio and northeast Kentucky. Breaks in the clouds and the resultant sunshine allowed the atmosphere to become unstable. Consequently, scattered snow showers were observed across the entire area Sunday afternoon.
Total snowfall ranged from less than a half an inch across portions of southeastern Ohio to nearly a foot in the northern West Virginia Mountains and higher elevation of southwestern Virginia. Much of the lowlands ended up with 2 to 4 inches. To see a graphic representation of the snowfall for the Charleston, WV county warning area an image is supplied below. Sample points throughout the map represent snowfall in tenths of an inch.

Figure 1 Total snowfall for the Winter Storm
This storm most resembled the storm of December 1969 (Kocin and Uccellini) due to its upper level characteristics.Snow amounts were quite similar across West Virginia when comparing the two storms with three inches along the Ohio River and a foot in the mountains. The 850mb analysis from the December 1969 storm mirrored the plots from the February 11-13th storm. An open wave became closed off as it reached northern Virginia and eastern Maryland. Farther up, 500mb heights analysis also aligned well with a strong ridge across the western United States and a transitory full latitude trough across the eastern United States. In the days leading up to the event, comparisons looked similar to the February 1967 storm. However, the 850 low verified weaker than what was projected by the NCEP suite at 72 to 84 hours.
The National Weather Service handled this event extremely well with a winter storm watch hoisted for the northern and central mountains of West Virginia Thursday afternoon February 9th. The following midnight shift expanded the watch farther south in southwestern Virginia and westward to northeastern Kentucky. The winter storm watch was subsequently upgraded to a heavy snow warning in the mountains Friday afternoon February 10th, while the remainder of the winter storm watch was changed to a snow advisory that evening.
As the case with heavy snowfall across the northeast and mid-Atlantic, a surface low tracked up the eastern seaboard emerging offshore near the southern Jersey coast then tracked east northeast south of Long Island, NY and southern New England. Typically with lows tracking up the east coast warm air surges northward due to an inverted trough setting up on the leeward side of the Appalachians yielding rain opposed to snow. However, a reinforcing shot of cold air arrived Friday and a northerly low level wind component allowed temperatures aloft and at the surface to be sub-freezing.
Given the track of the surface and intensity of the 850mb across central Virginia (not pictured), most of the county warning area was too far west to see substantial snowfall. In the cumulative snowfall map, less than an inch was observed west of the Ohio River. Due to the close proximity of the mountains to the center of the lower and upper level cyclone, they received the greatest snowfall. Of course, colder ground temperatures allowed for snow to accumulate during the day Saturday February 11th in the mountains, while lower elevations experienced wet snow that didn't accumulate.
The following images chronicle the surface low progression and upper air pattern over the weekend.
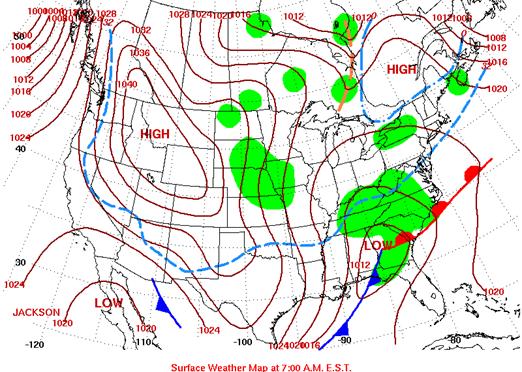
Above is the surface map for Saturday February 11 2006
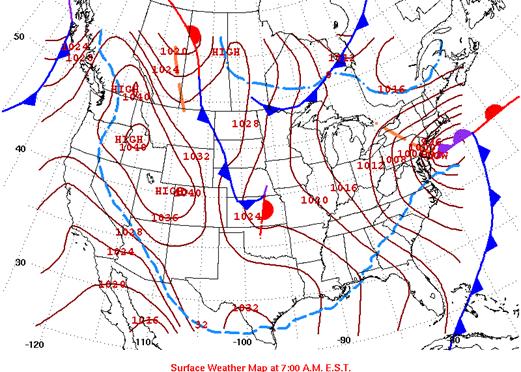
Above is the surface map for Sunday February 12 2006
500mb analysis for Saturday February 11 2006
500mb analysis for Sunday February 12 2006
The above surface and upper air charts came from HPC's daily weather map webpage. These maps are accessible at the following link: https://www.hpc.ncep.noaa.gov/dailywxmap/

