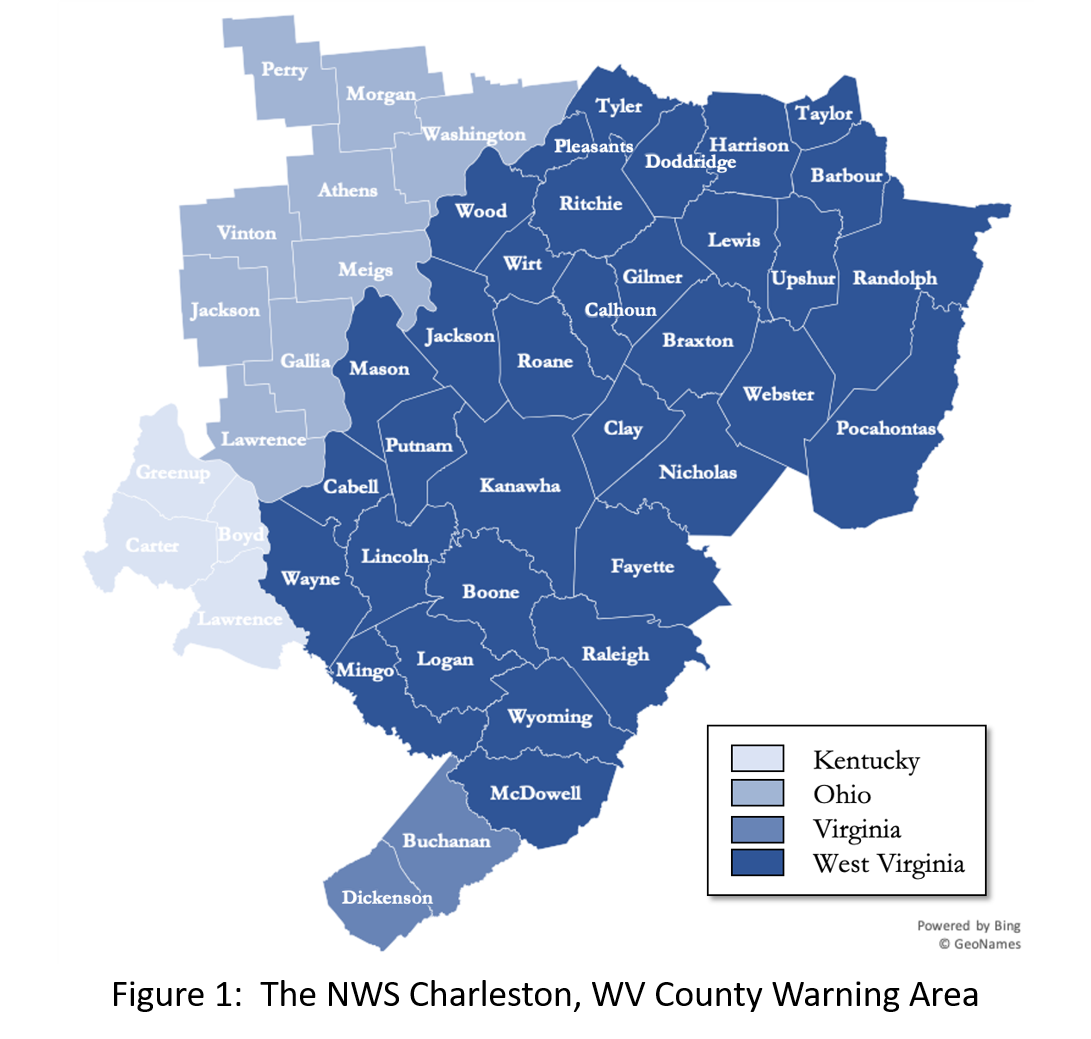
Snowfall varies widely across the NWS Charleston’s area of responsibility (Figure 1) – otherwise known as the CWA, due to varied terrain and elevation. The blue line across the top portion of Figure 2 (below) gives the location of the cross section and the grey box at the bottom of the image showing how elevation changes as you move across that line from point A to point B. Point A depicts the type of terrain typical to the western portion of the CWA—known as the lowlands. Elevations are rather low (in the hundreds of feet) and the landscape is mainly characterized by rolling hills. Point B, the eastern edge of the CWA, falls within the Appalachian Mountains where elevations generally range from 2,000 to 4,000 ft. above sea level. The central portion of the CWA holds a mixed landscape and is a transition zone between the mountains and lowlands. This area contains both hills and cliffs, valleys and gorges.
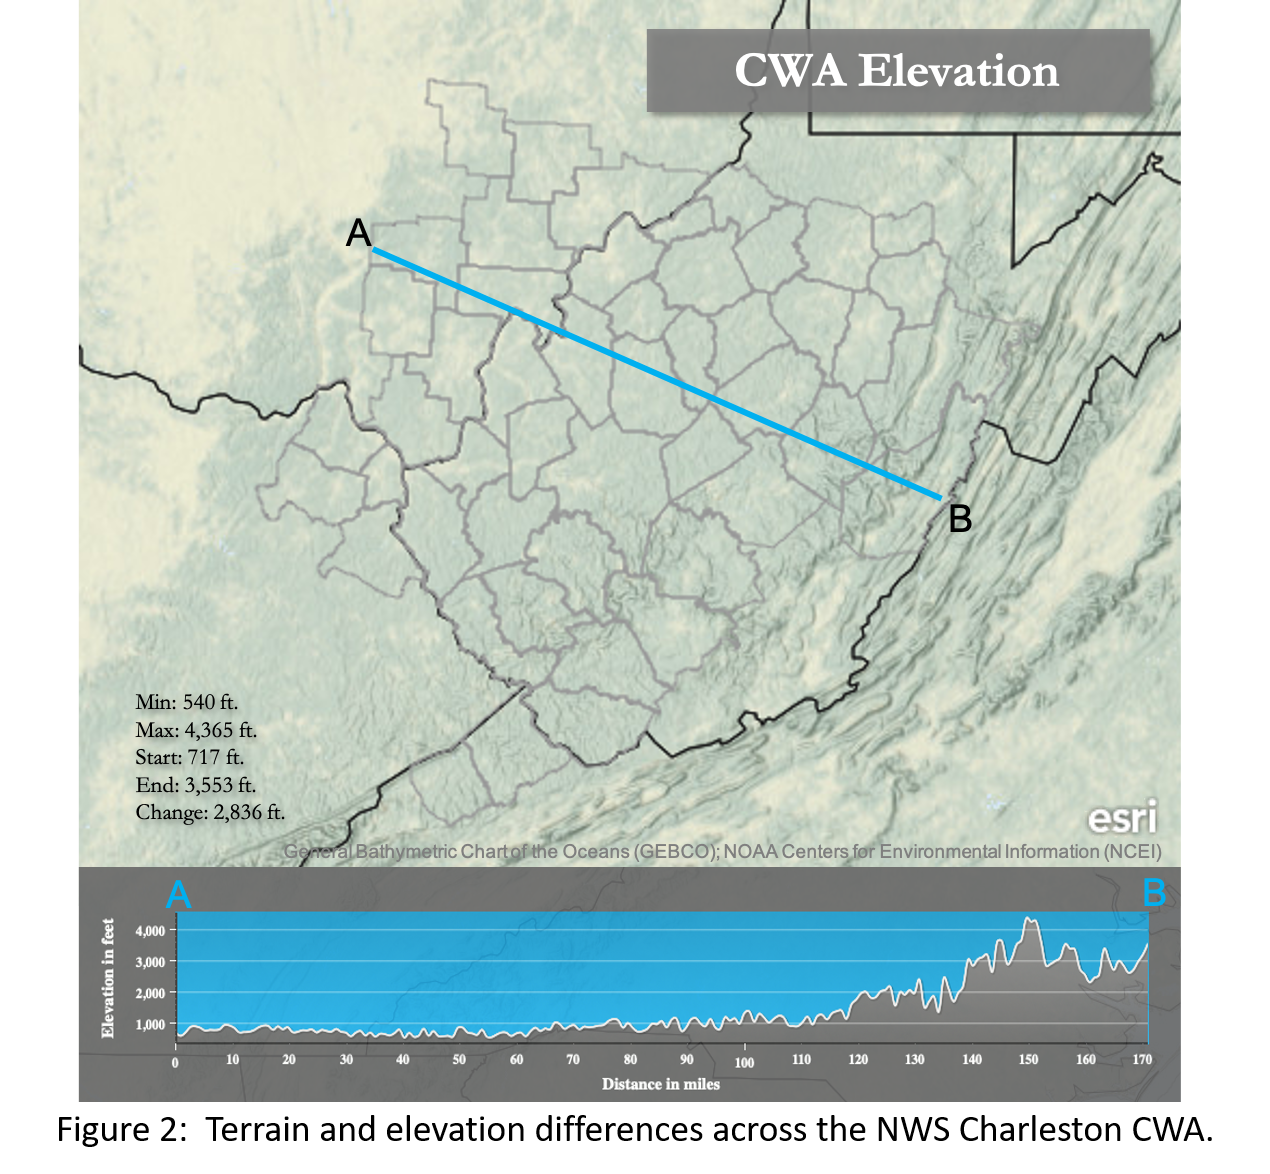
As the graph shows, there is over 2,800 ft. of elevation change as you traverse the area.
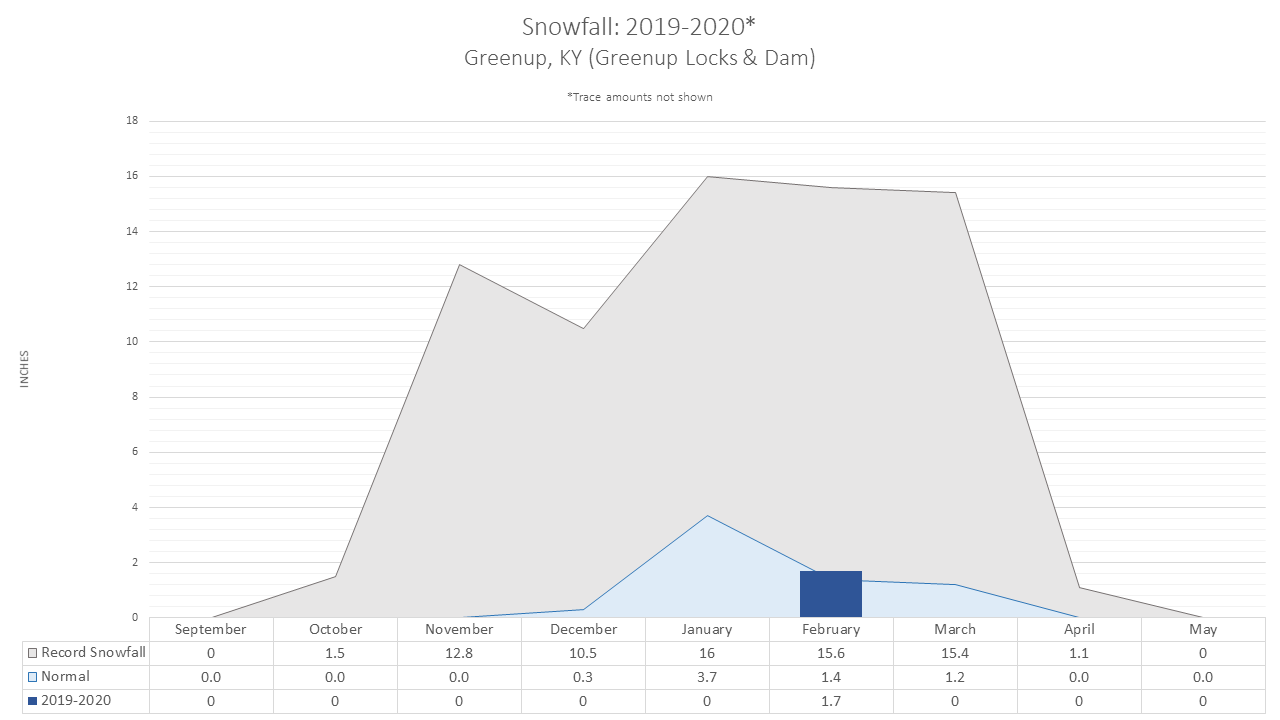
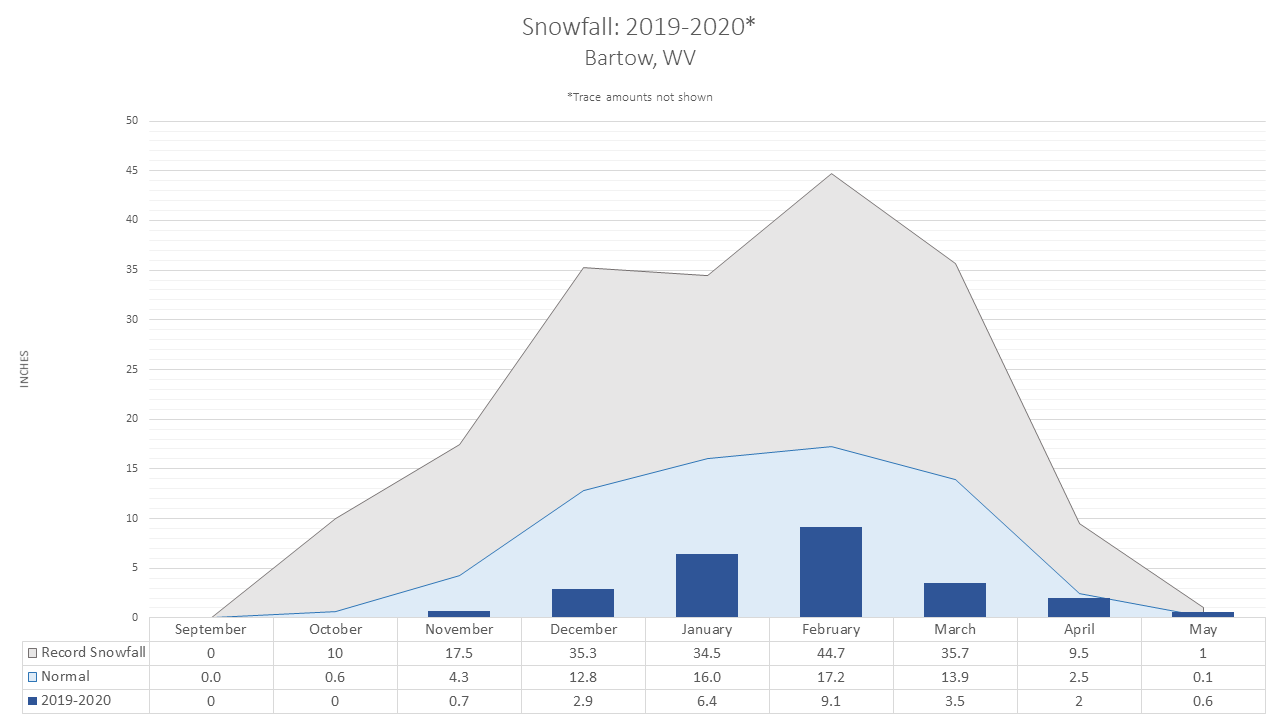
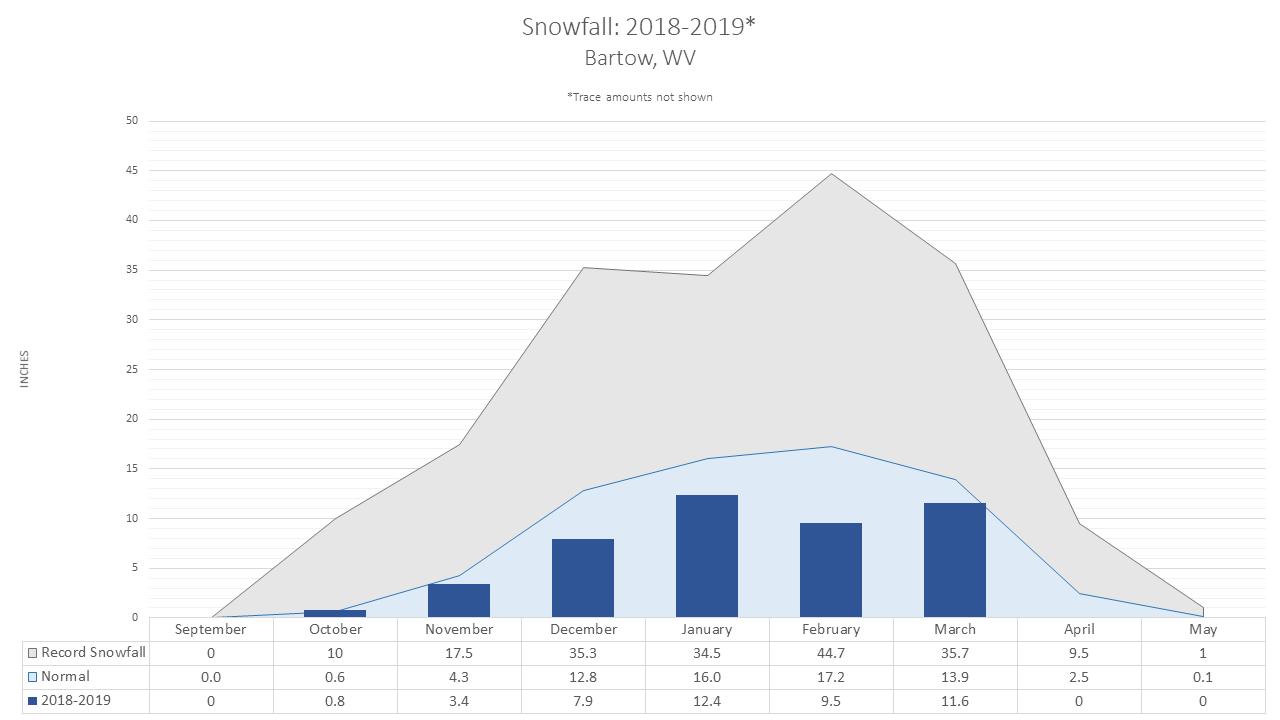
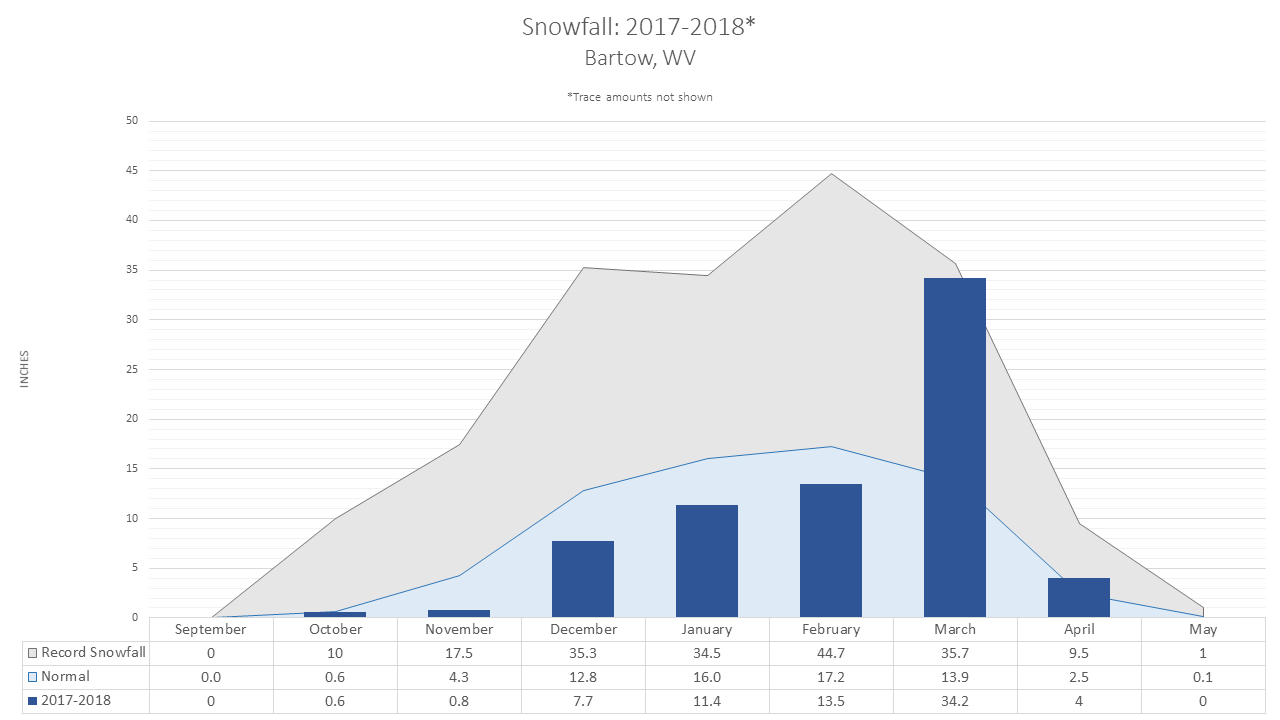
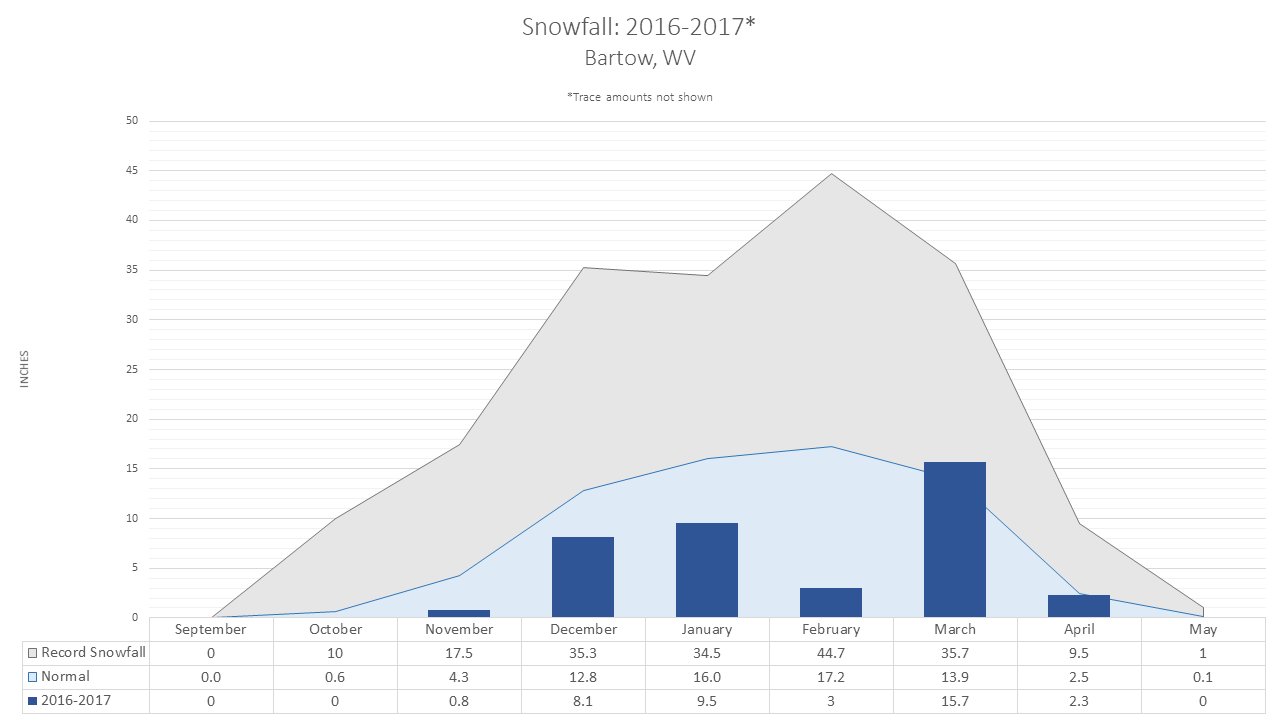
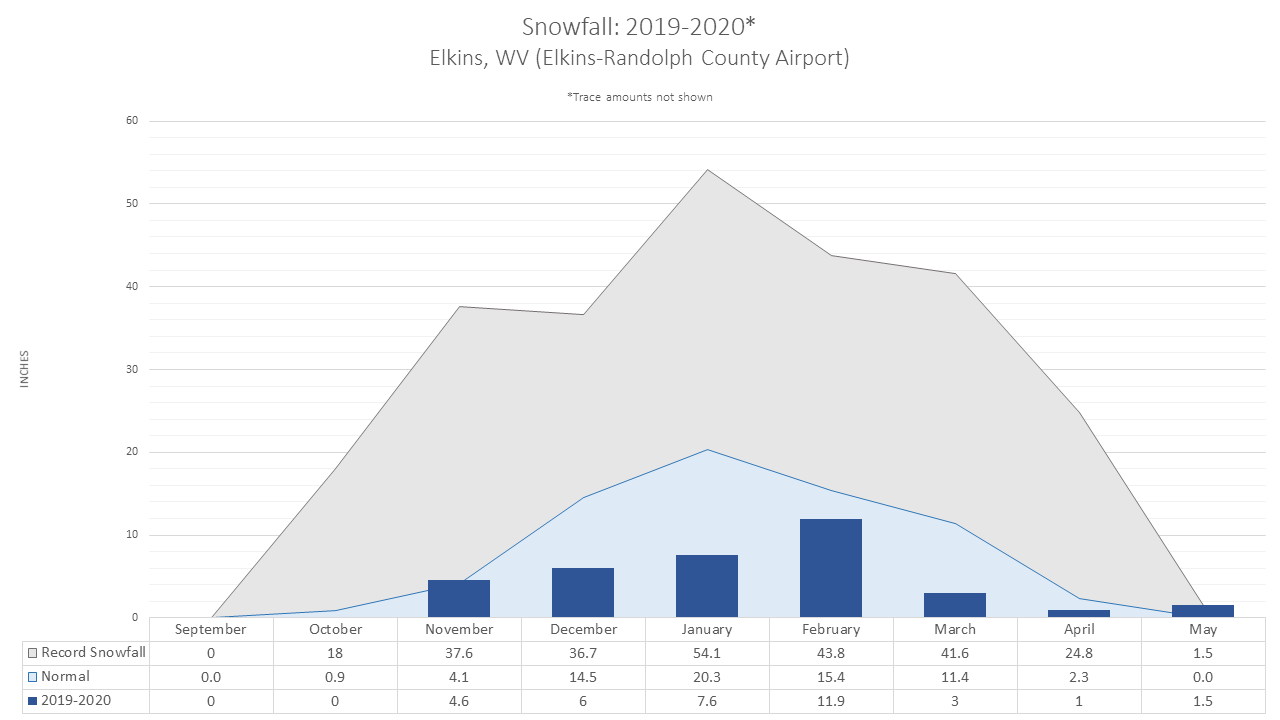
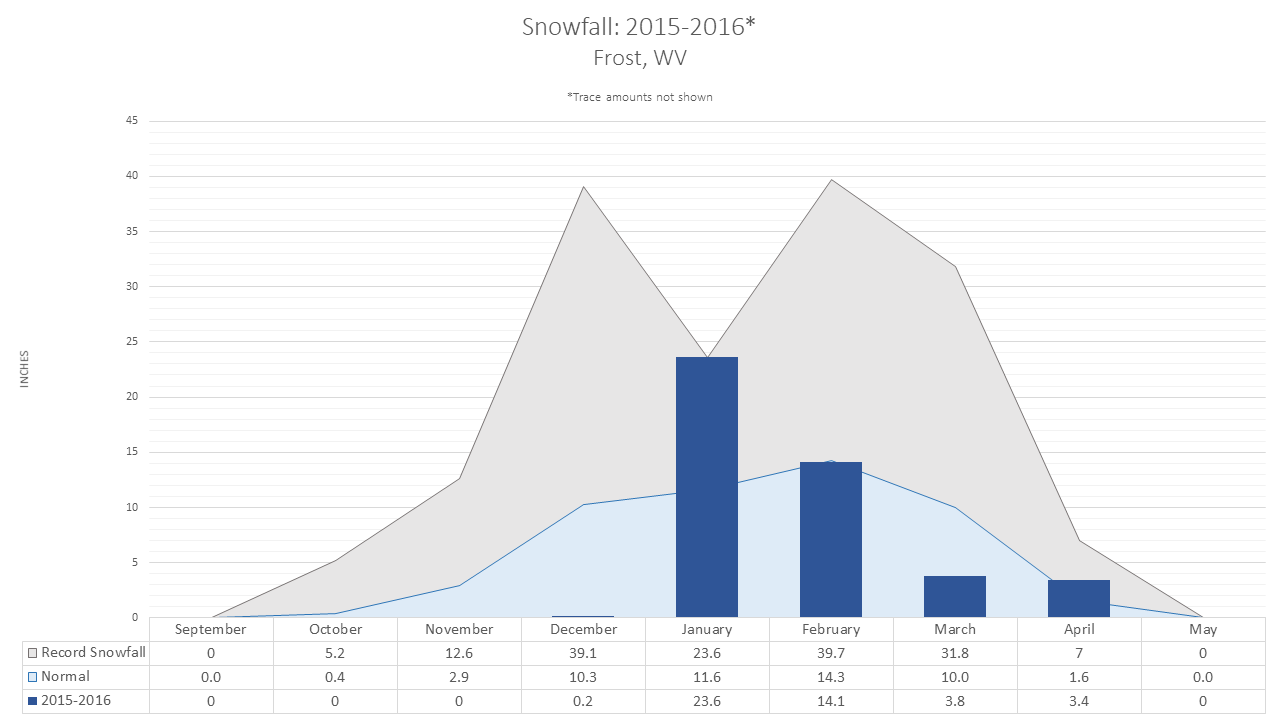
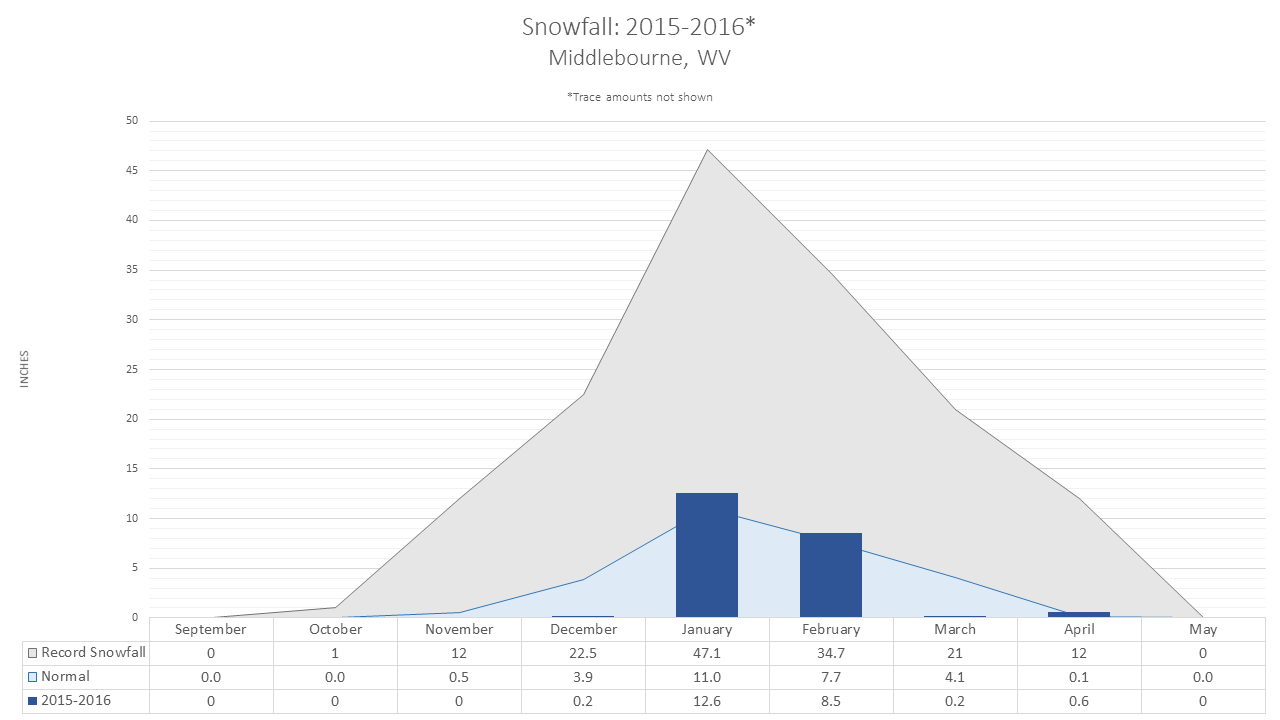
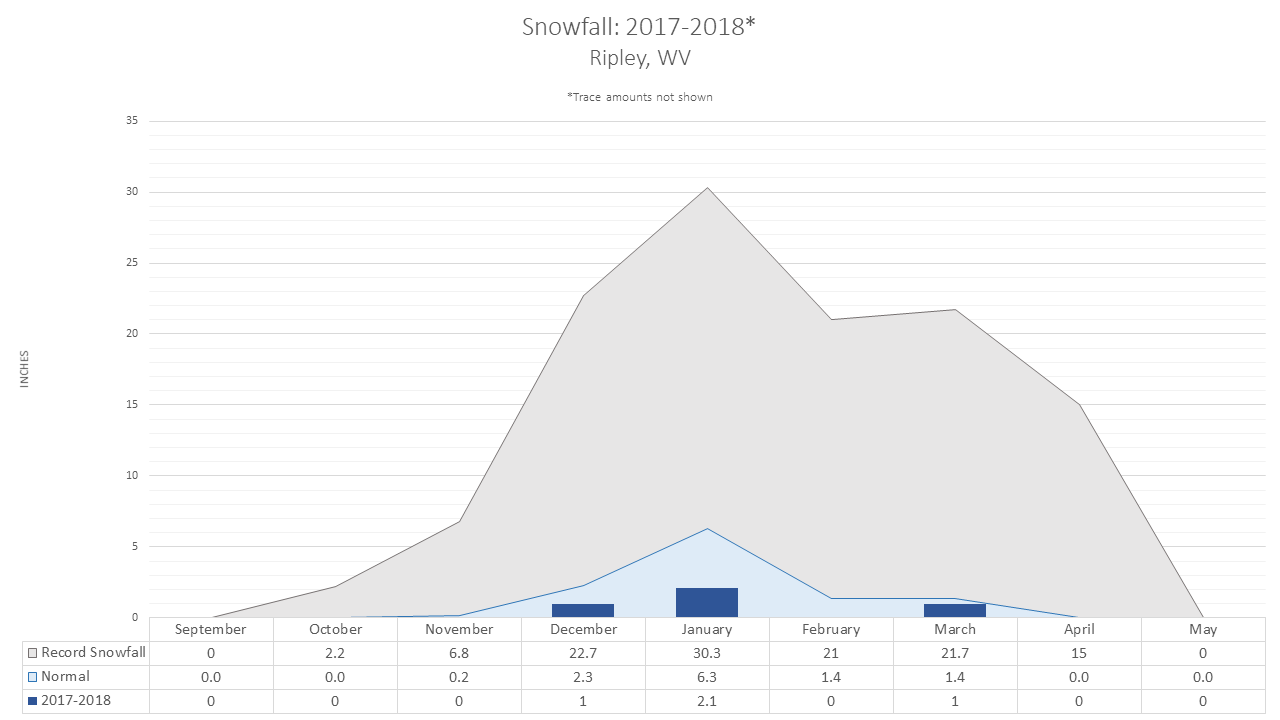
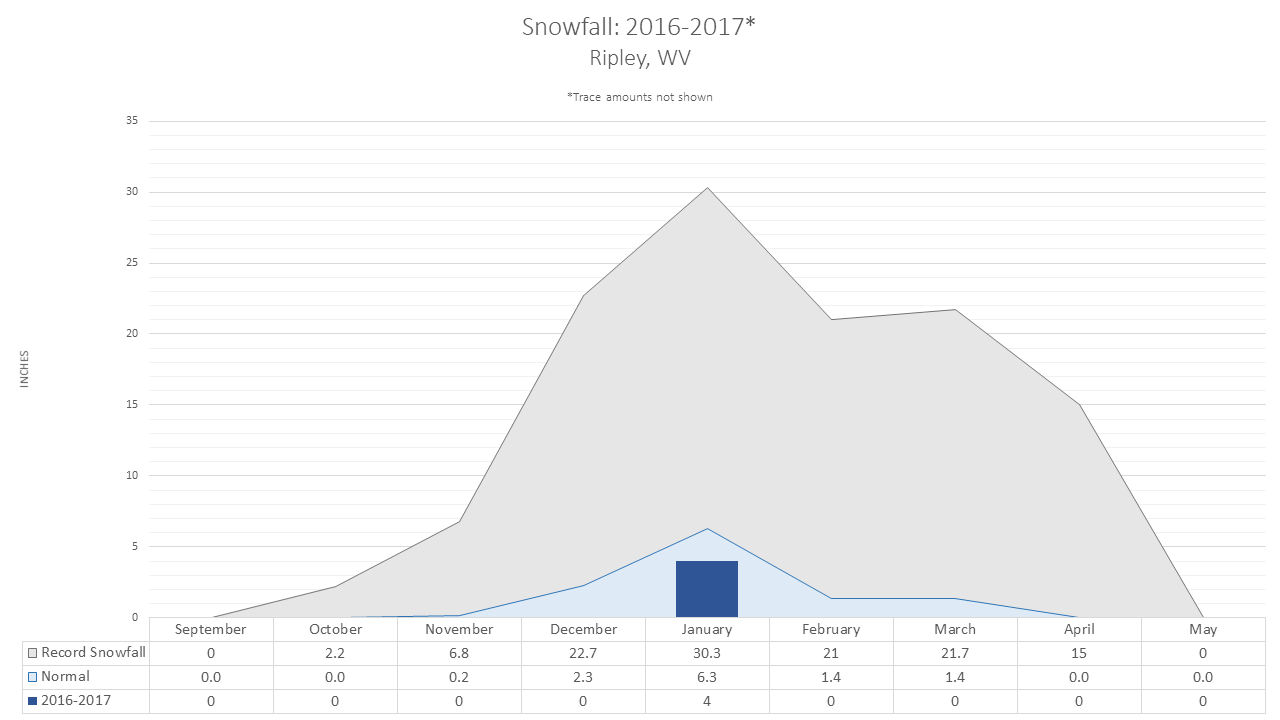
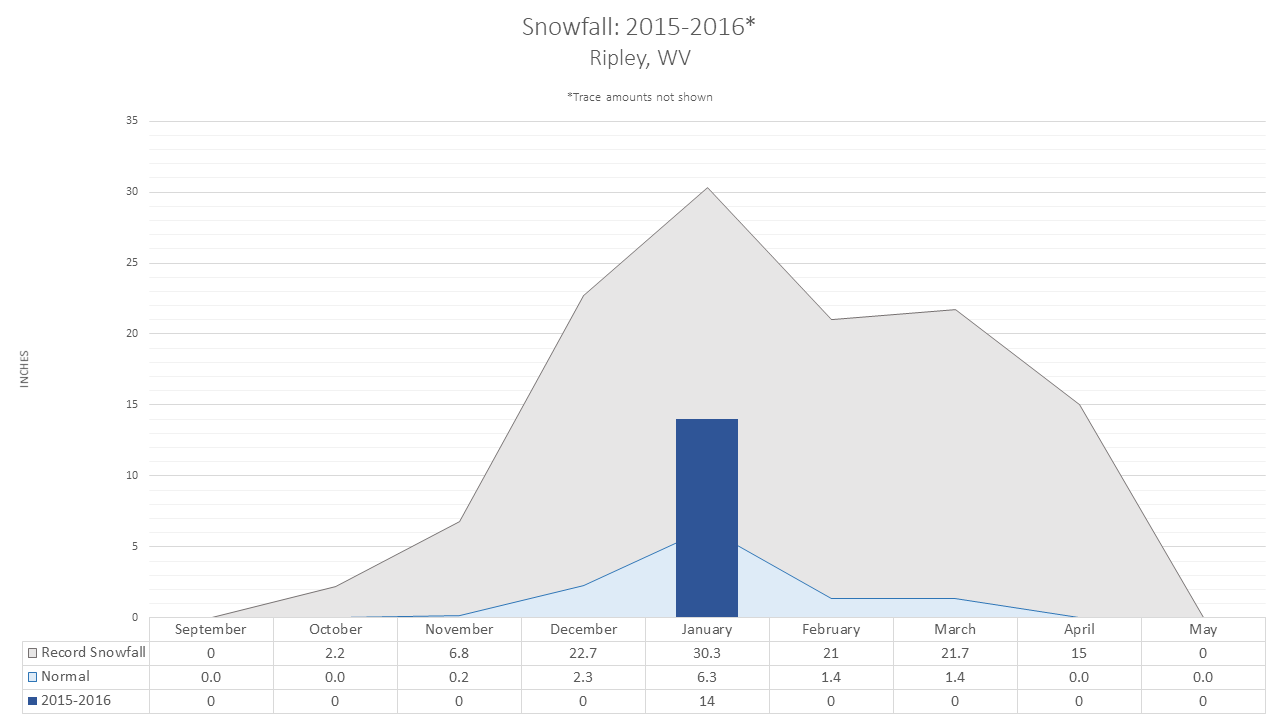
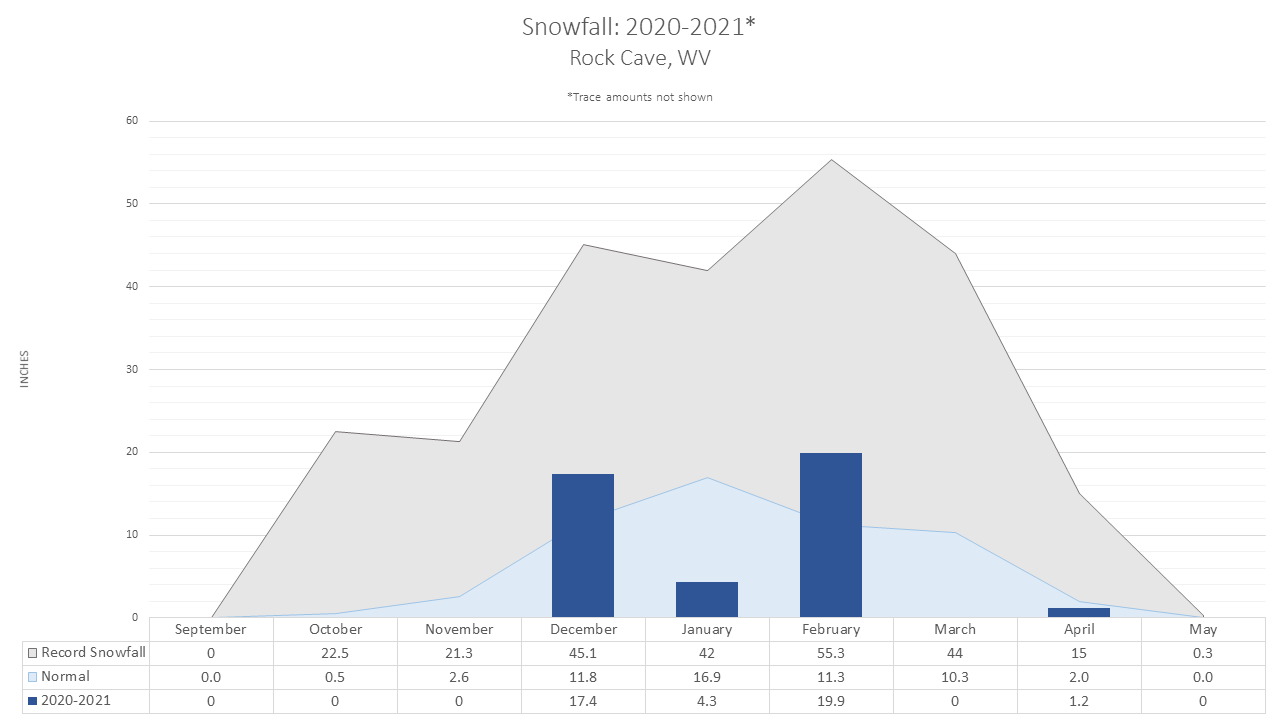
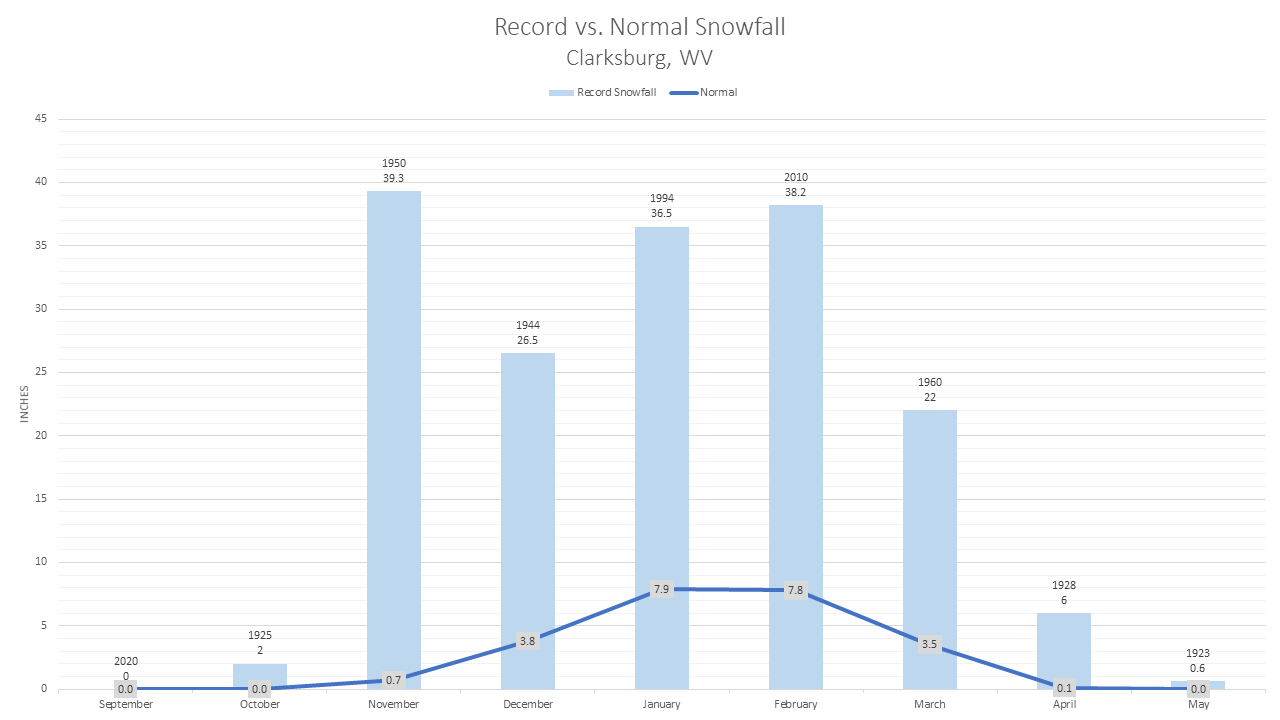
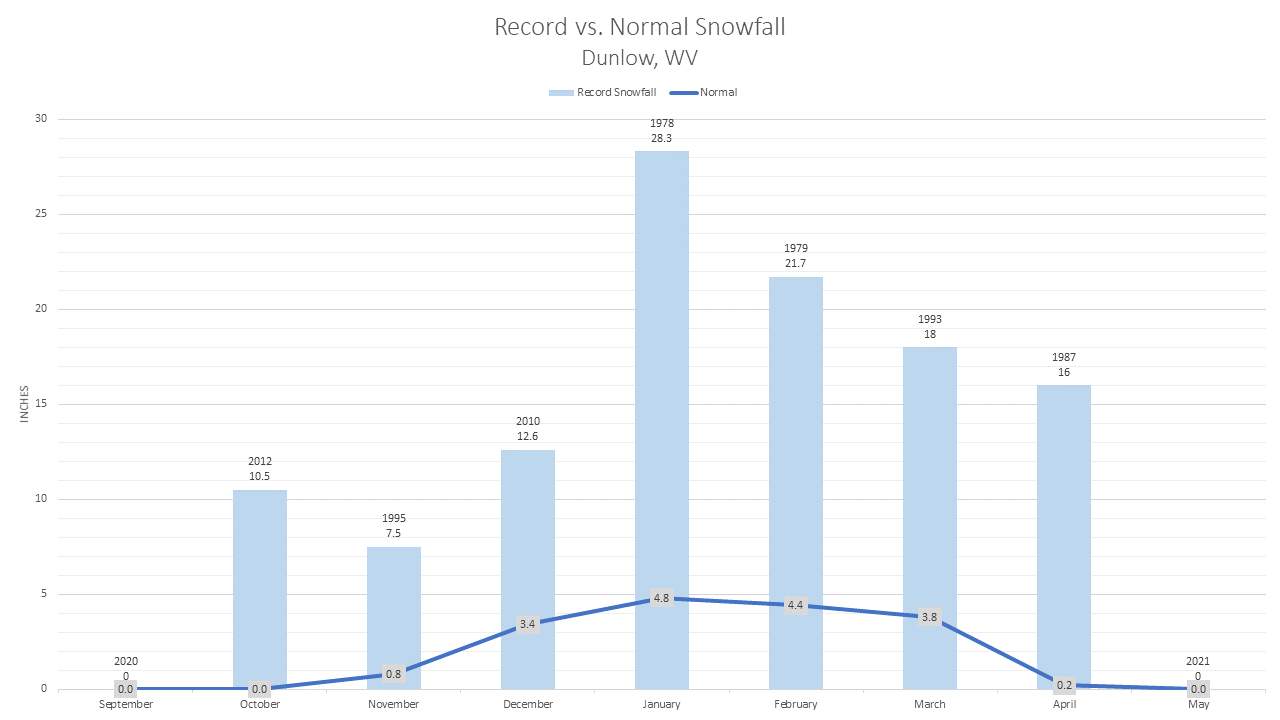
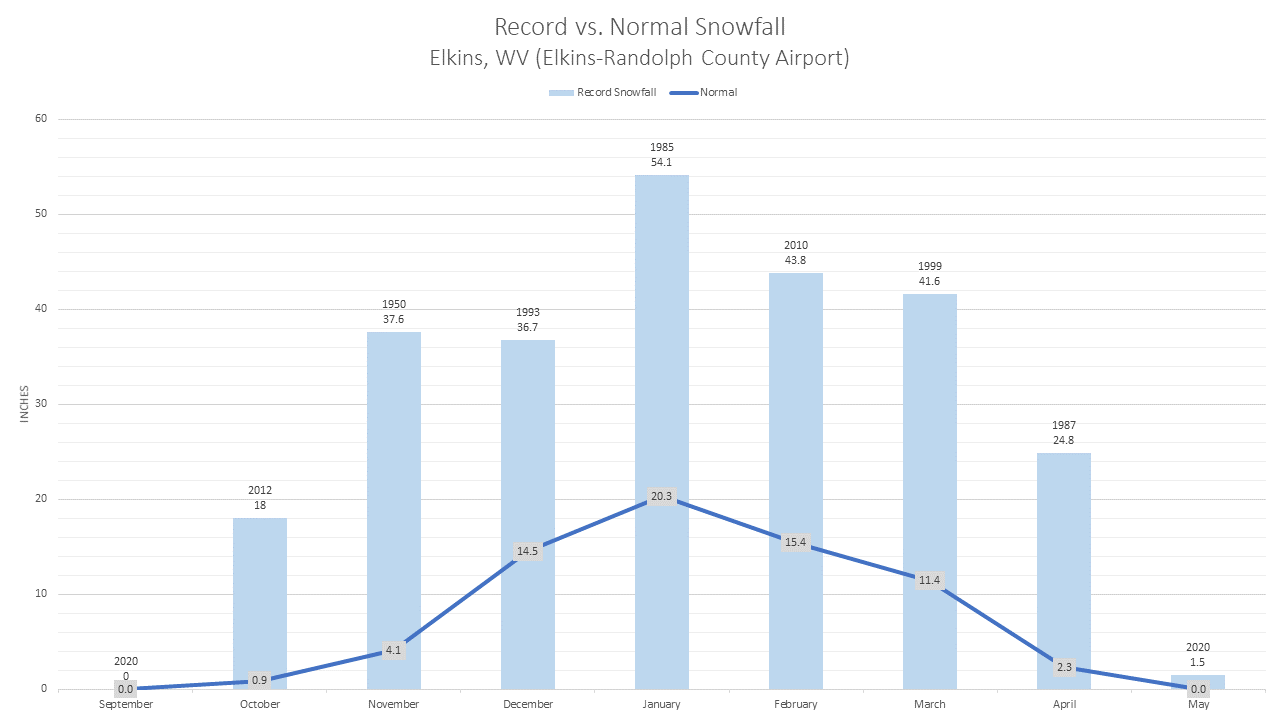
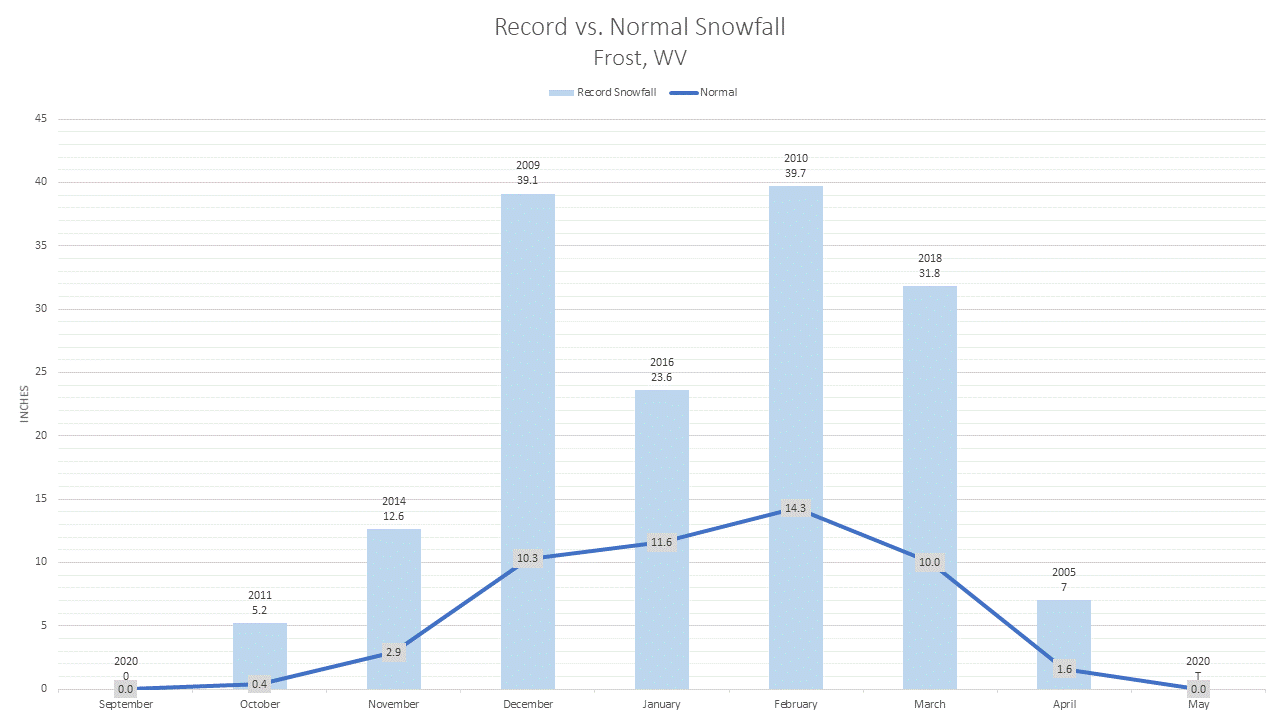
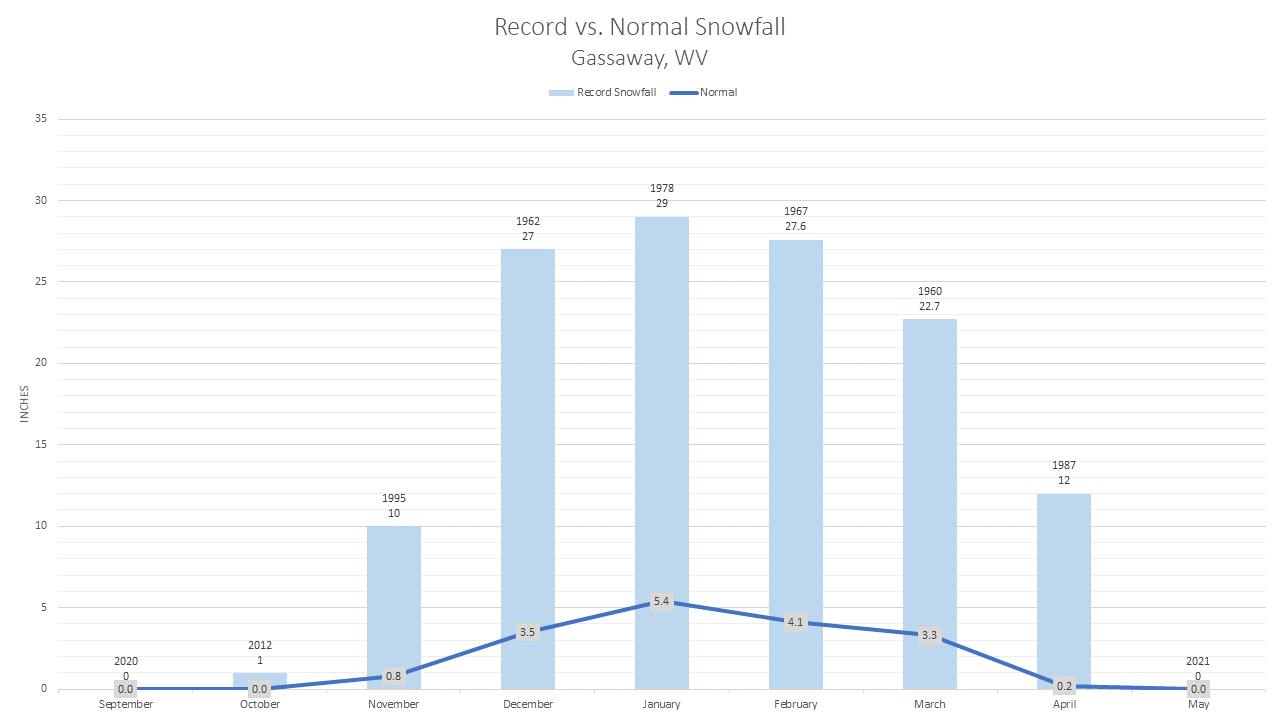
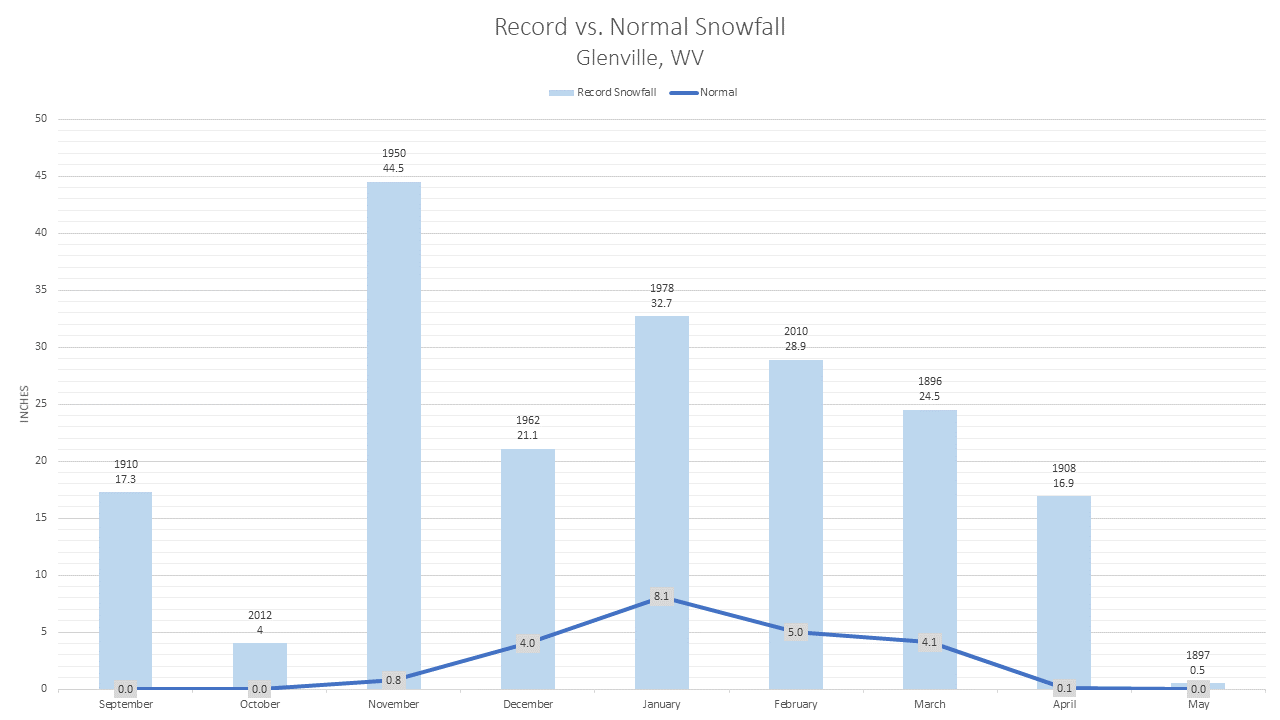
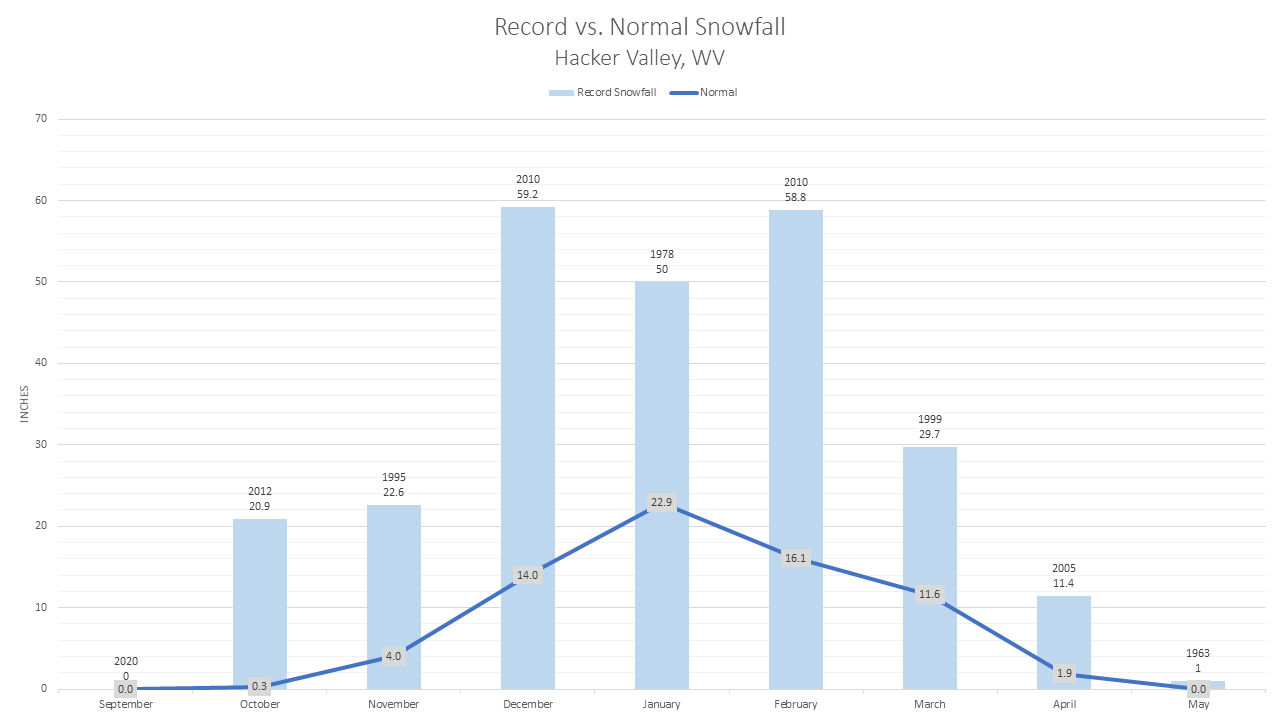
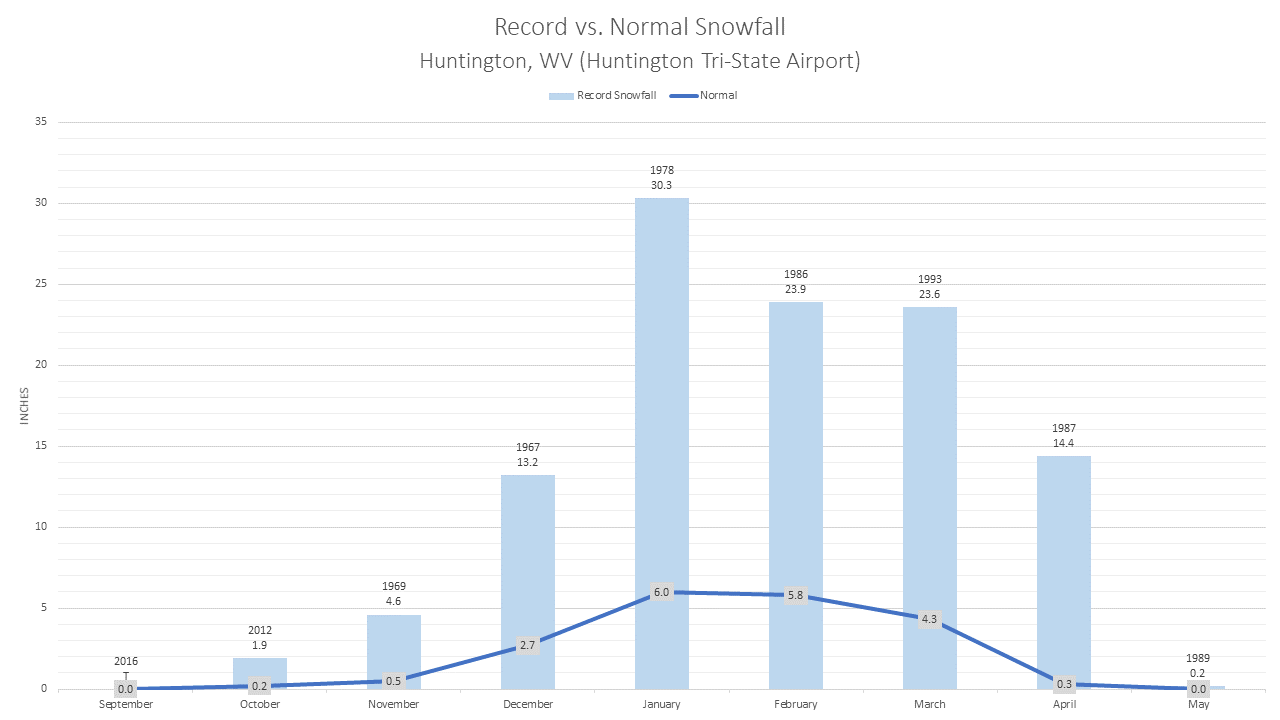
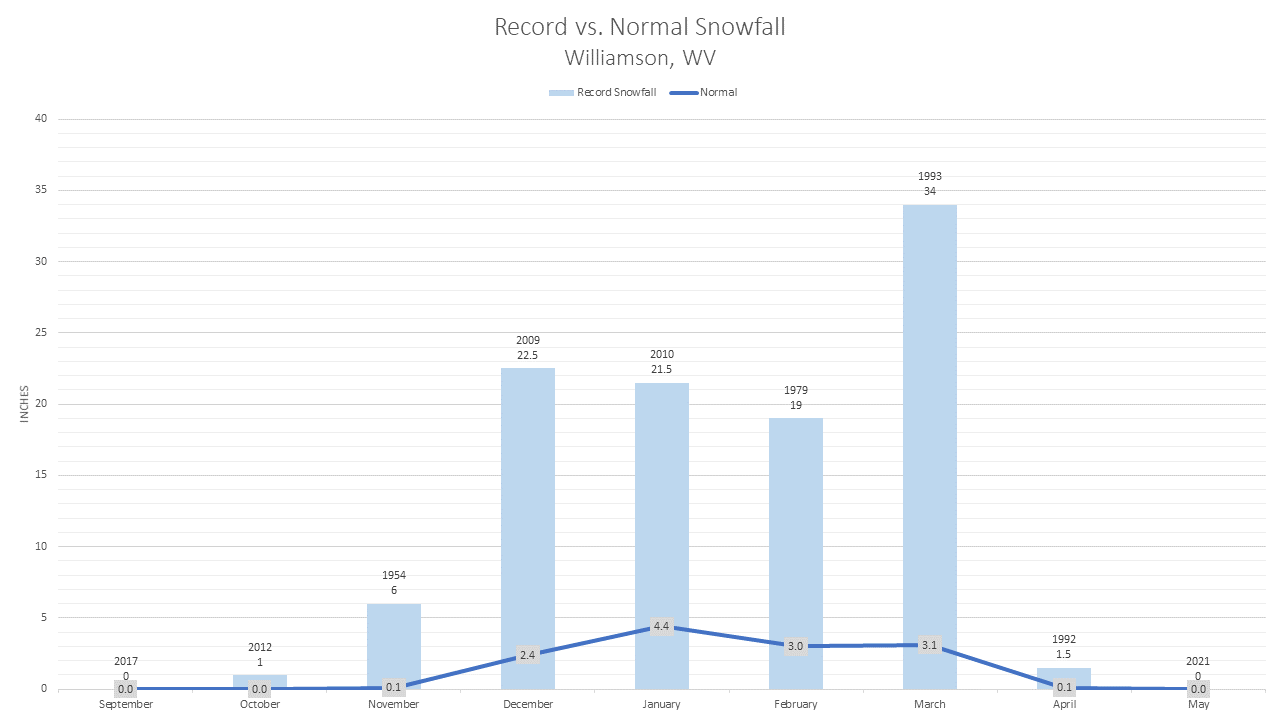
Snow mainly occurs during the winter season (December-February); however, while it may be less common, it is not unusual for snow to occur outside of the winter season beginning as early as October and ending as late as April or May. In very rare events, snow even earlier and/or later than that has been recorded in the past.
Figure 3 (below) depicts the average annual snowfall distribution by county from 1990 to 2019 (though localized amounts may be greater or less than the amounts shown in the figure). Yearly average snow amounts across the CWA can span anywhere from less than an inch to over a hundred inches per year.

As expected, the mountains and high elevations typically received the greatest snow amounts each year – generally accumulating anywhere between thirty and a hundred and fifty inches. Pocahontas and Randolph counties reach the high end of the spectrum, while the other mountain counties fall in just below them.
A transition into the lower end of the spectrum occurs as you progress westward and/or southward across the CWA. Here, yearly snow amounts into the zero to thirty-inch range are common.
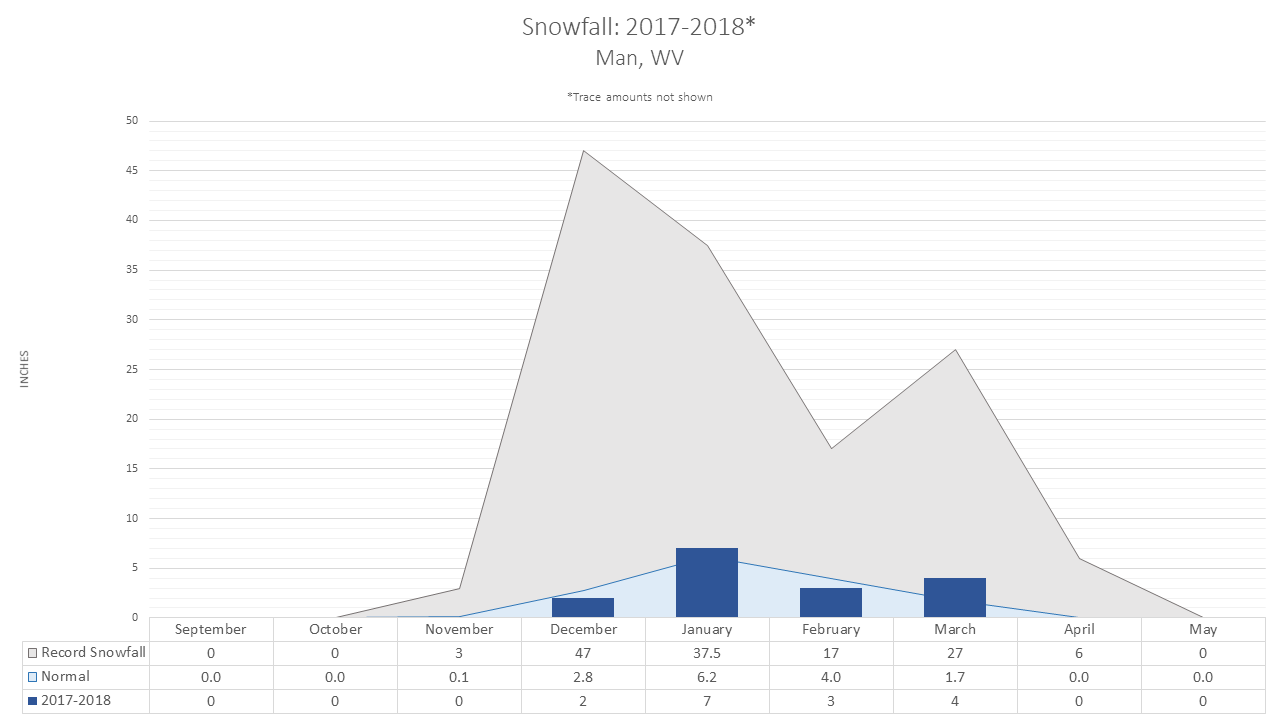
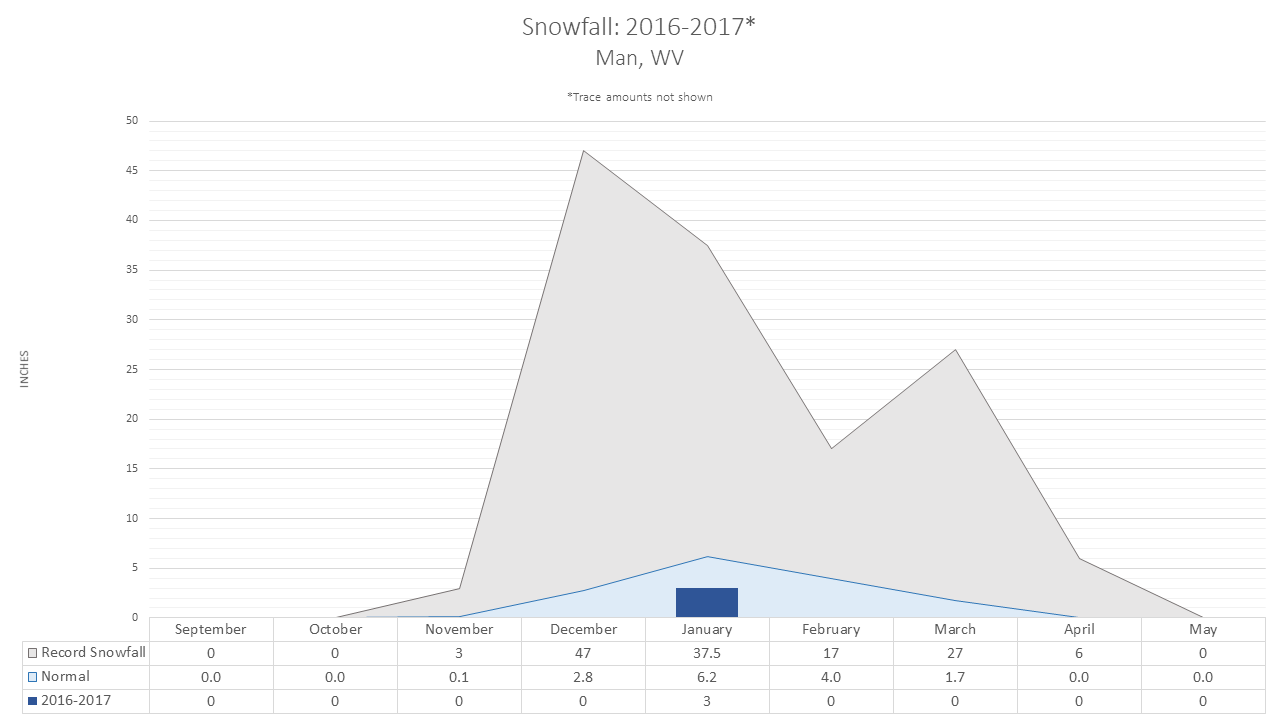
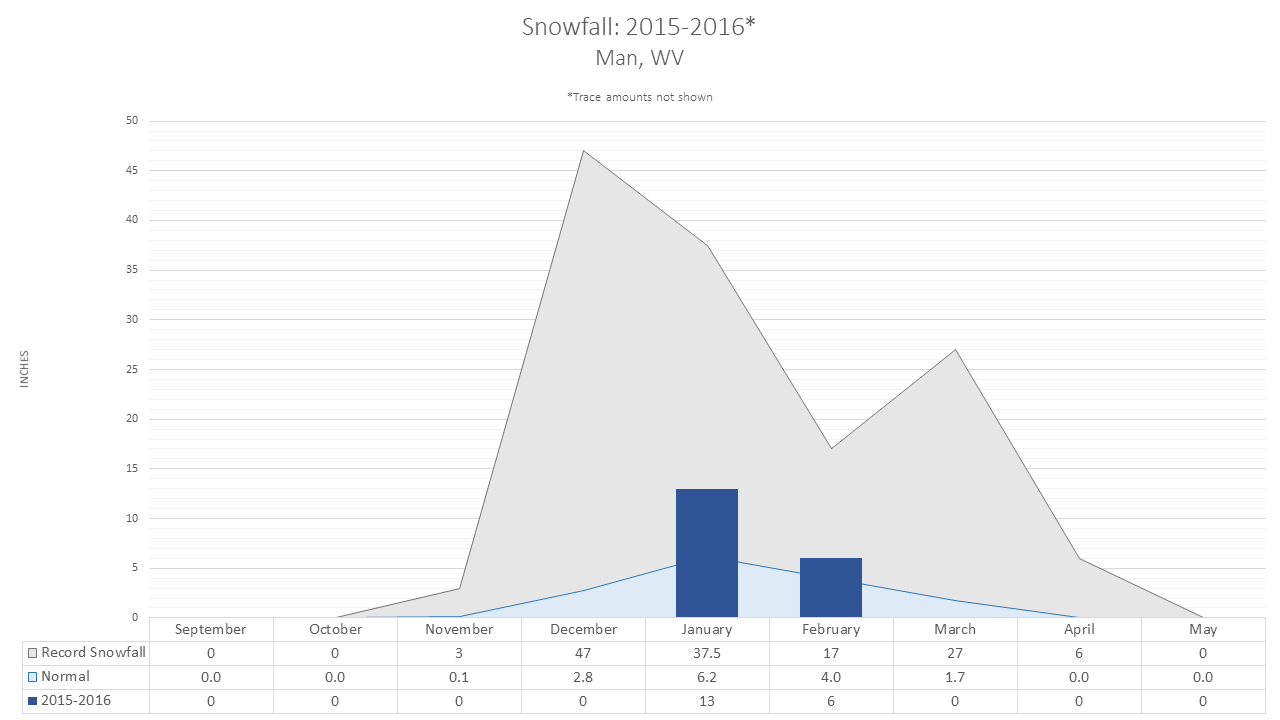
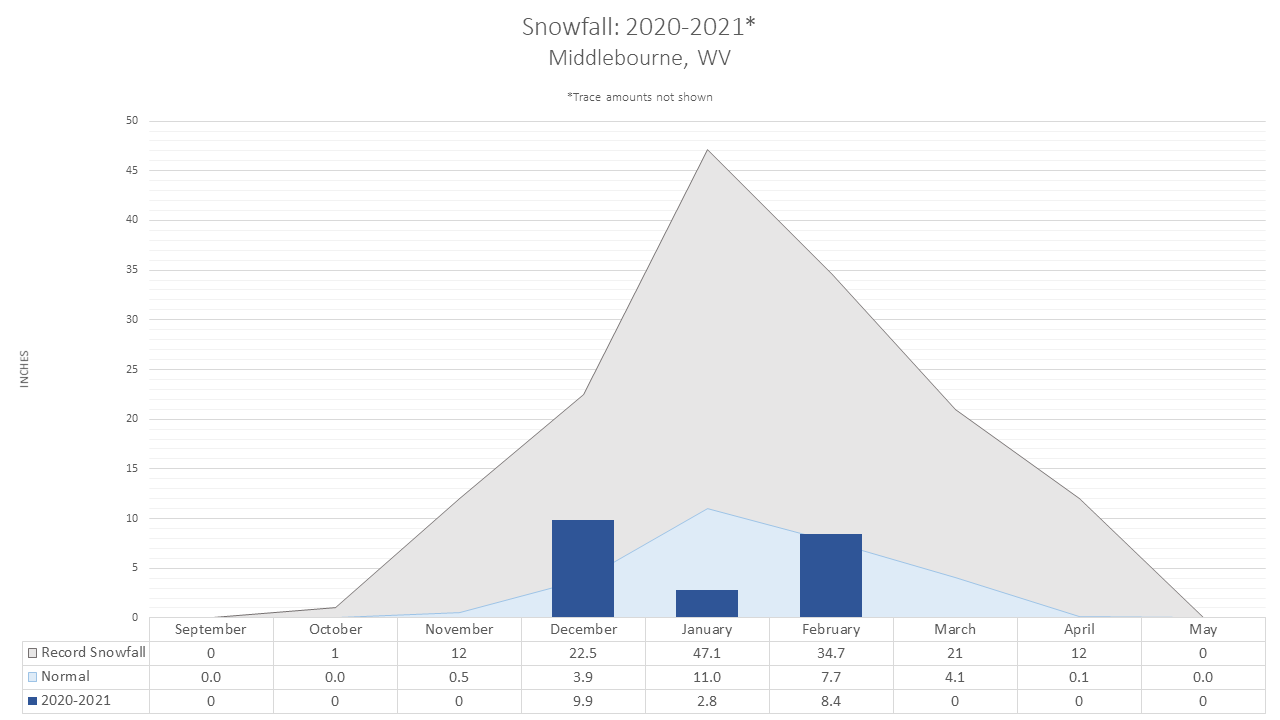
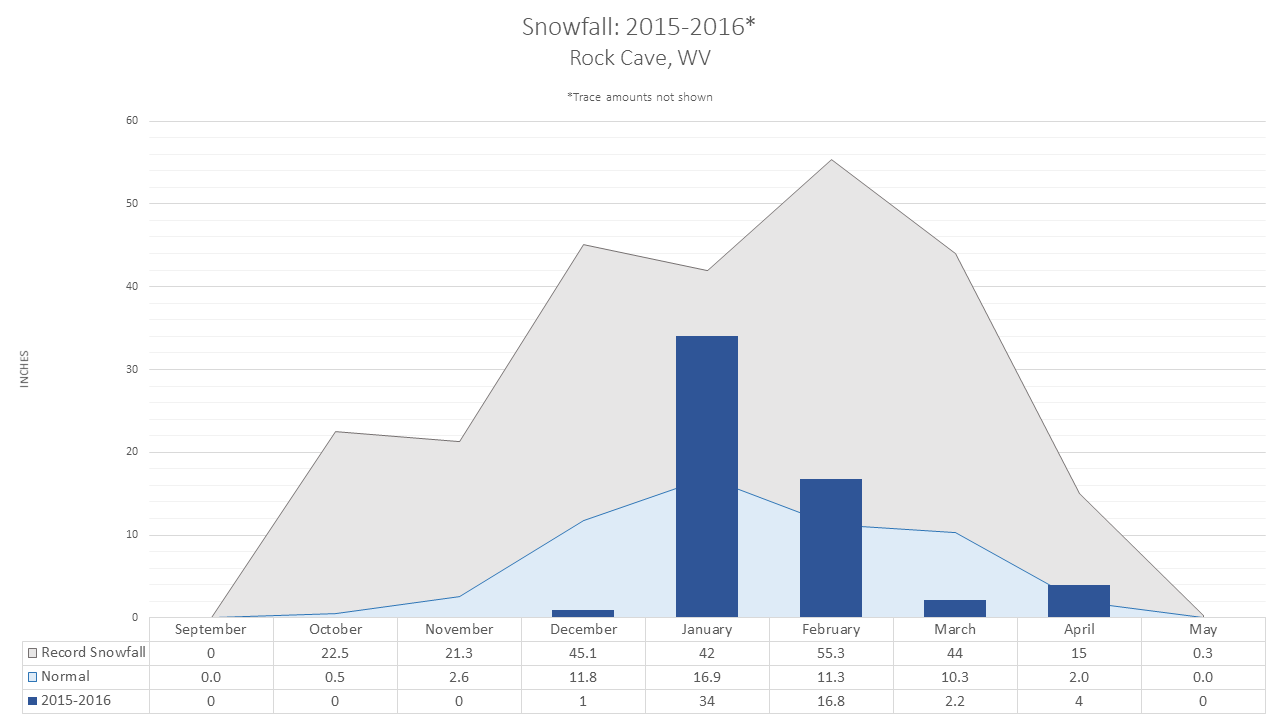
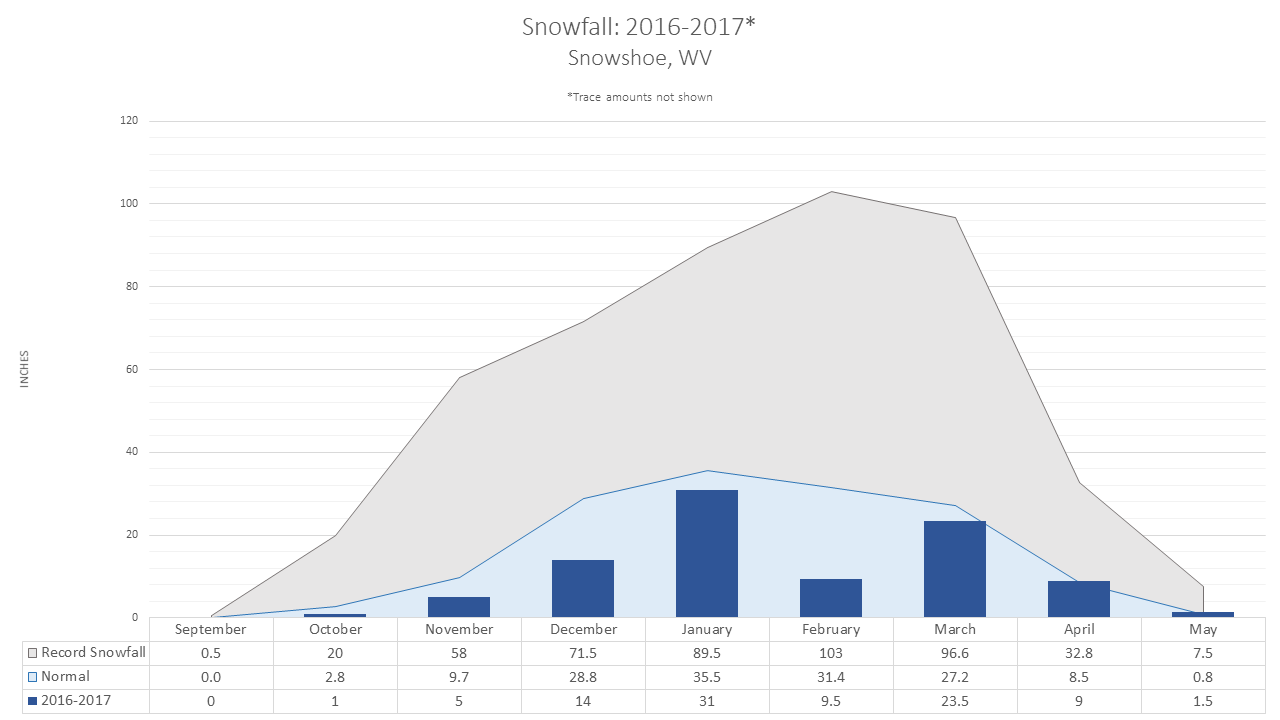
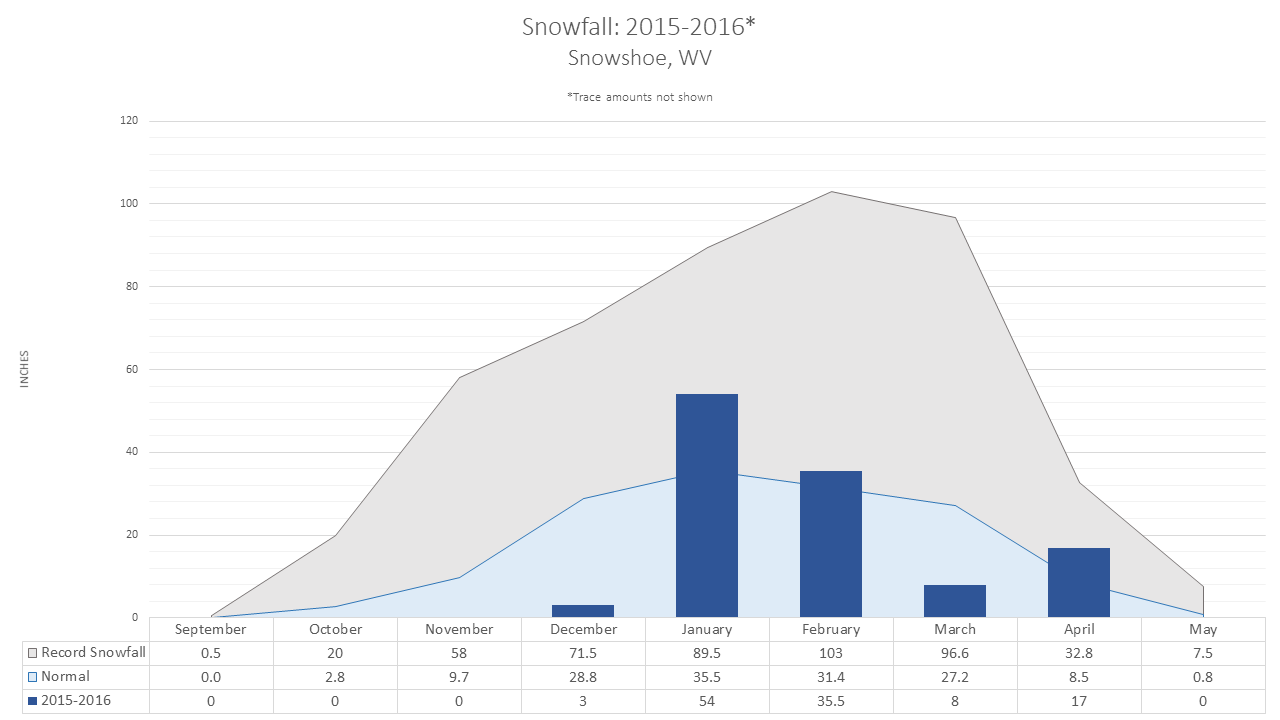
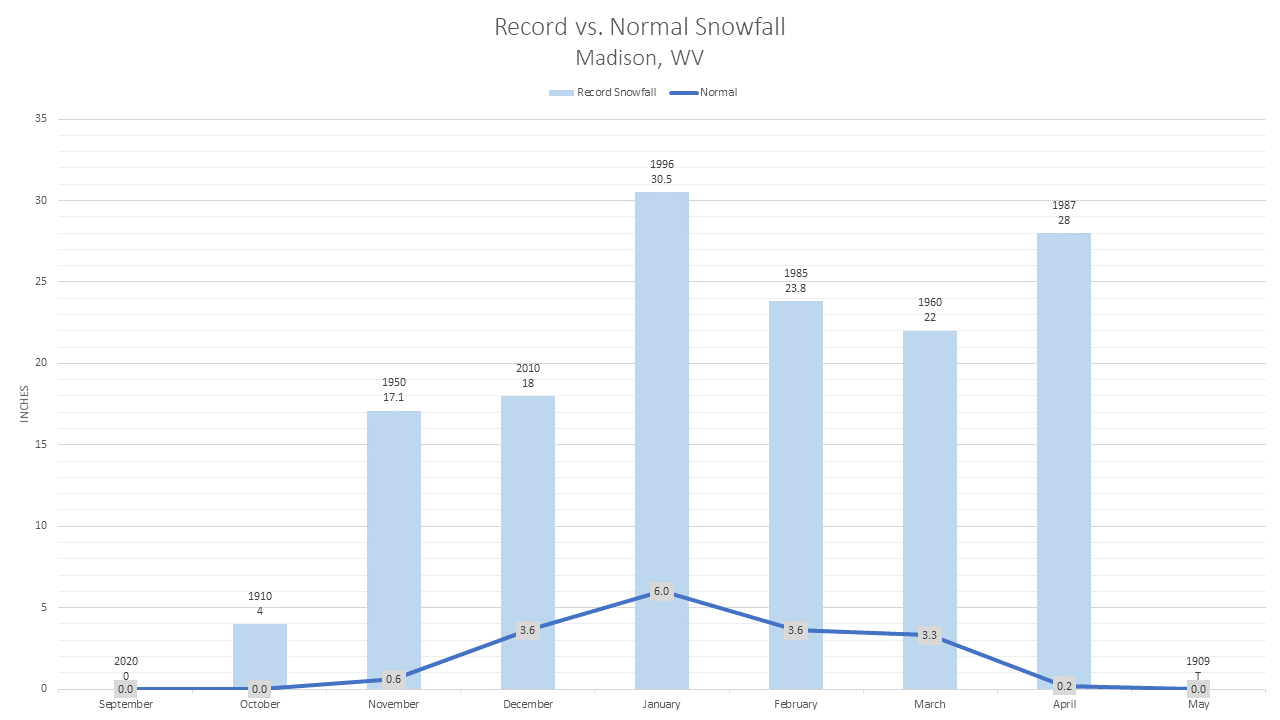
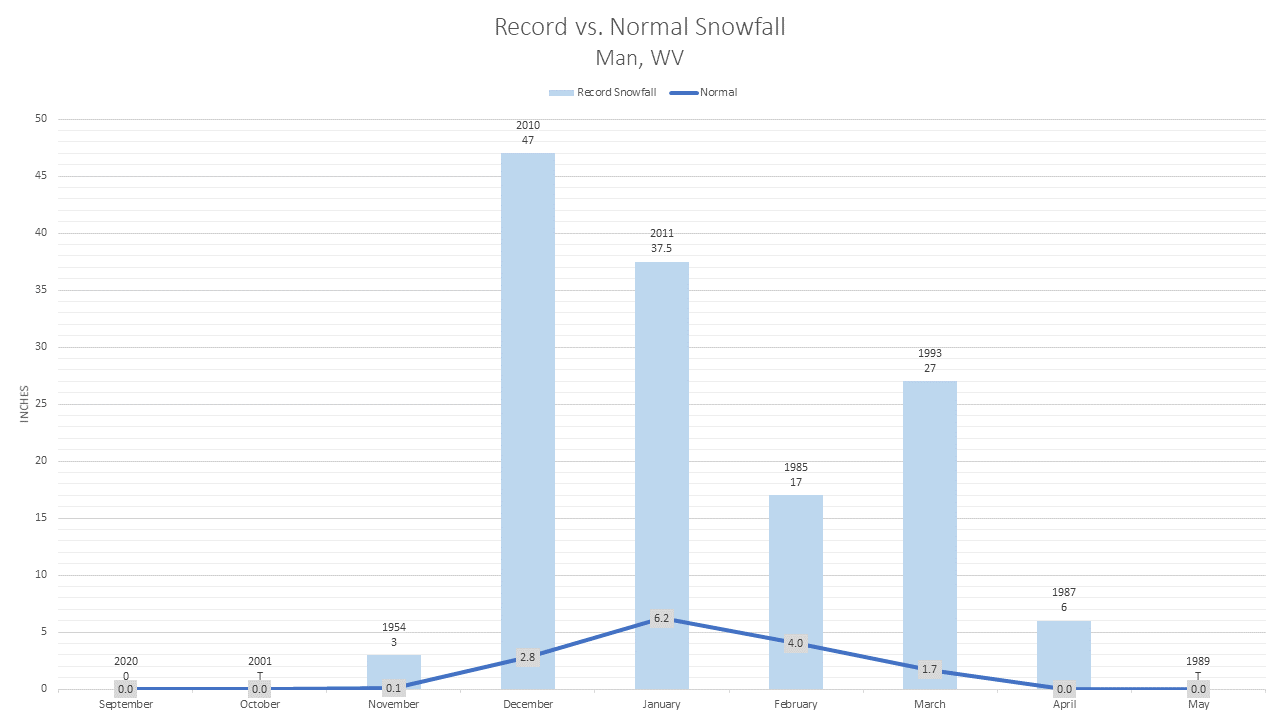
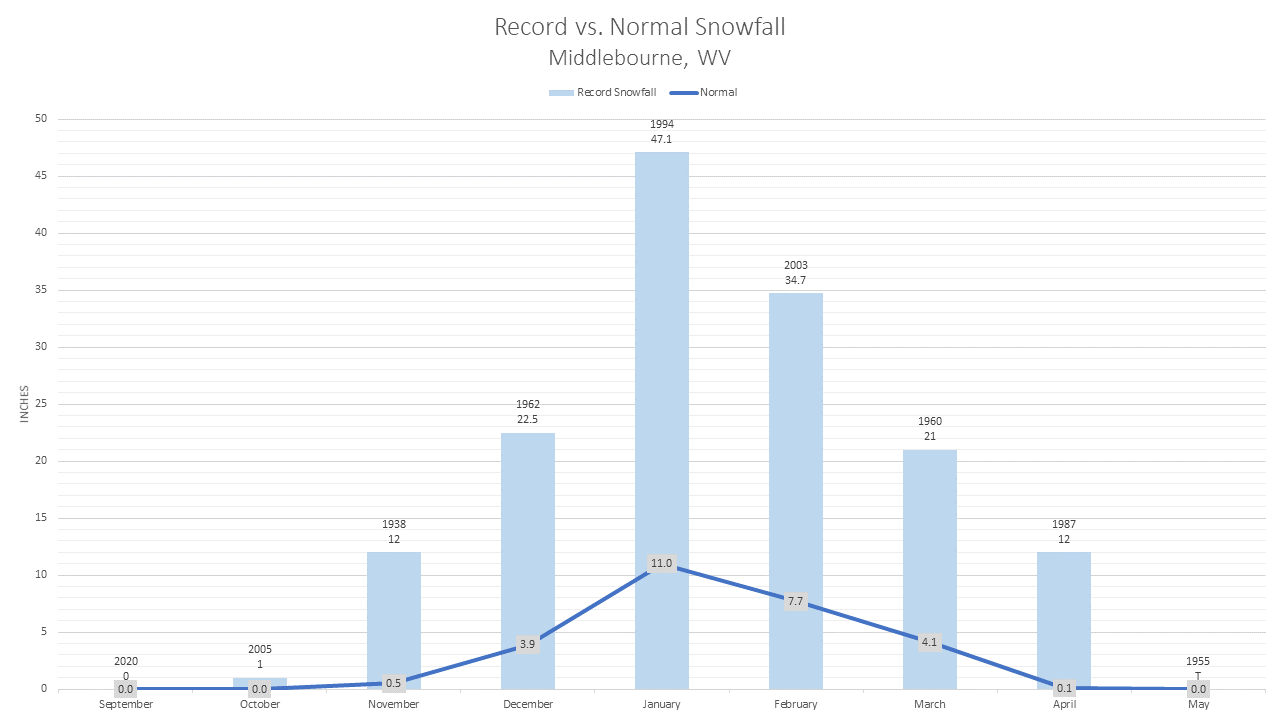
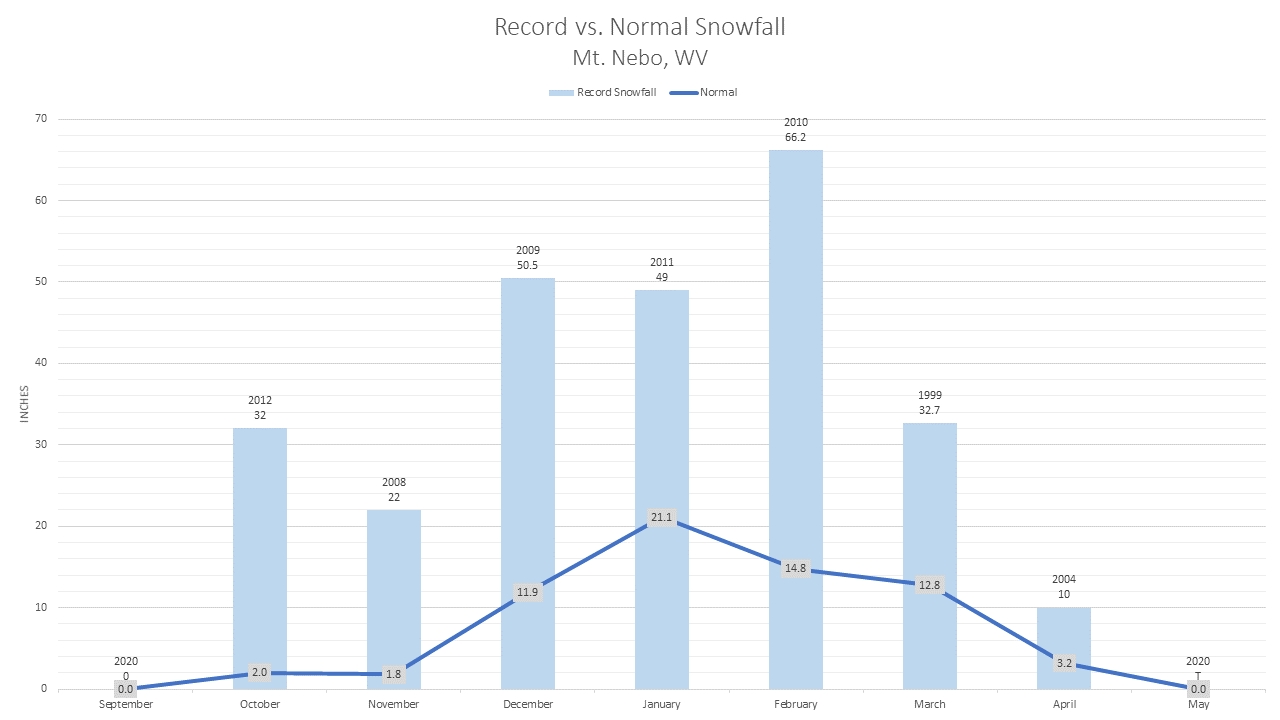
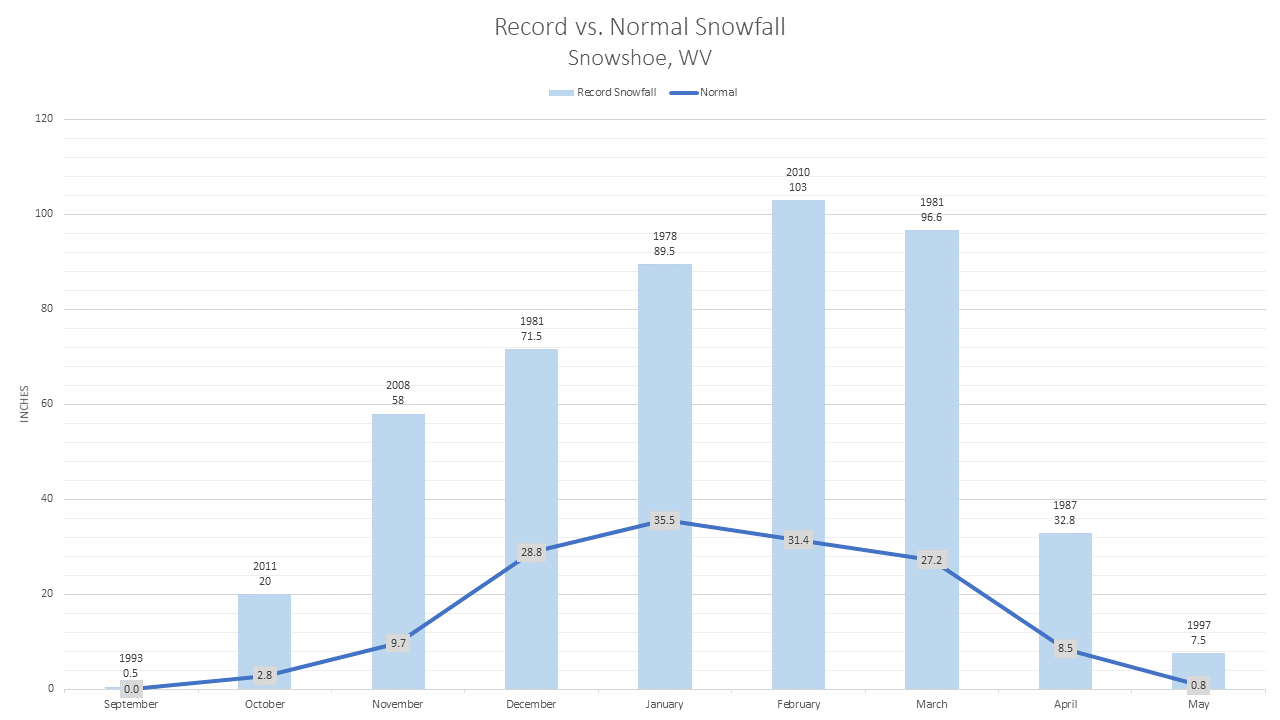
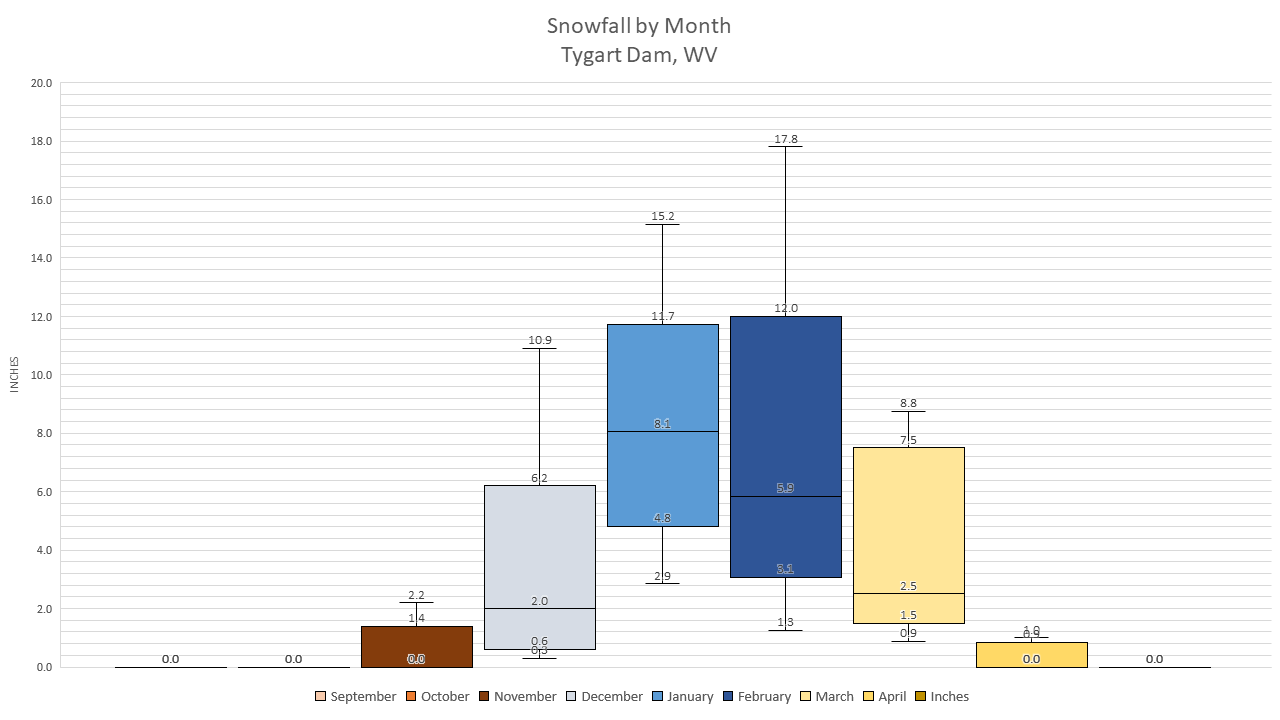
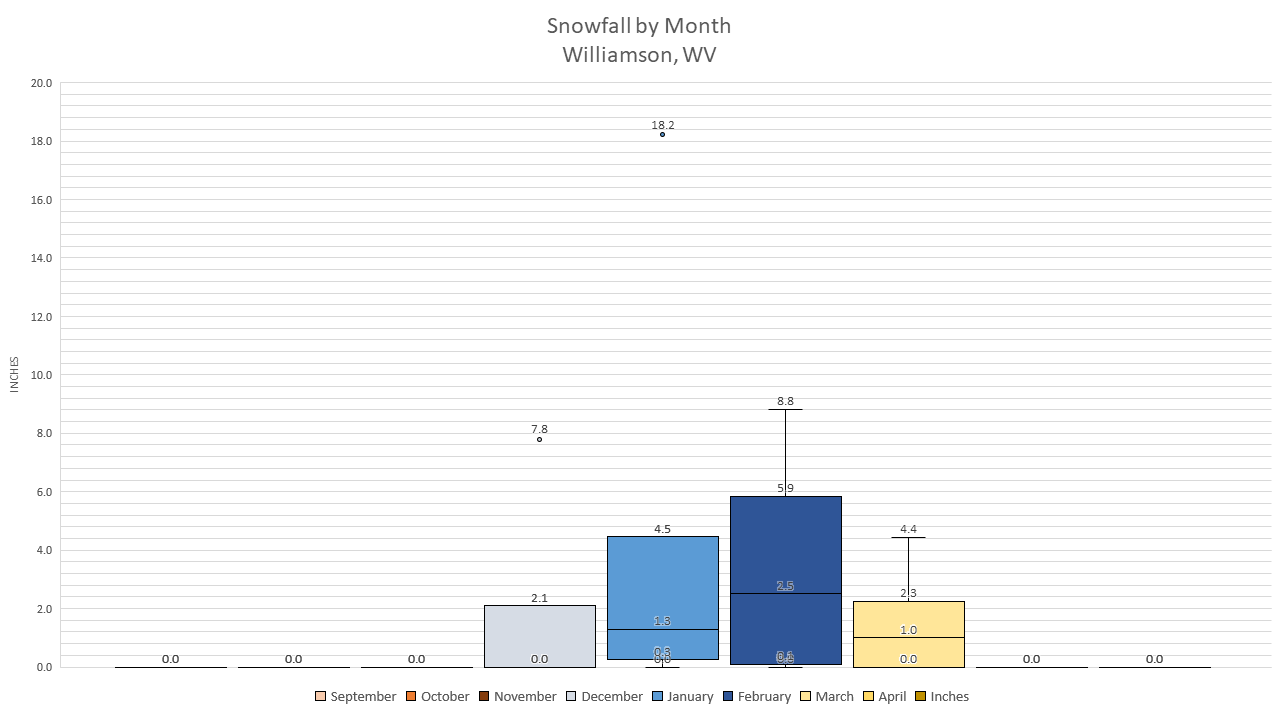
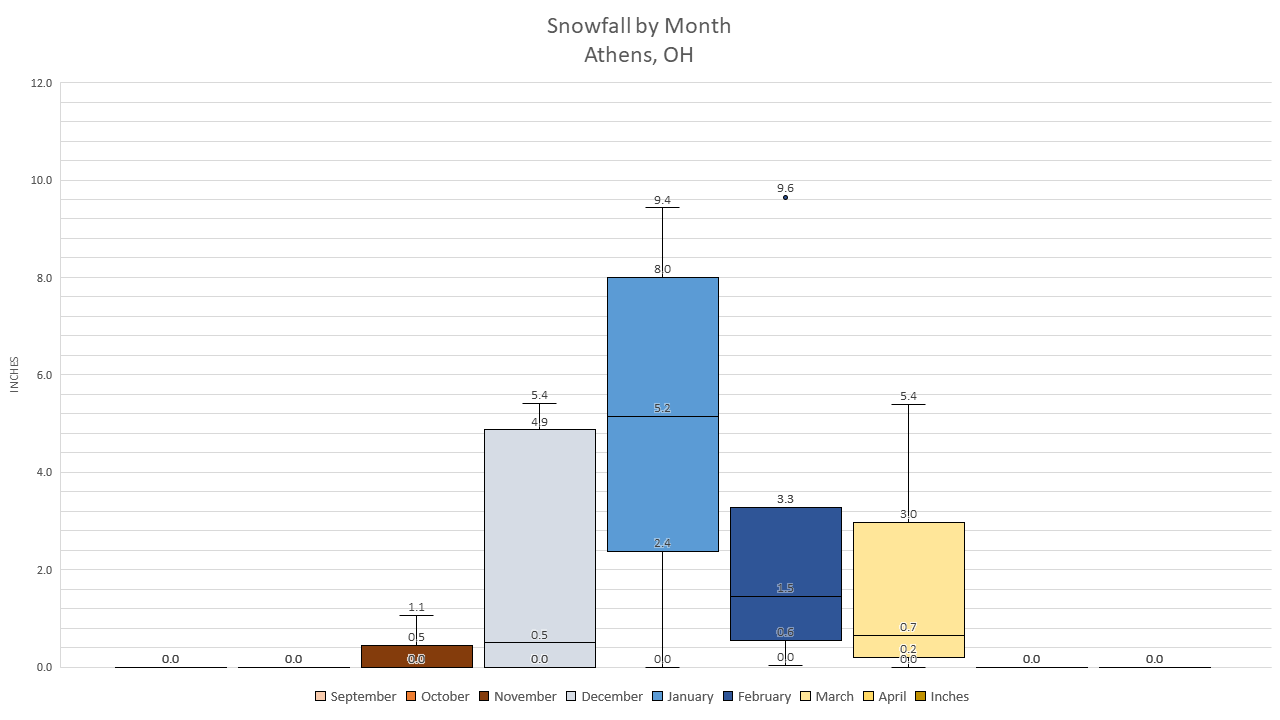
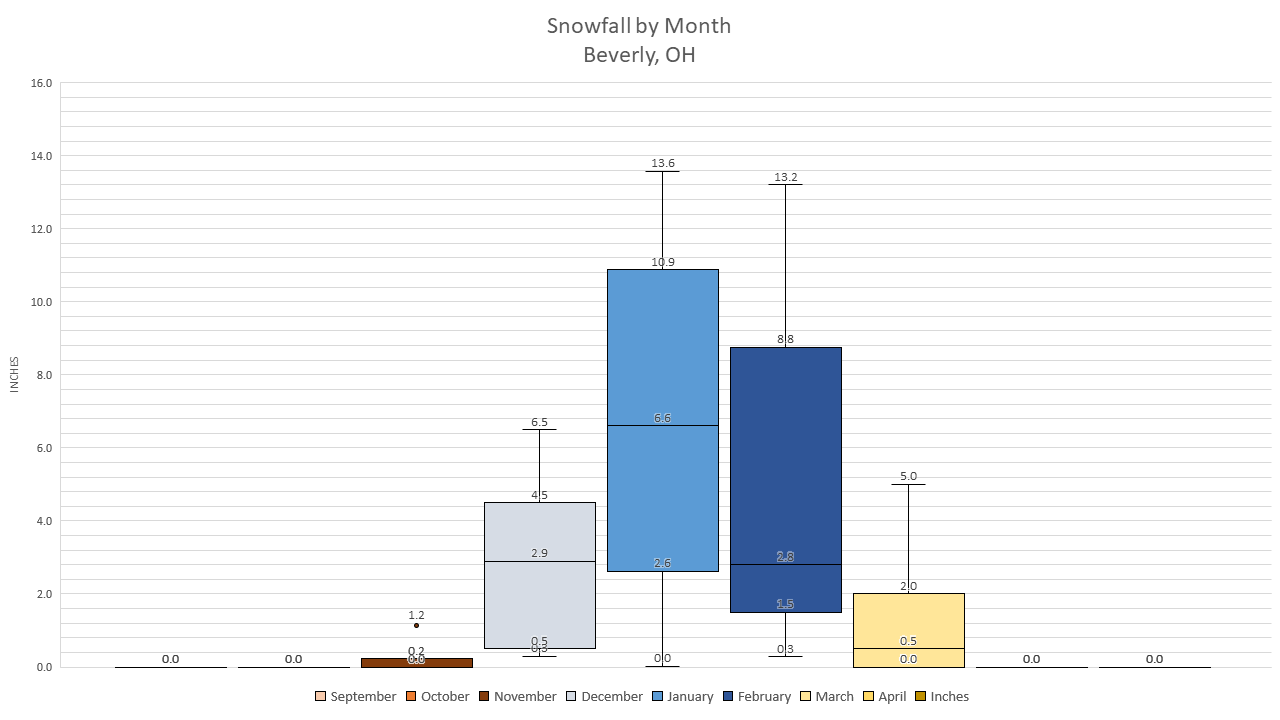
Of all the months, January receives the most snowfall as well as the most snow days.
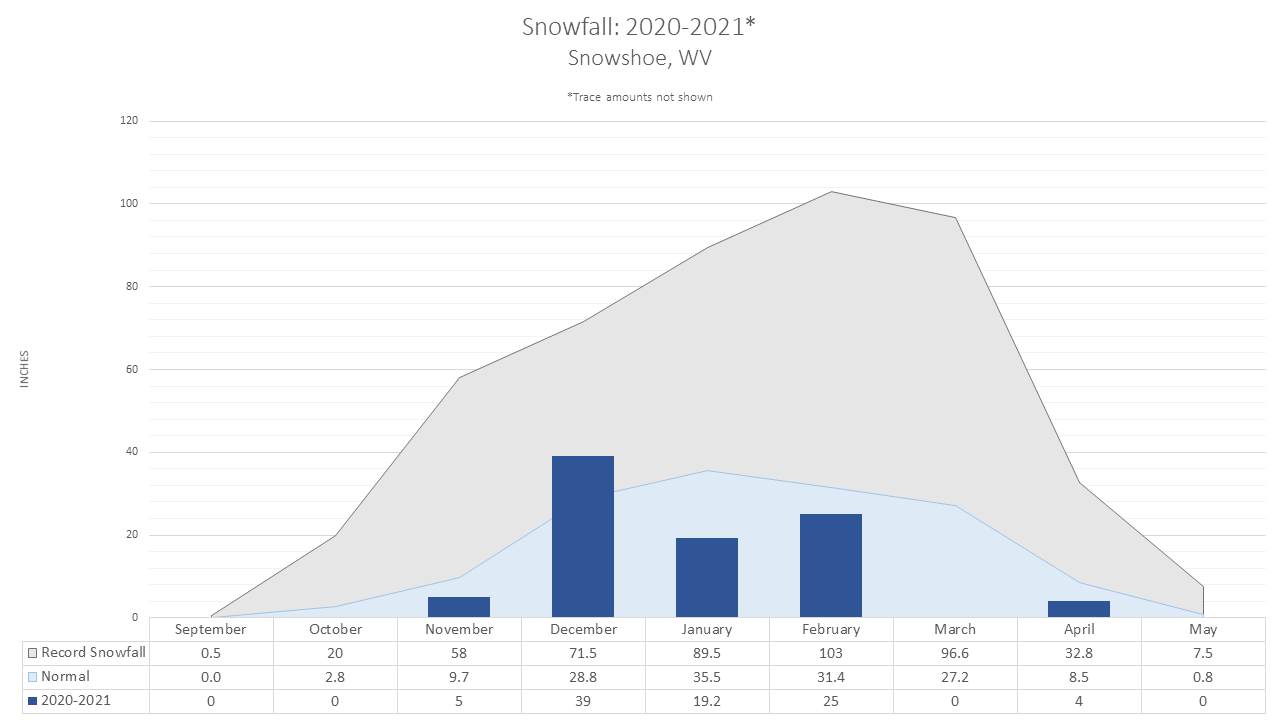
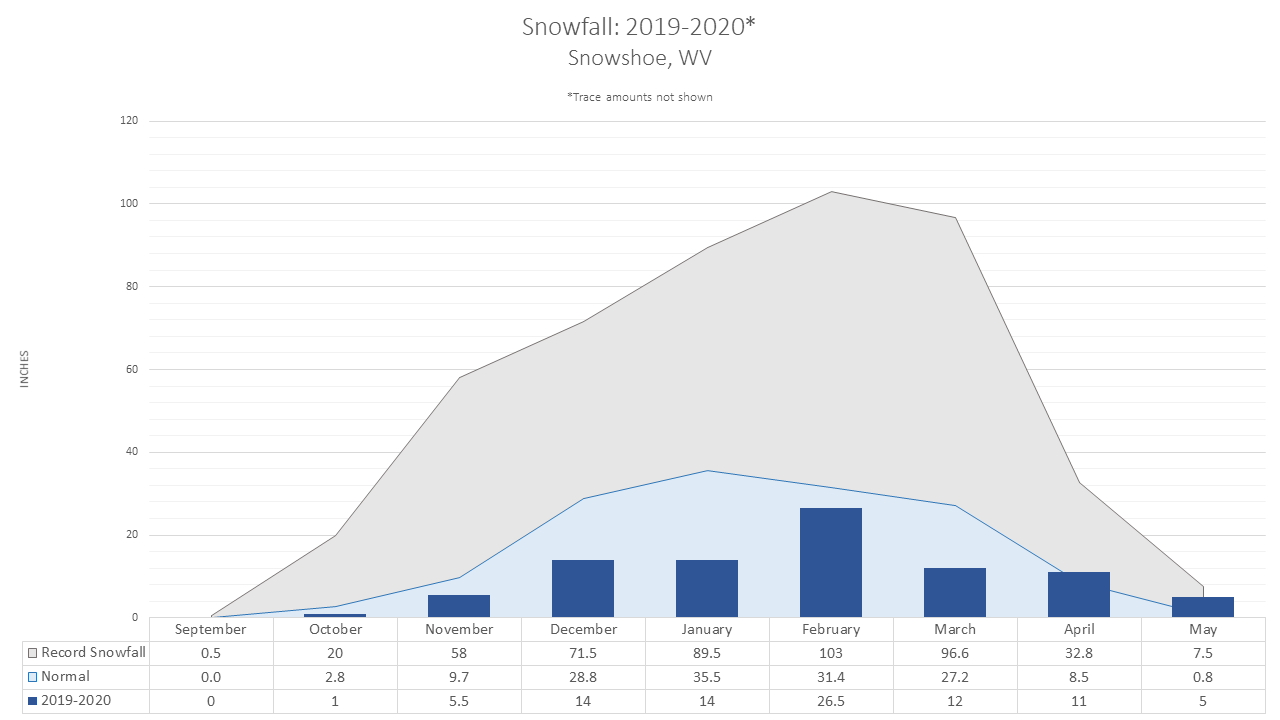
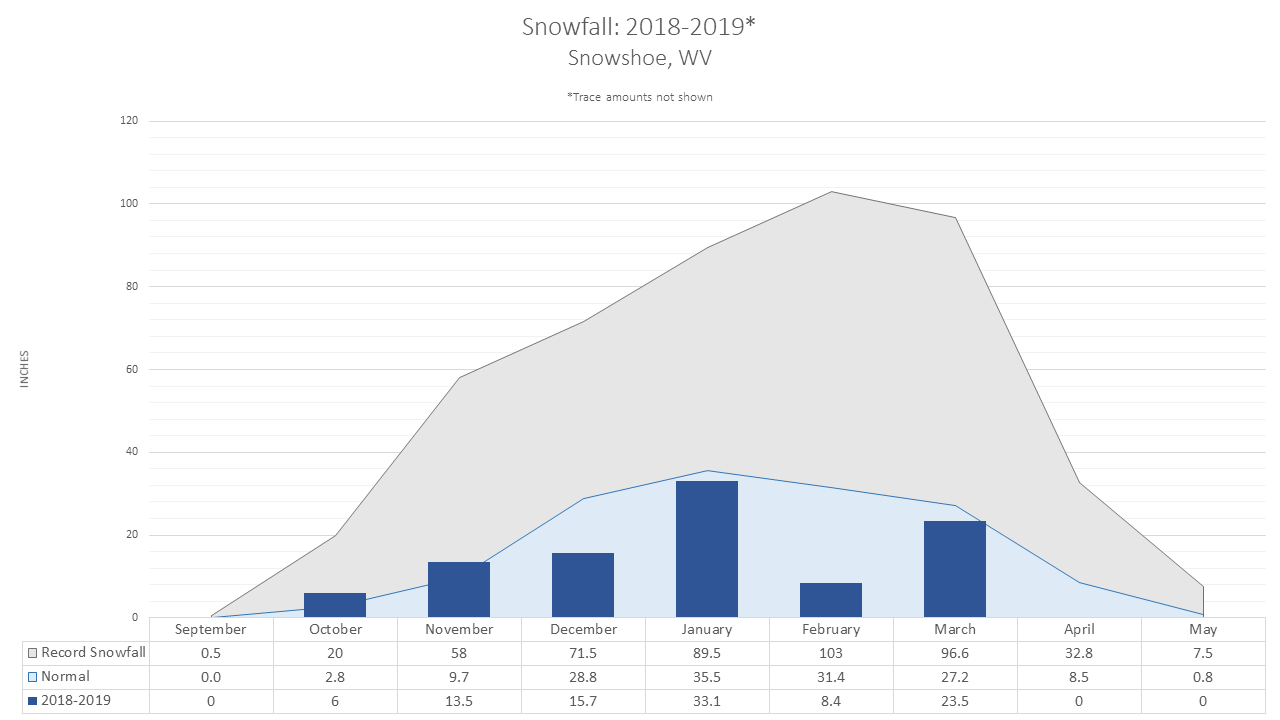
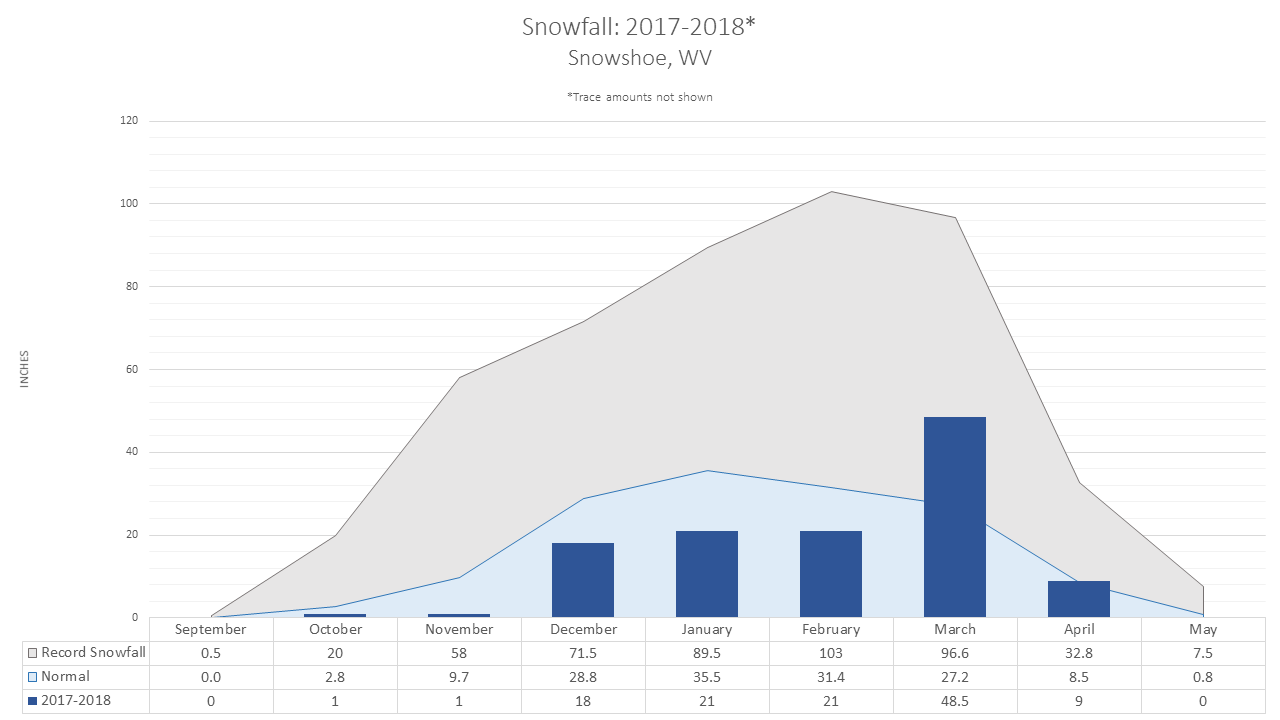
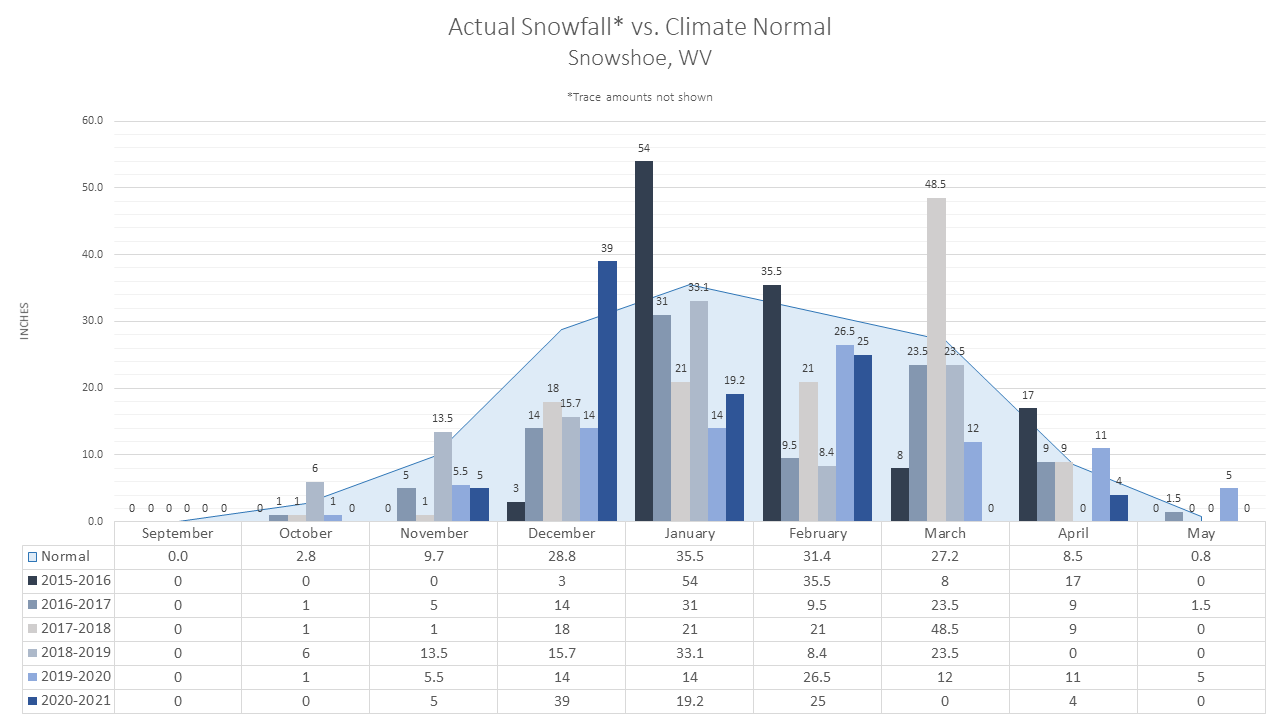
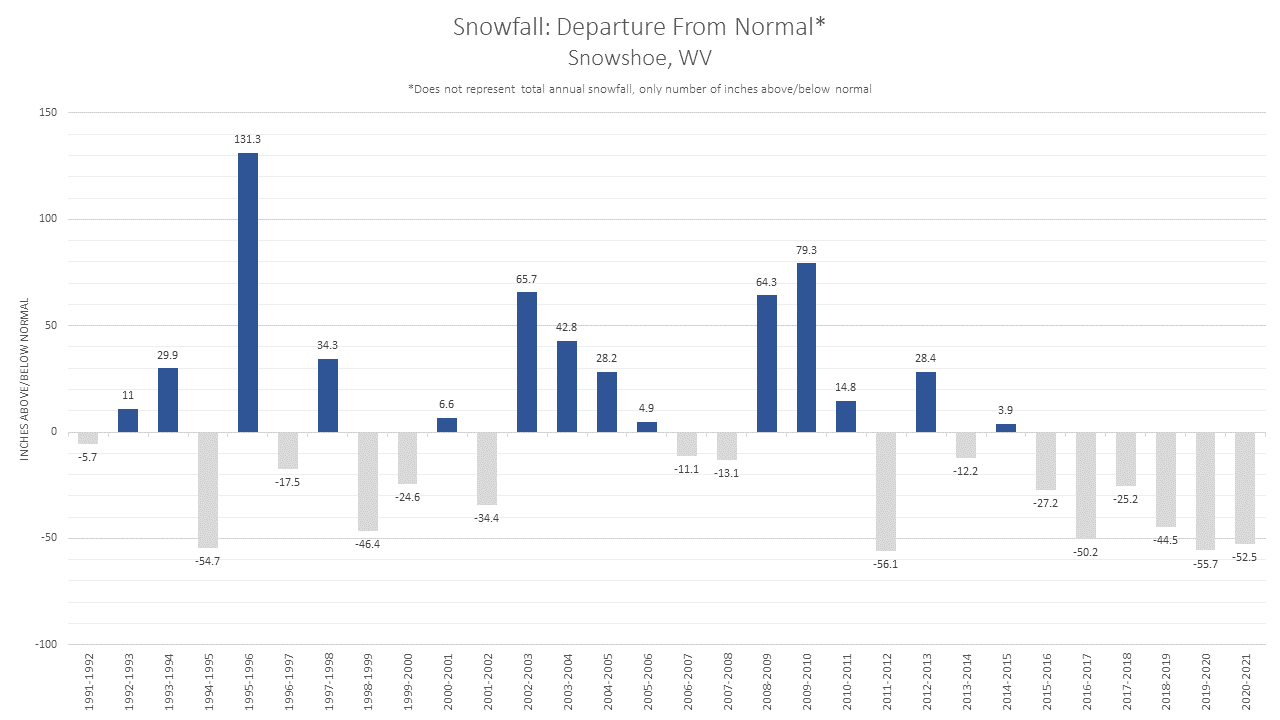
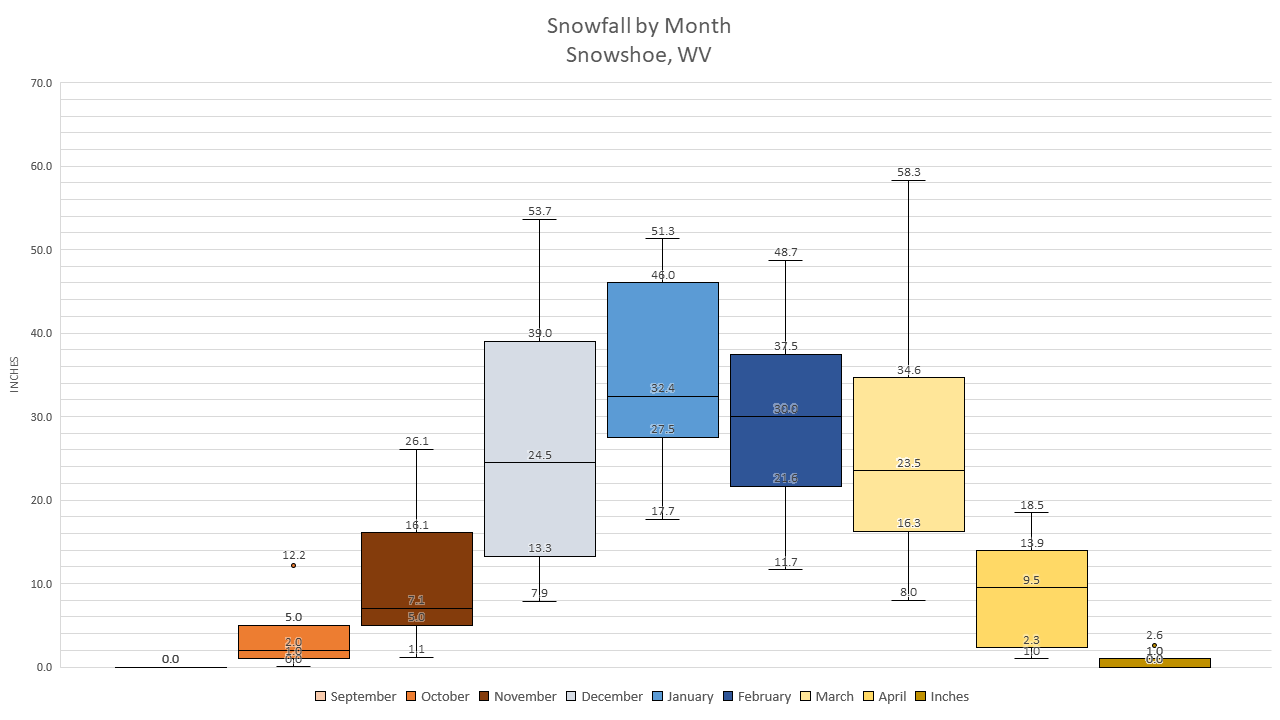
The Snowshoe, WV COOP site averaged the highest snow amounts of all sites within the CWA. Snowshoe also holds the record for highest amount of snowfall in a month in the CWA – 103 inches in January of 2010. This COOP station is located in the mountains of Pocahontas County at an elevation of 4,847 feet—the highest elevation of all the COOP’s in the CWA.
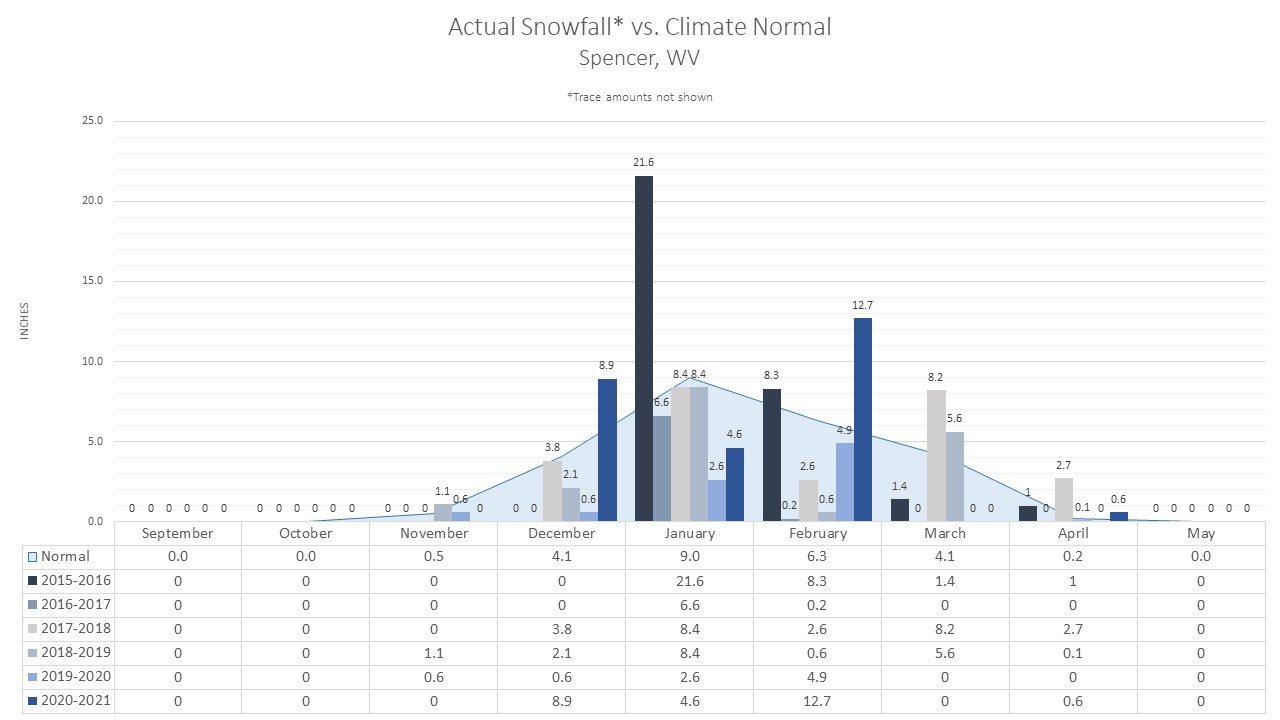
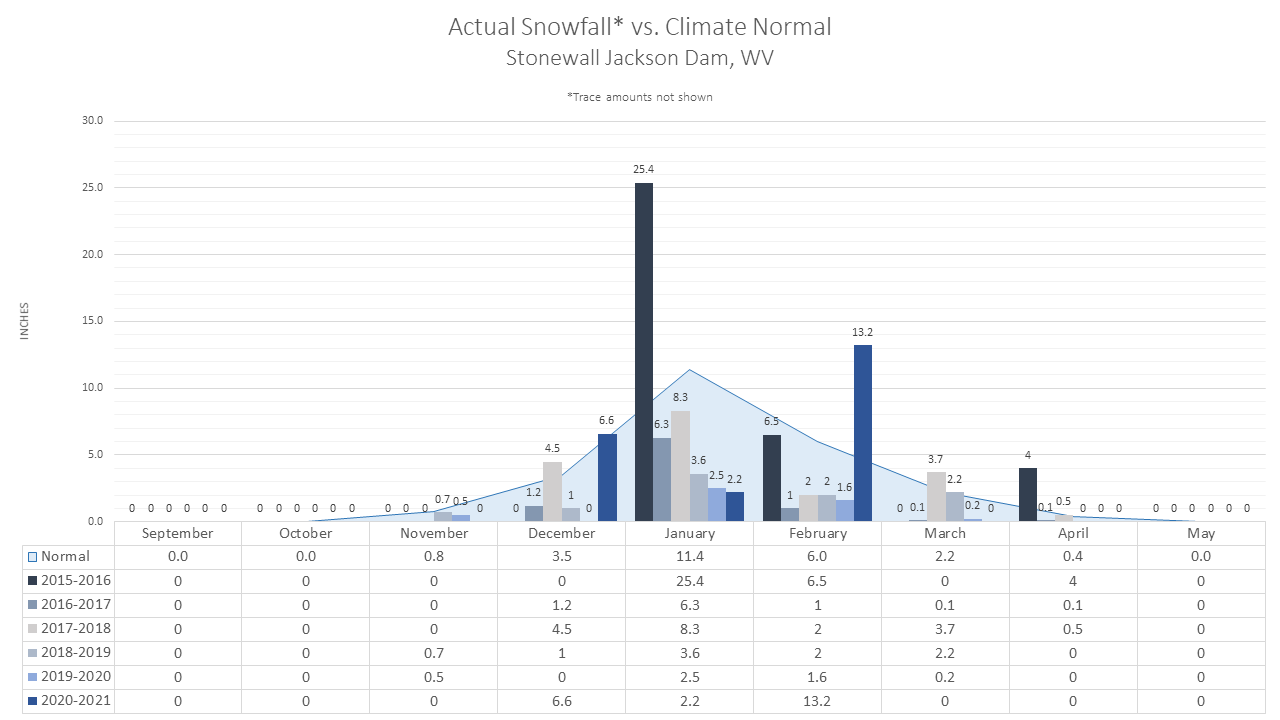
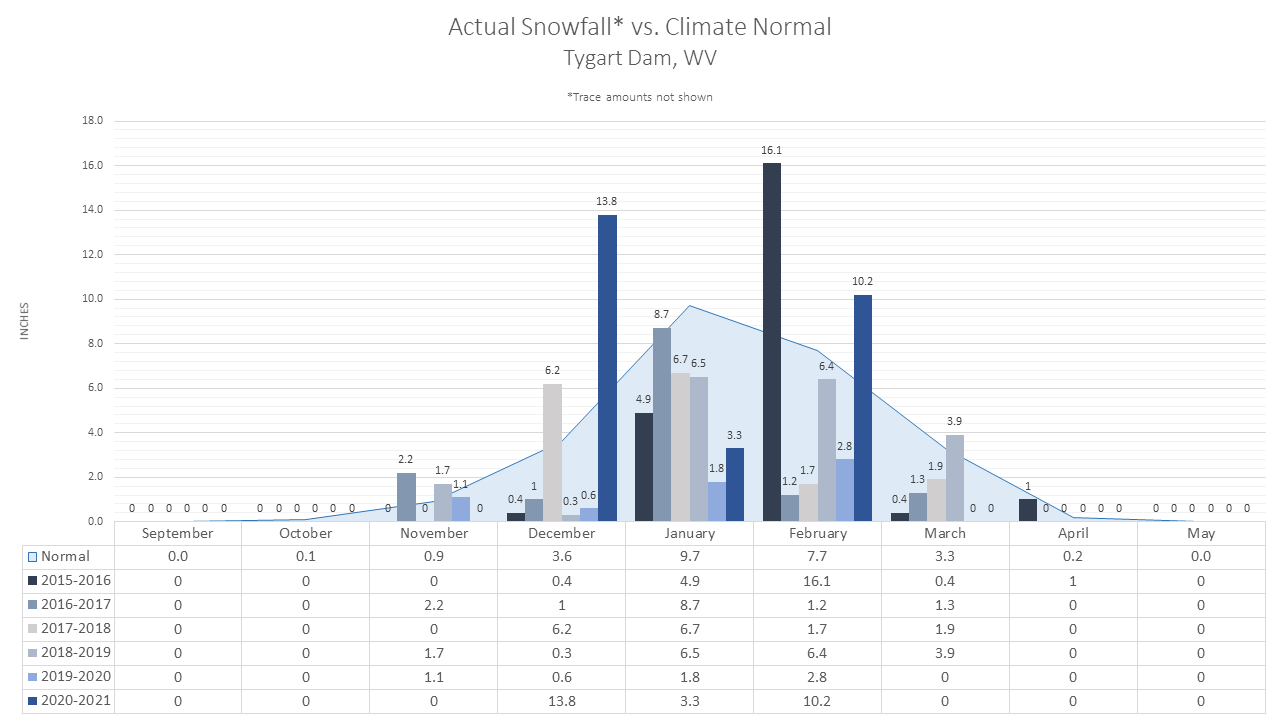
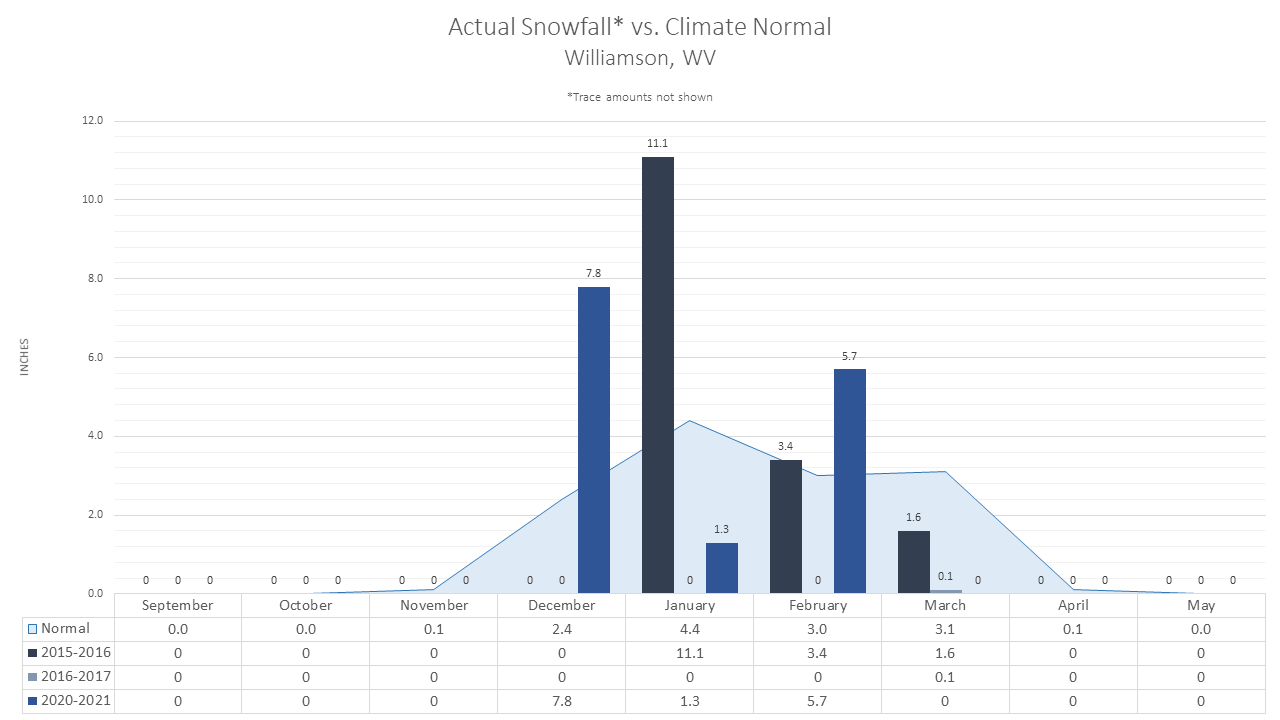
The graphs created for each site may be found in the Site-Specific Snow Graph section below.
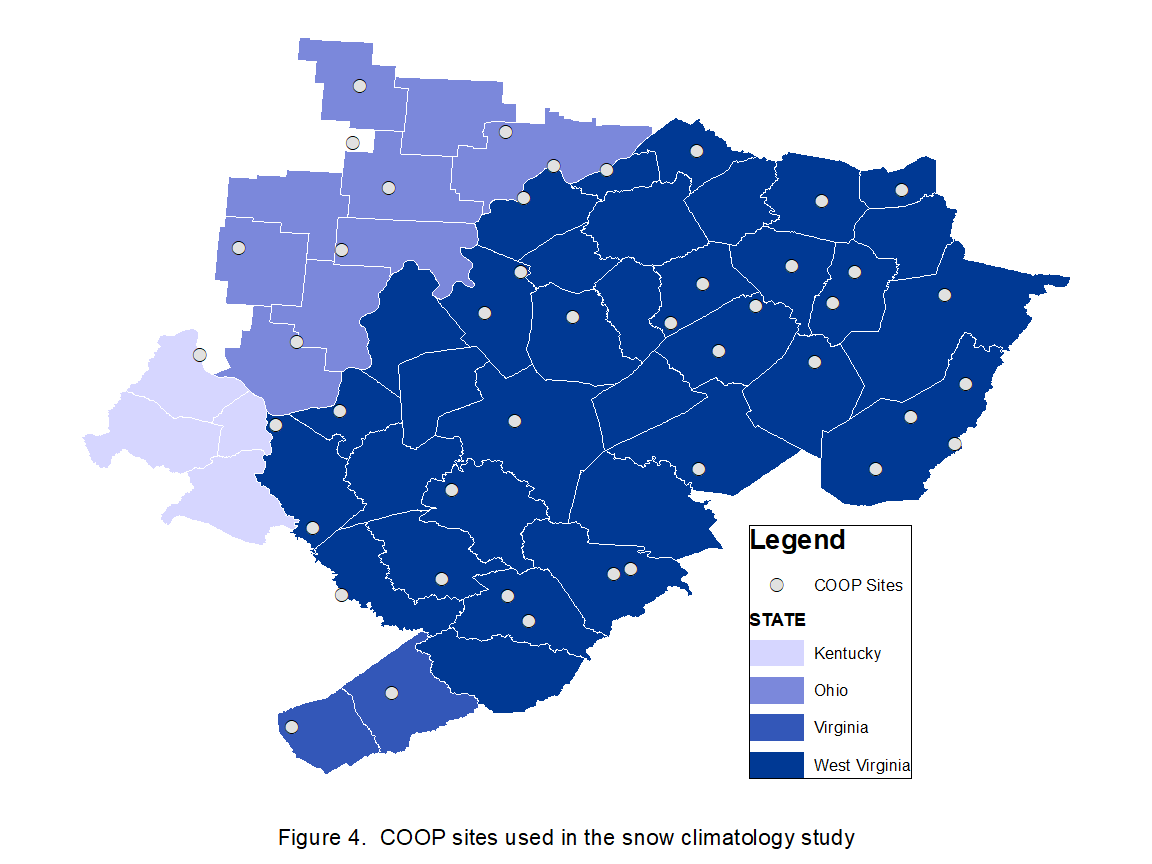
The majority of the information for this study was gleaned from cooperative observer (COOP) data. These sites are manned by trained volunteers who have a desire to provide localized weather and climate information to the WFO. Though sites used in this study have been evaluated for accuracy and minimal missing data, some values may differ from official records.
One challenge was choosing stations across the CWA that would accurately represent the area. The original goal was to have at least one site in each county across the CWA. Though in some cases this was not possible. Also, counties with more complex terrain may have more than one site to better reflect the conditions experienced there.
Another challenge was sifting through sites to find those with an adequate amount of data. For instance, some sites only report snowfall when it occurs and the rest of the time leave that portion as missing instead of entering a zero observation. This made determining which locations didn’t receive snow versus which ones were actually missing observations a challenge. Ideally, the chosen COOP sites needed to be active for the entire thirty-year study period though a few sites with a smaller dataset have been included
Figure 4 (below) shows the approximate locations of the COOP sites chosen for in-depth study.
Site Specific Snowfall Graphs
|
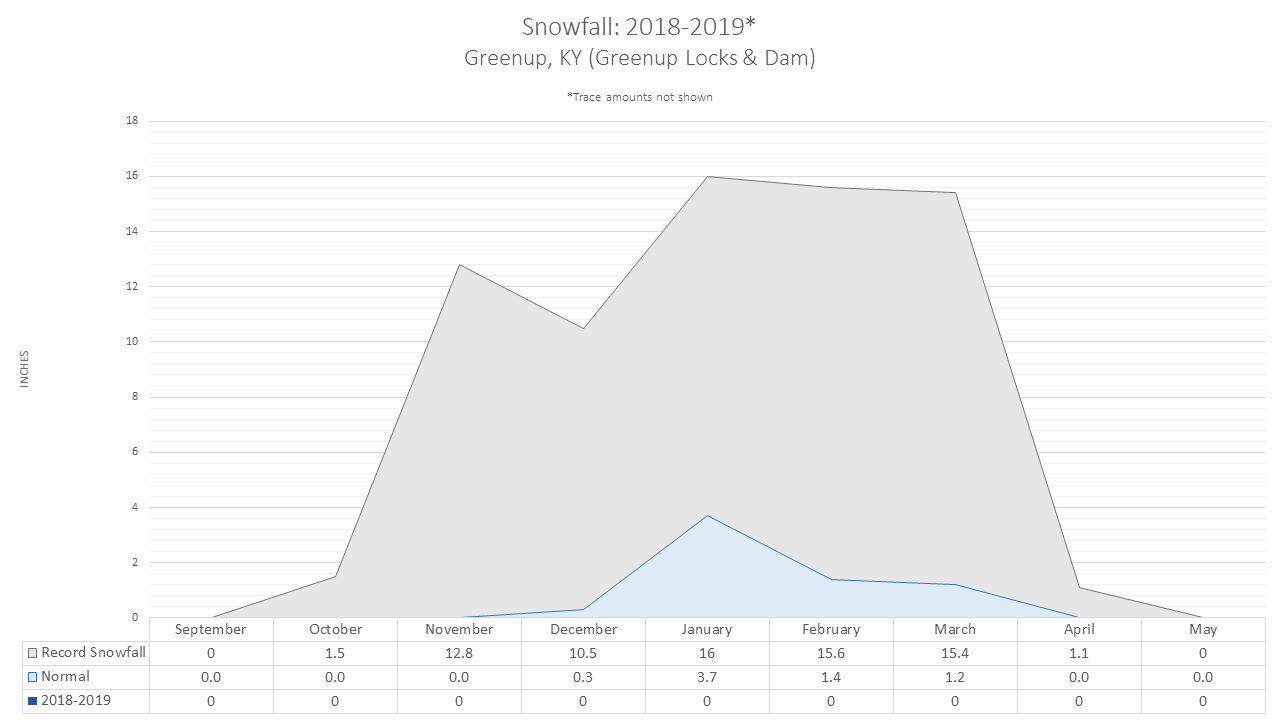
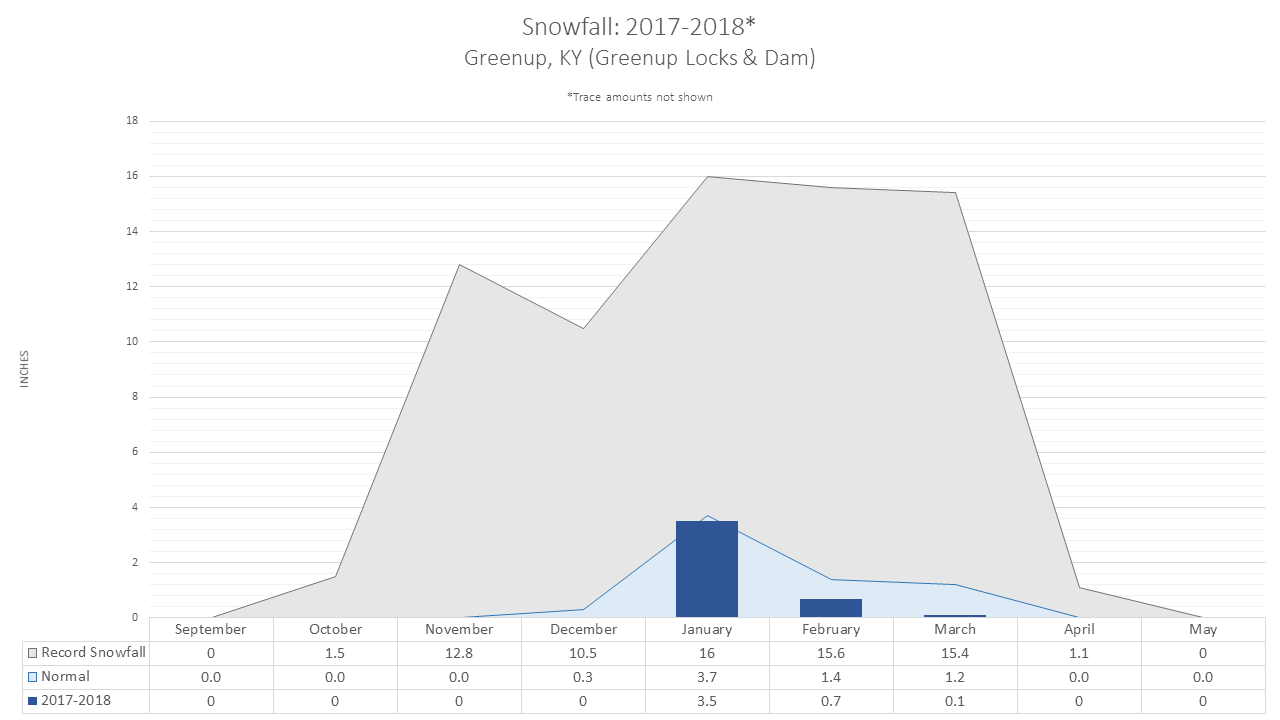
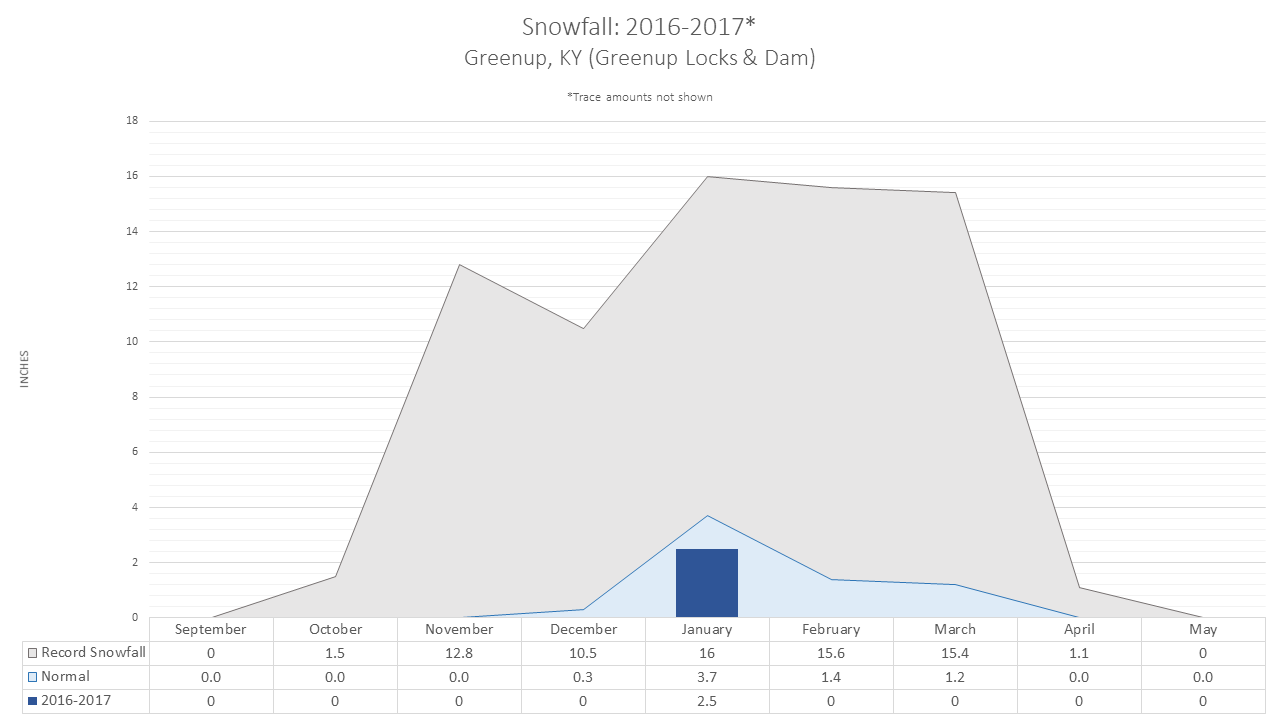
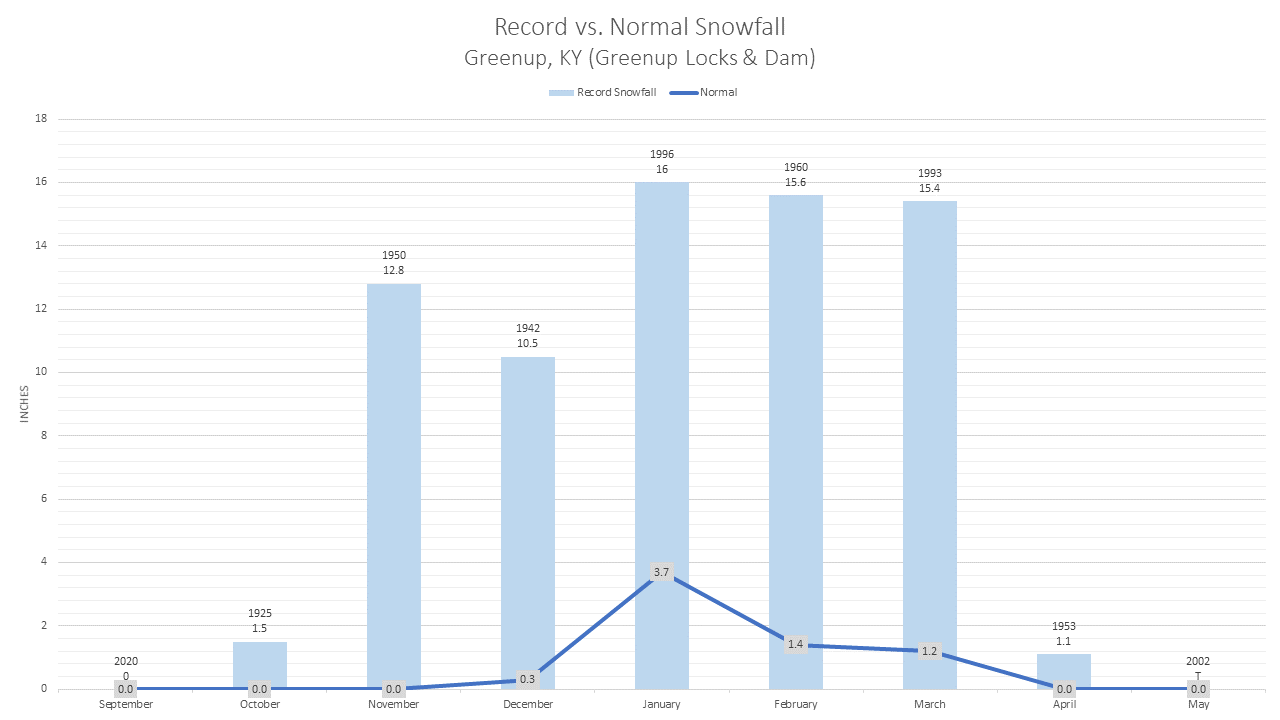
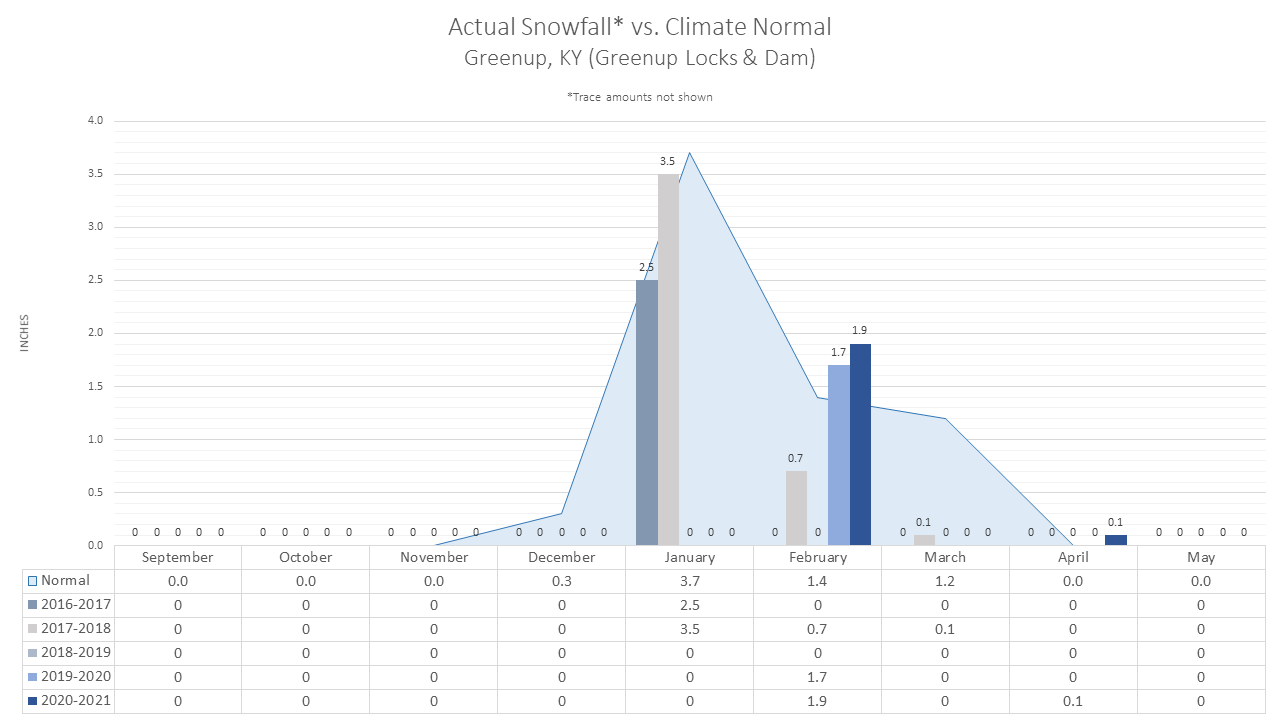
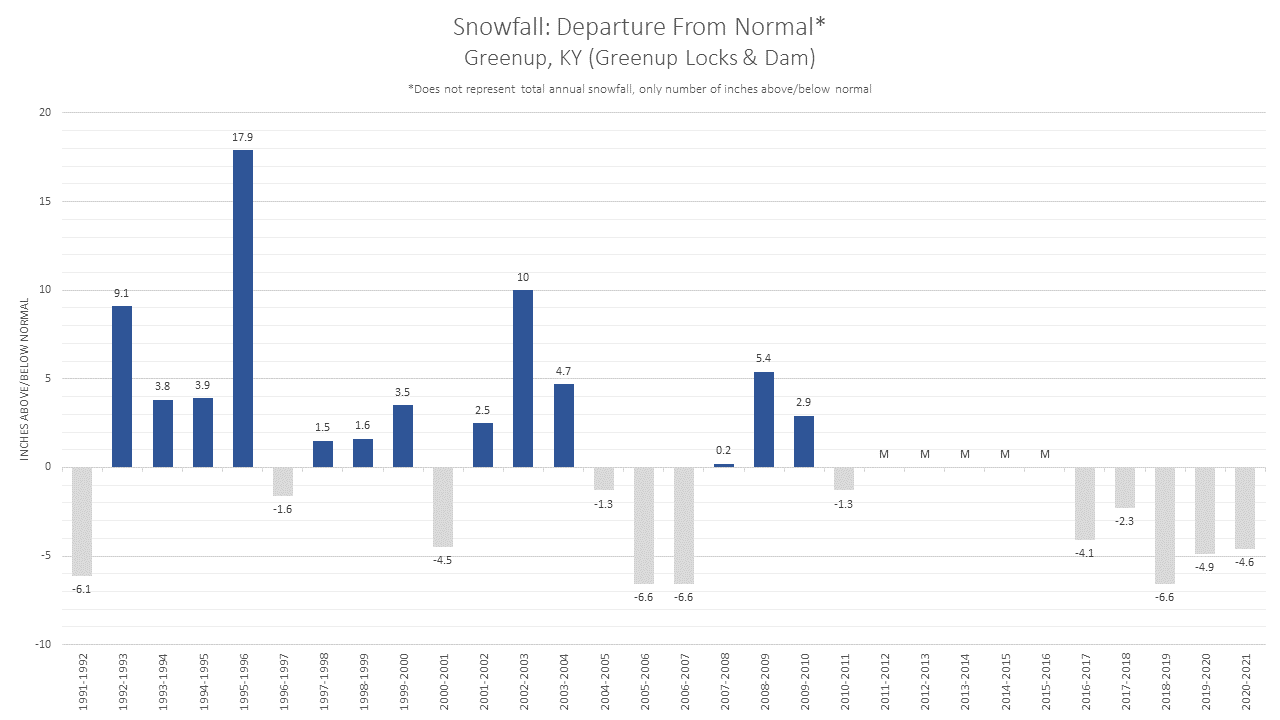
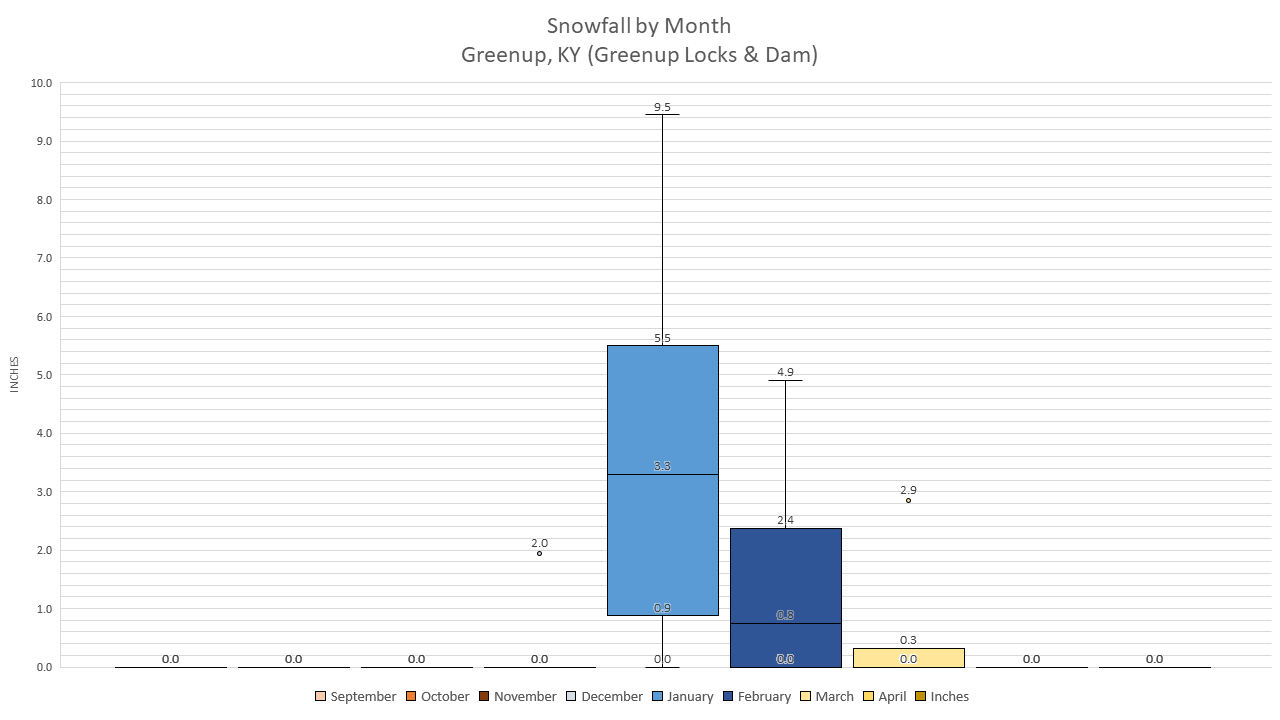
Greenup, KY (Greenup Locks & Dam) |
-- |
|
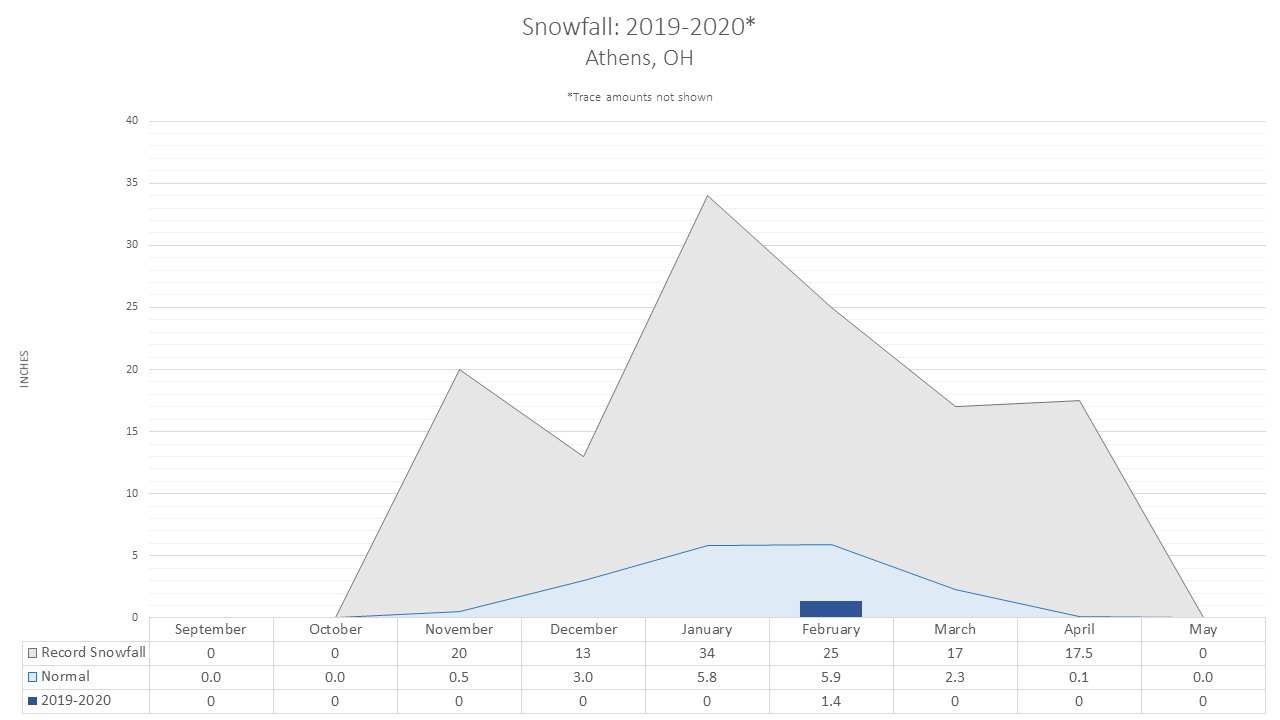
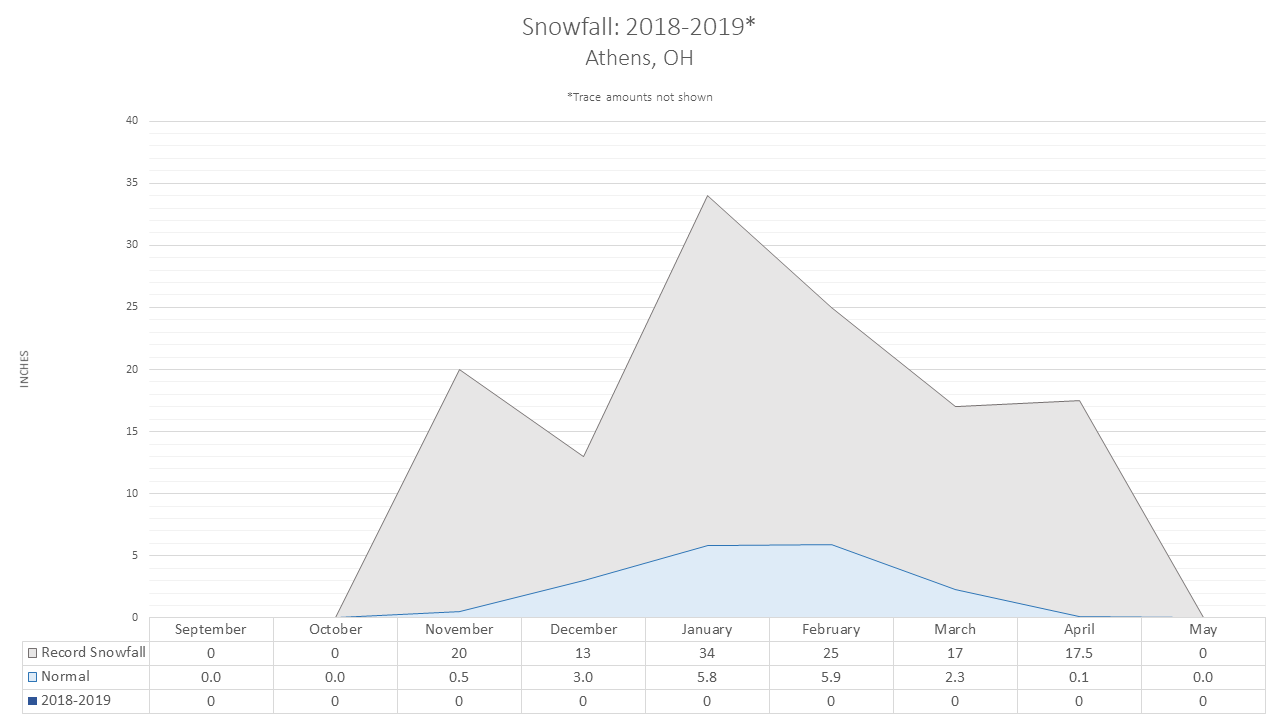
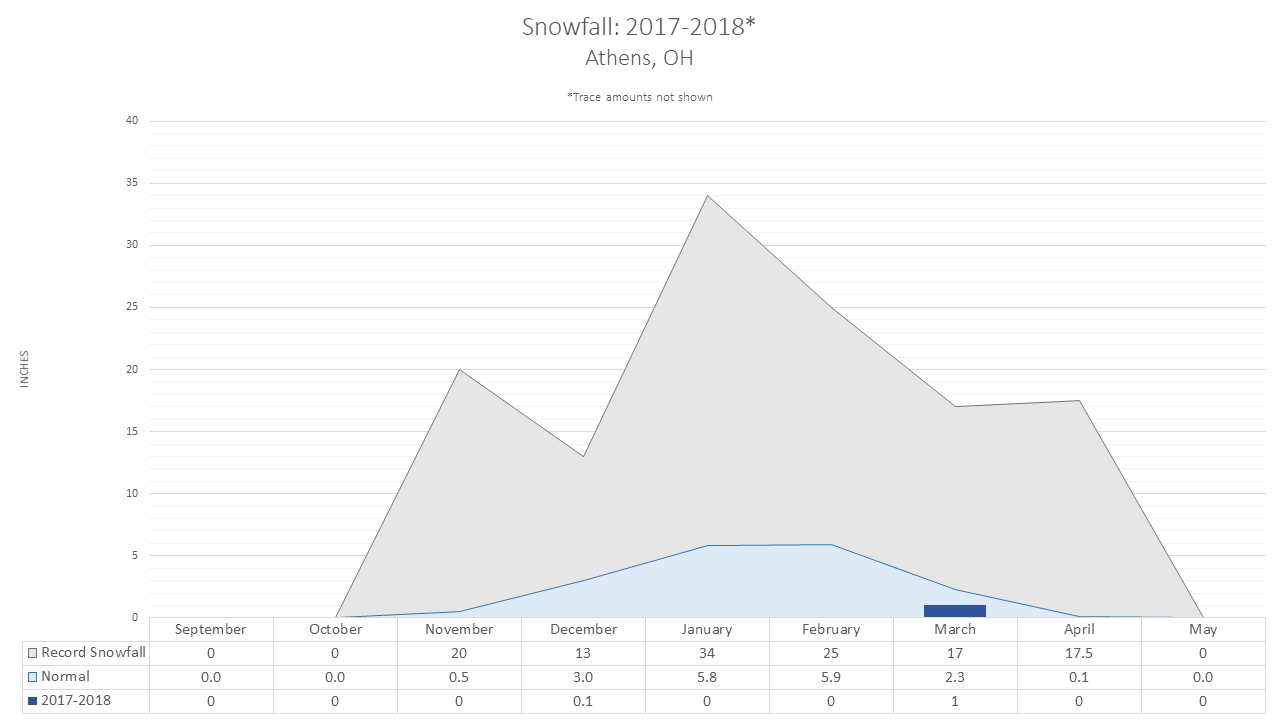
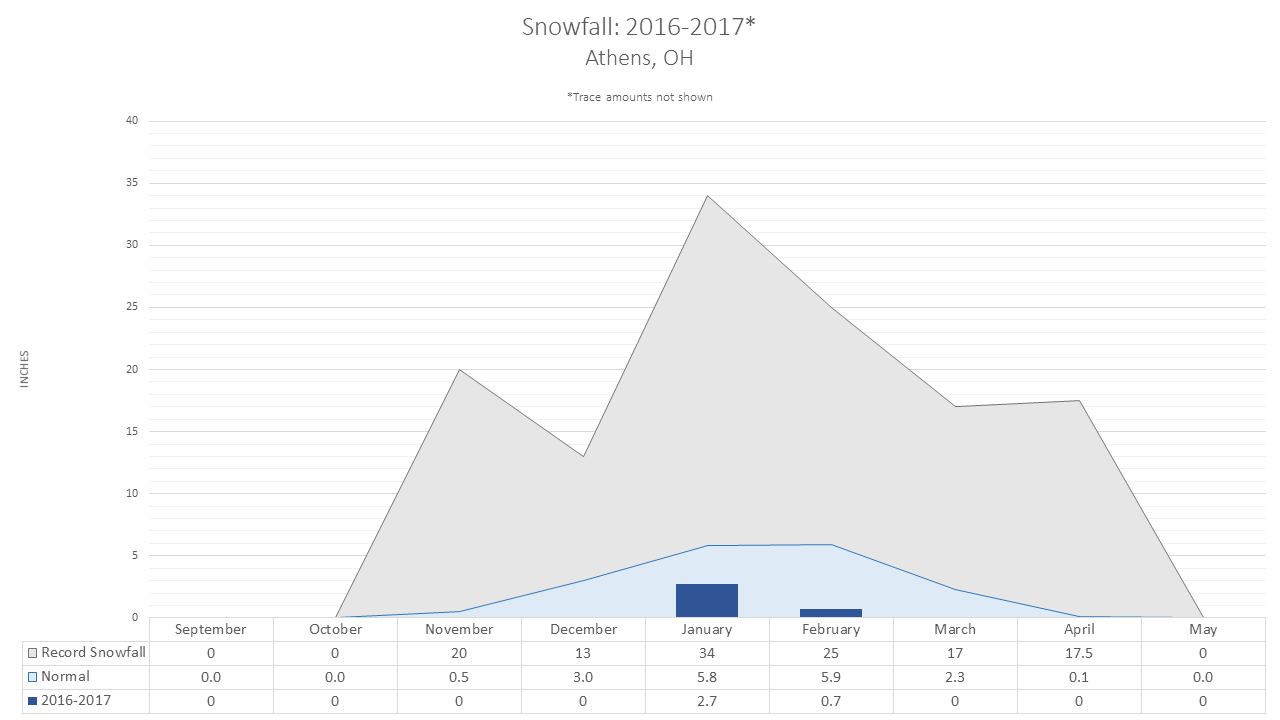
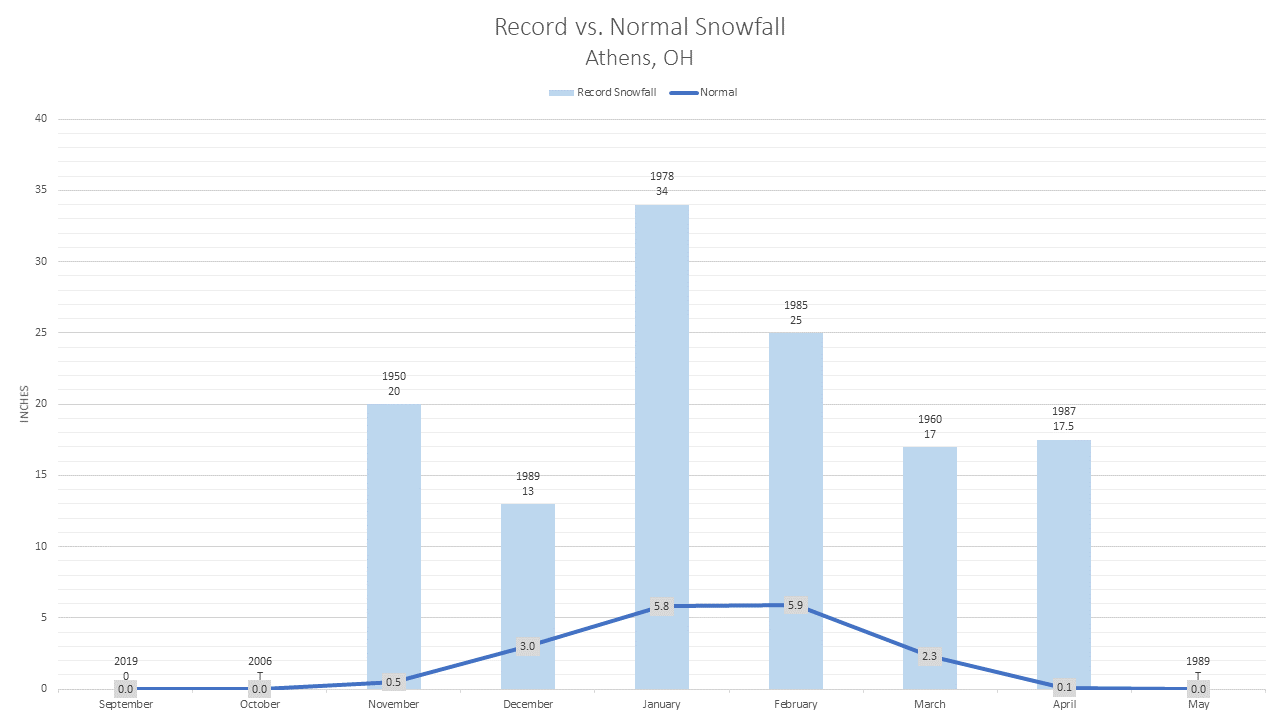
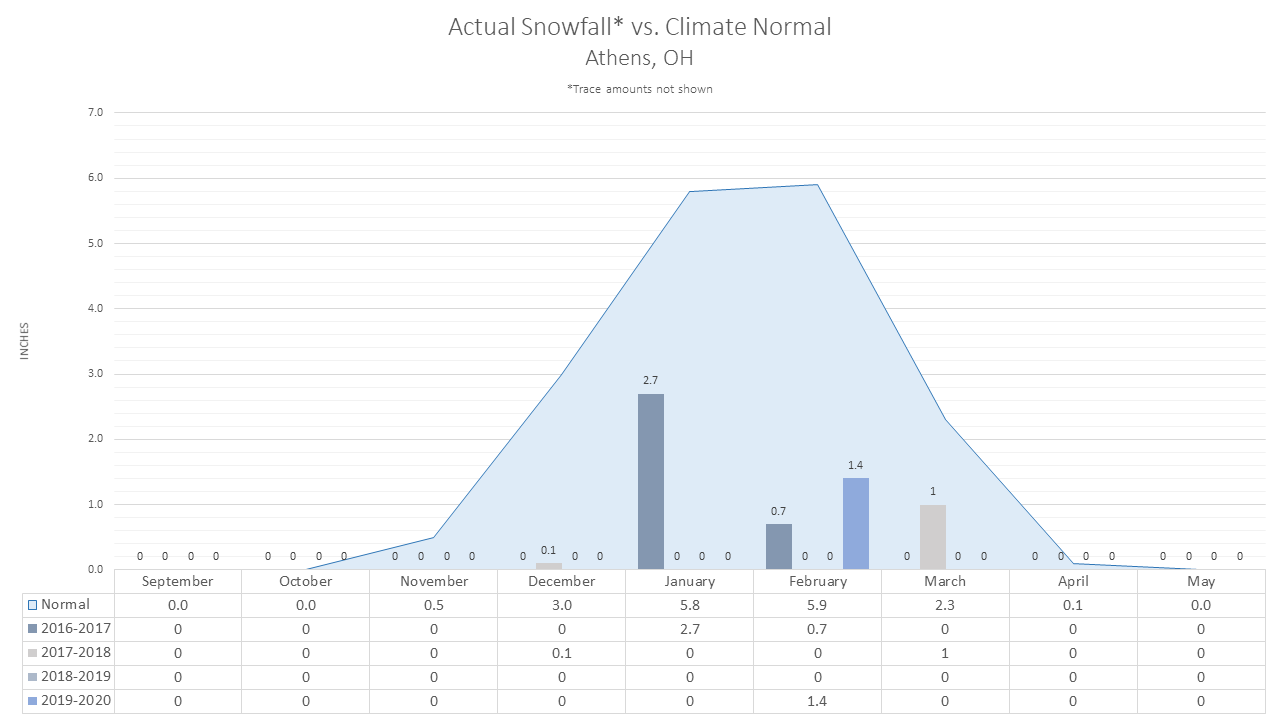
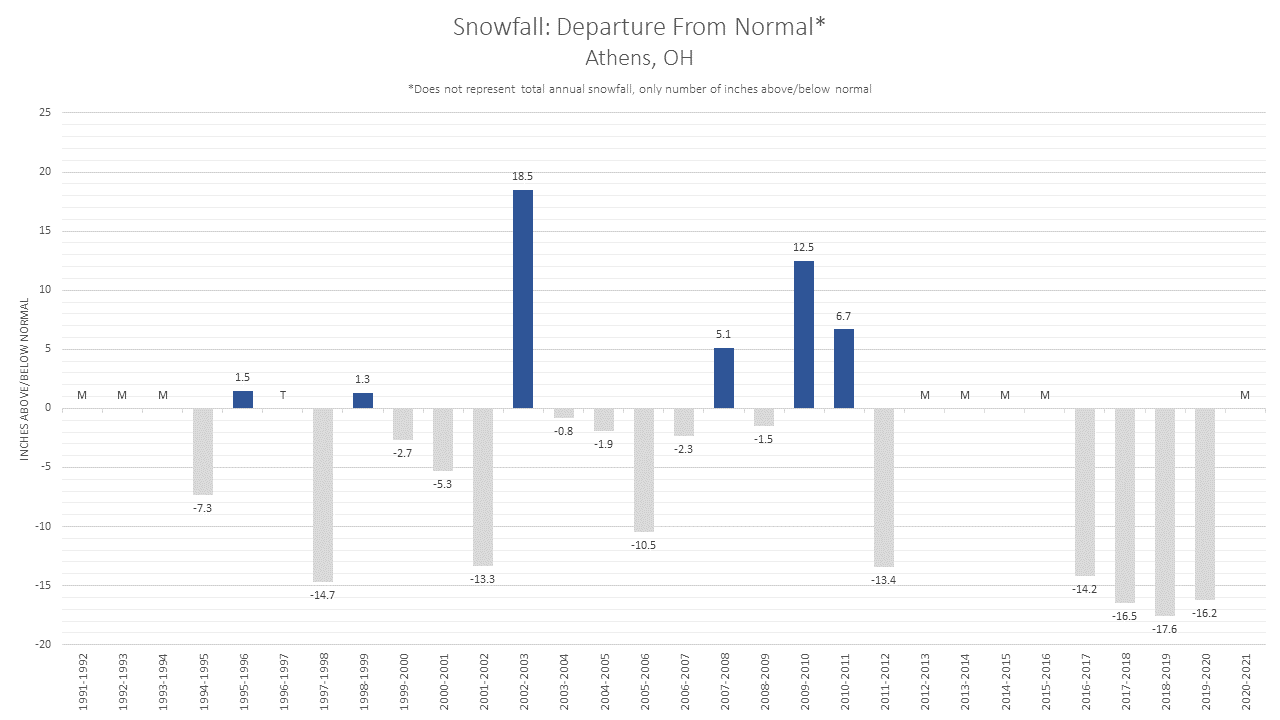
Athens, OH |
-- |
-- |
||||
|
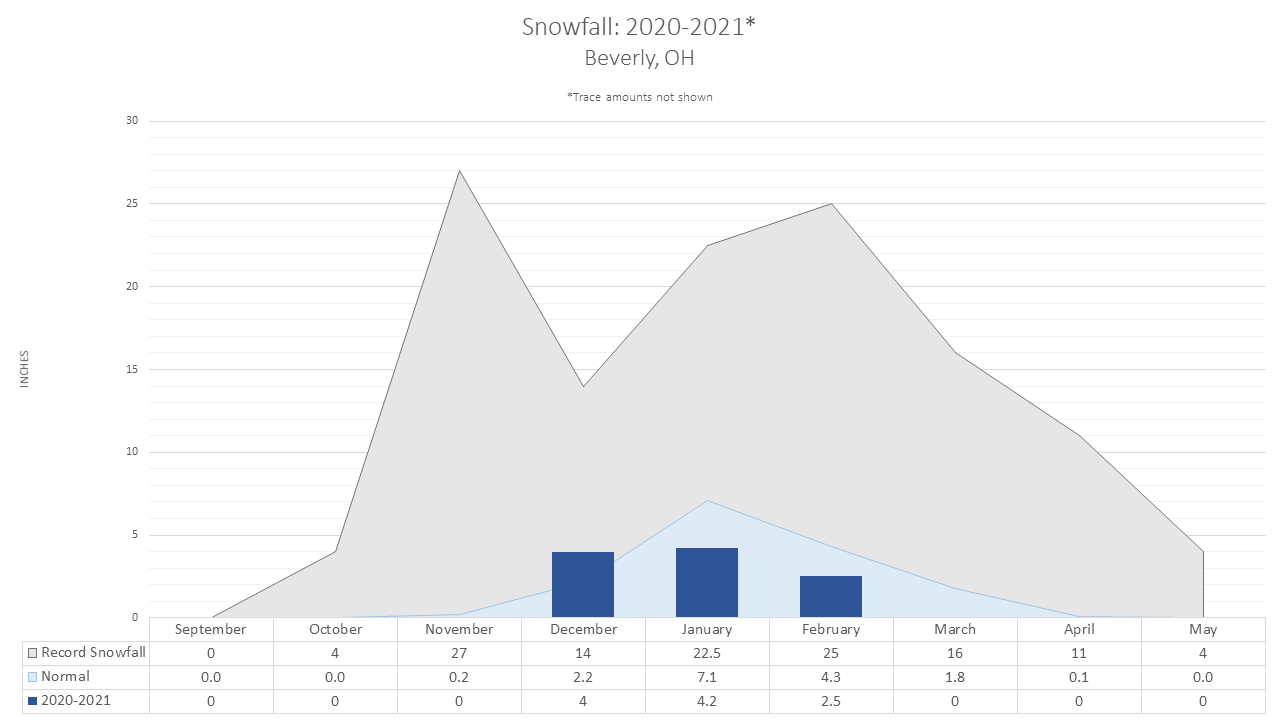
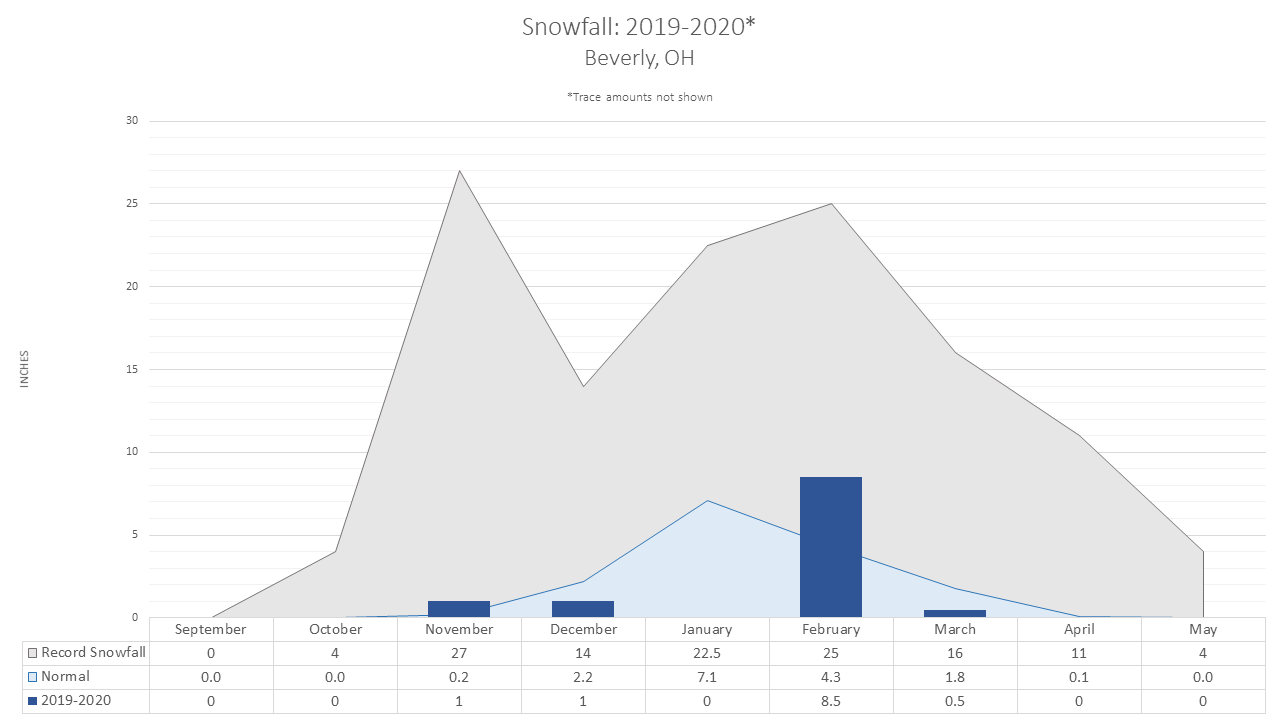
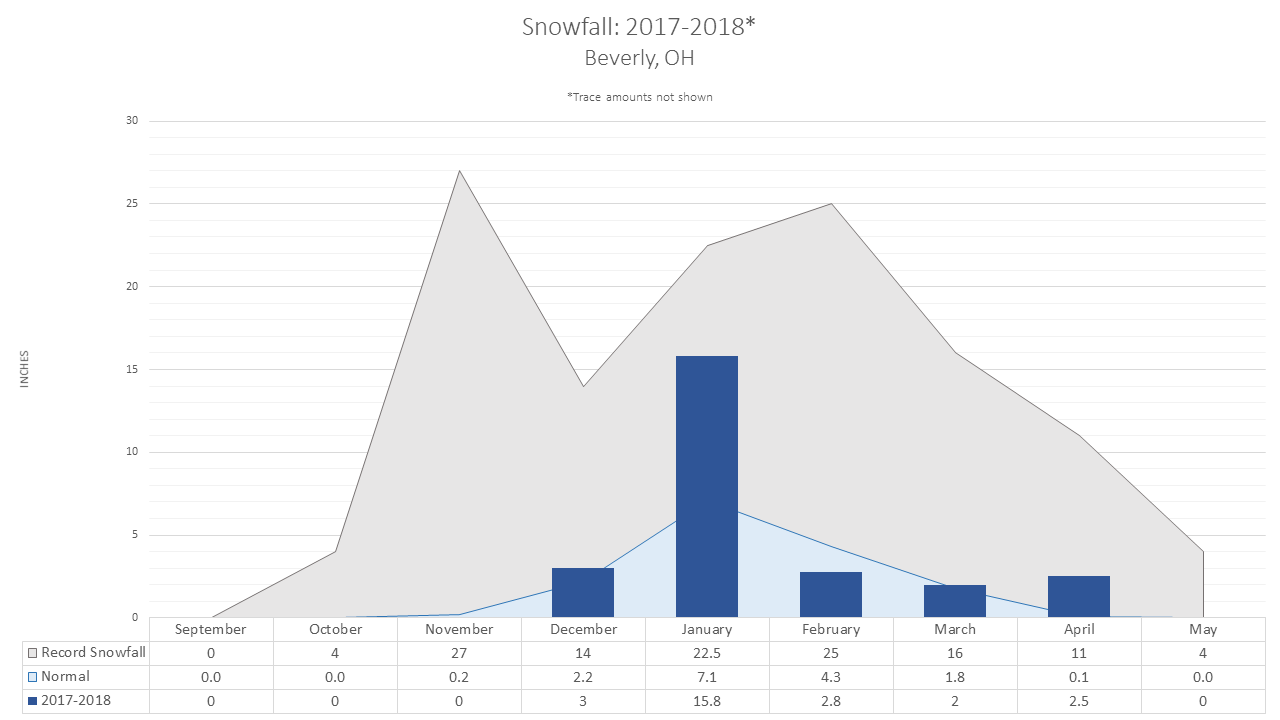
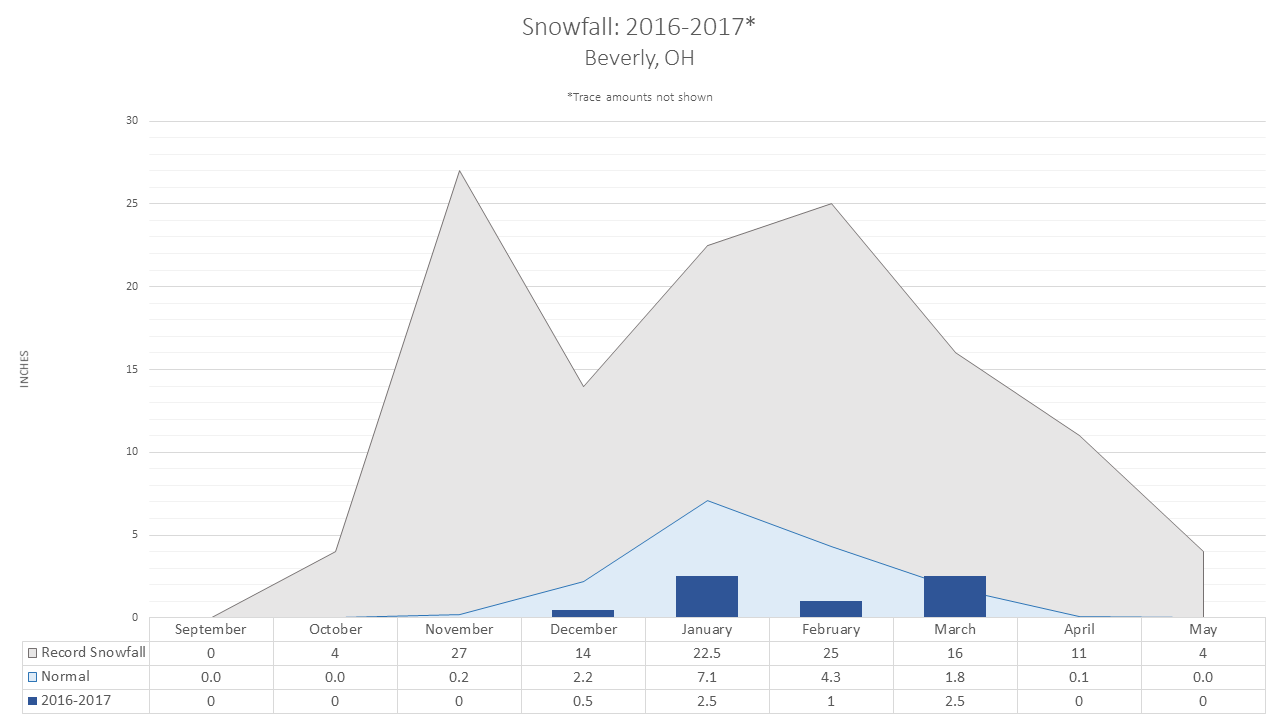
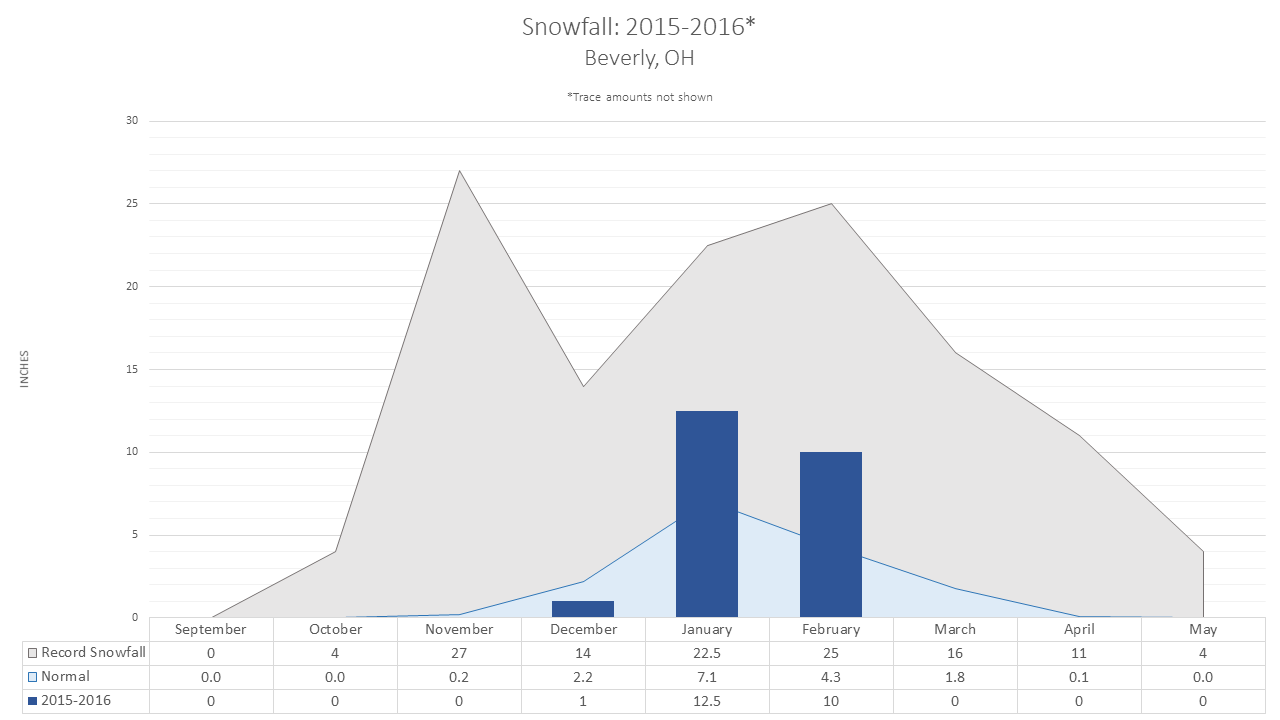
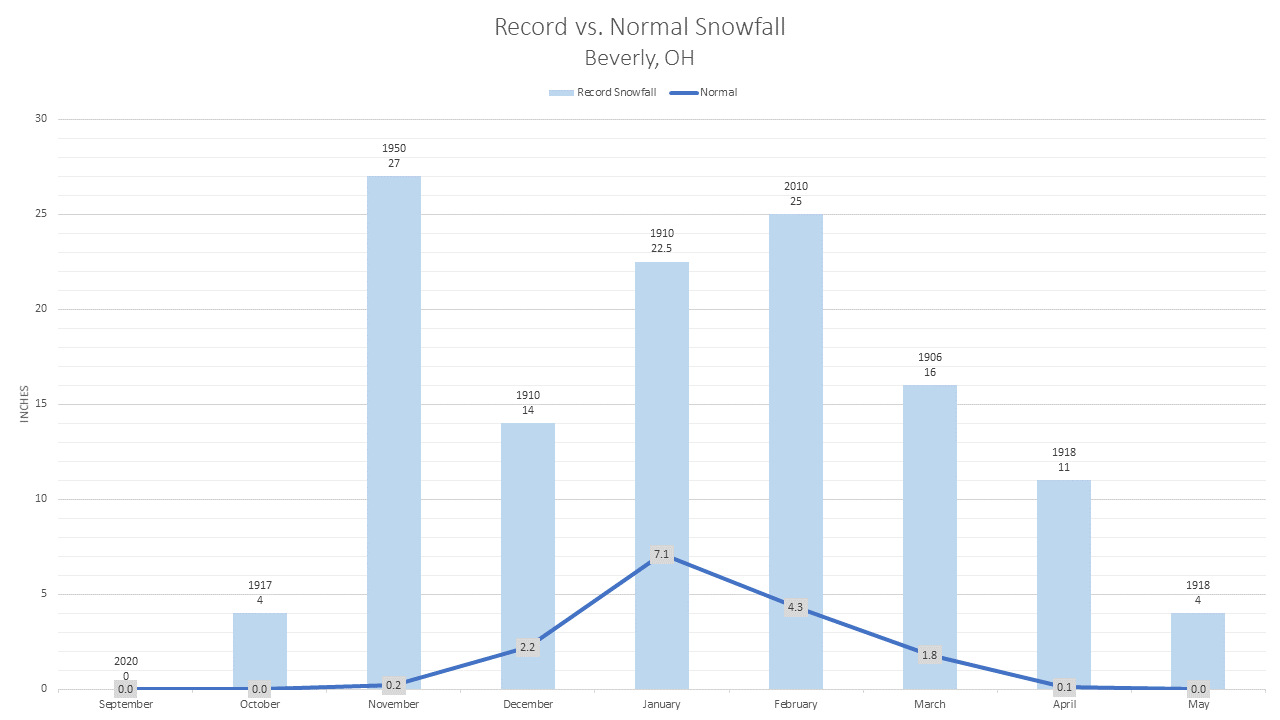
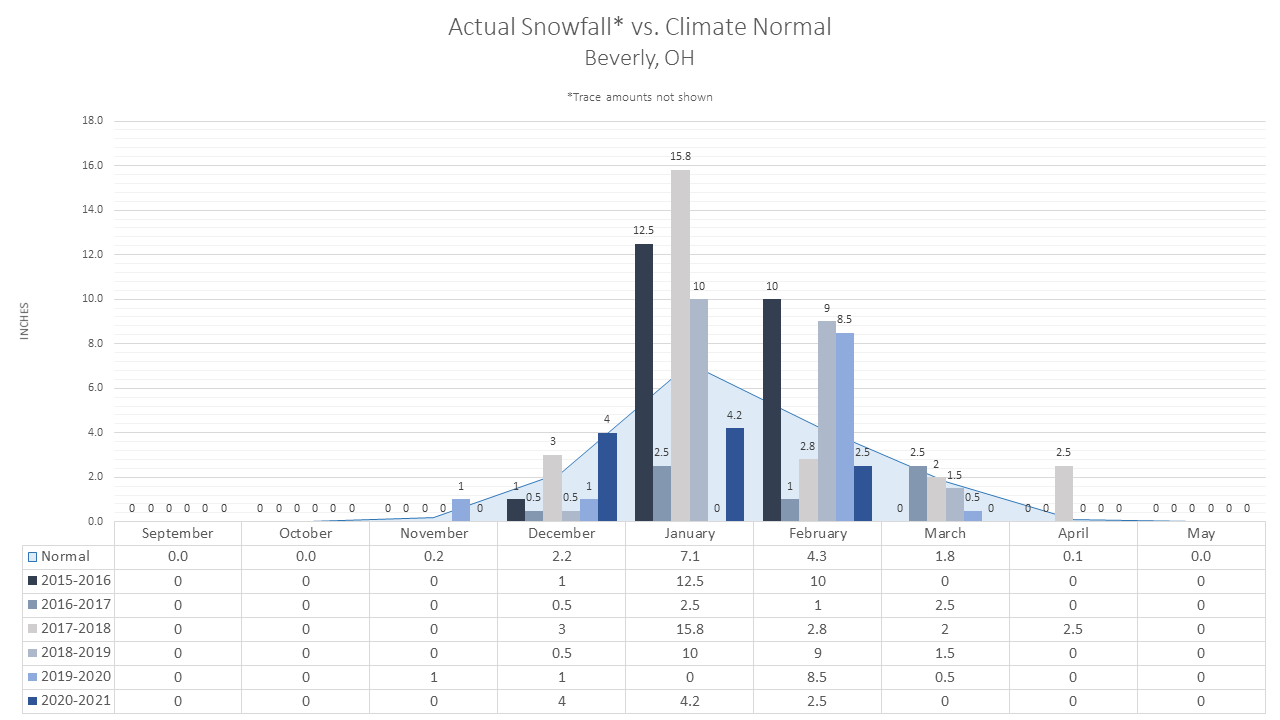
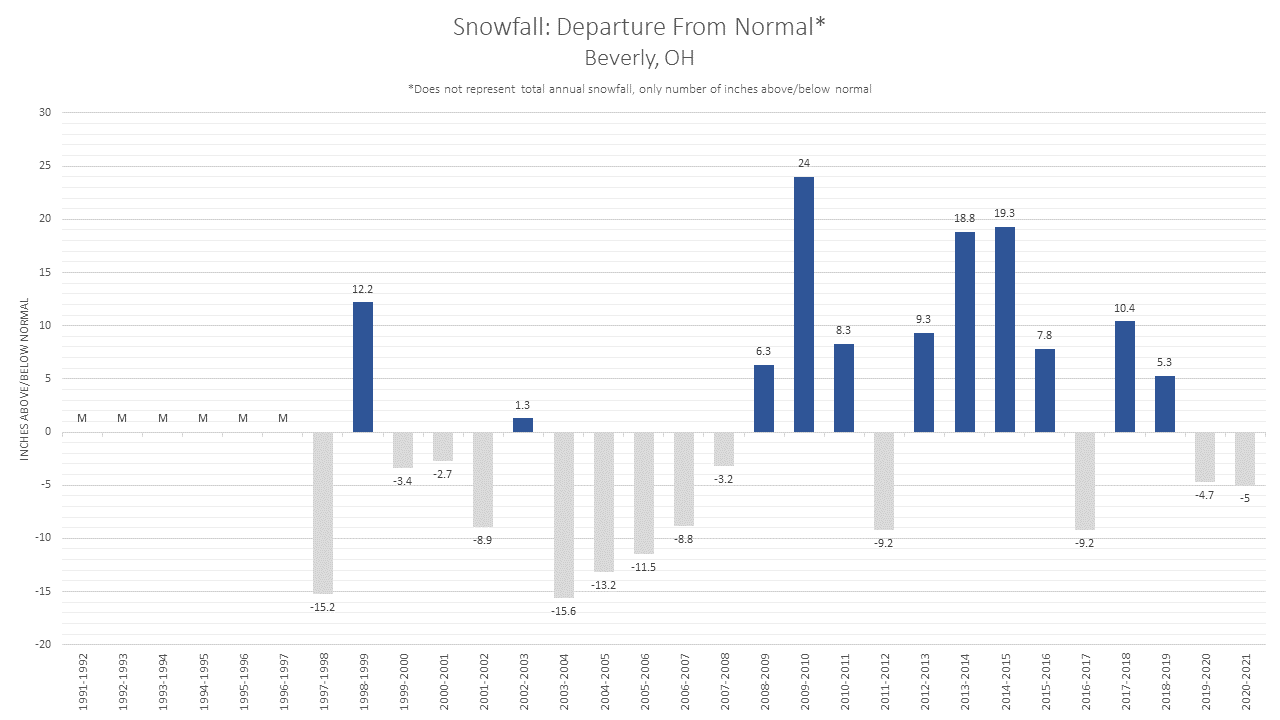
Beverly, OH |
||||||
|
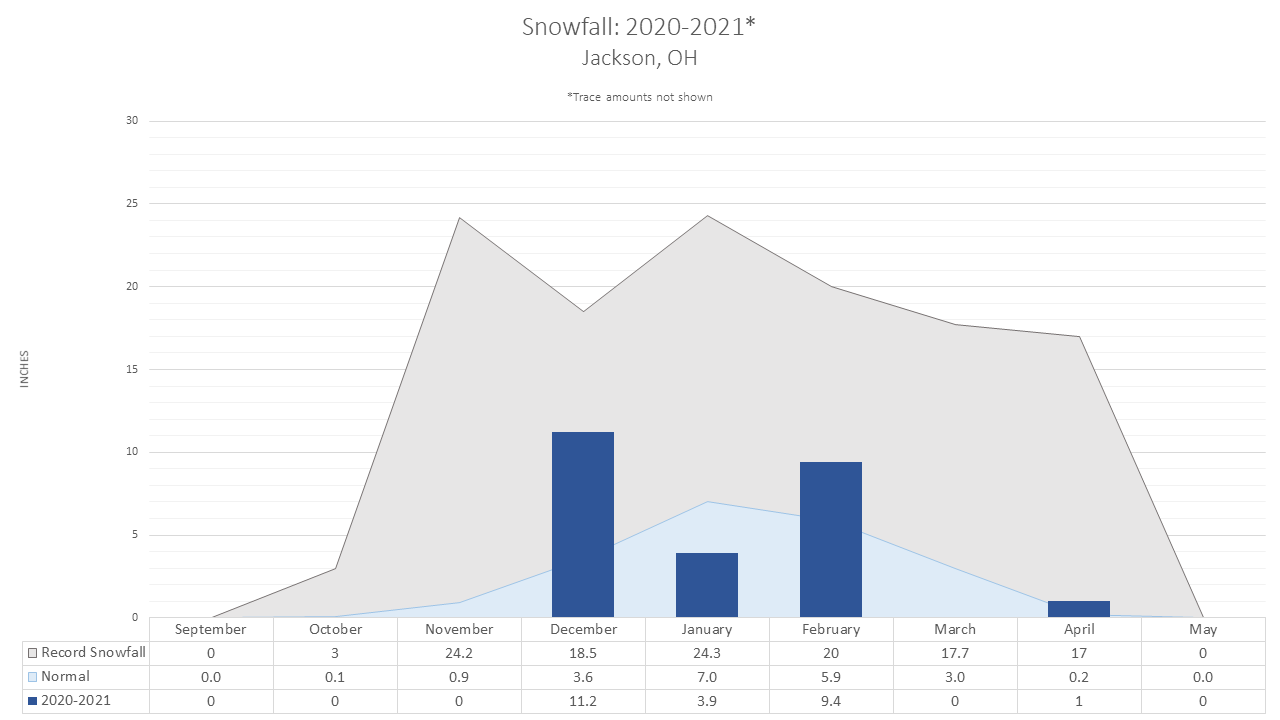
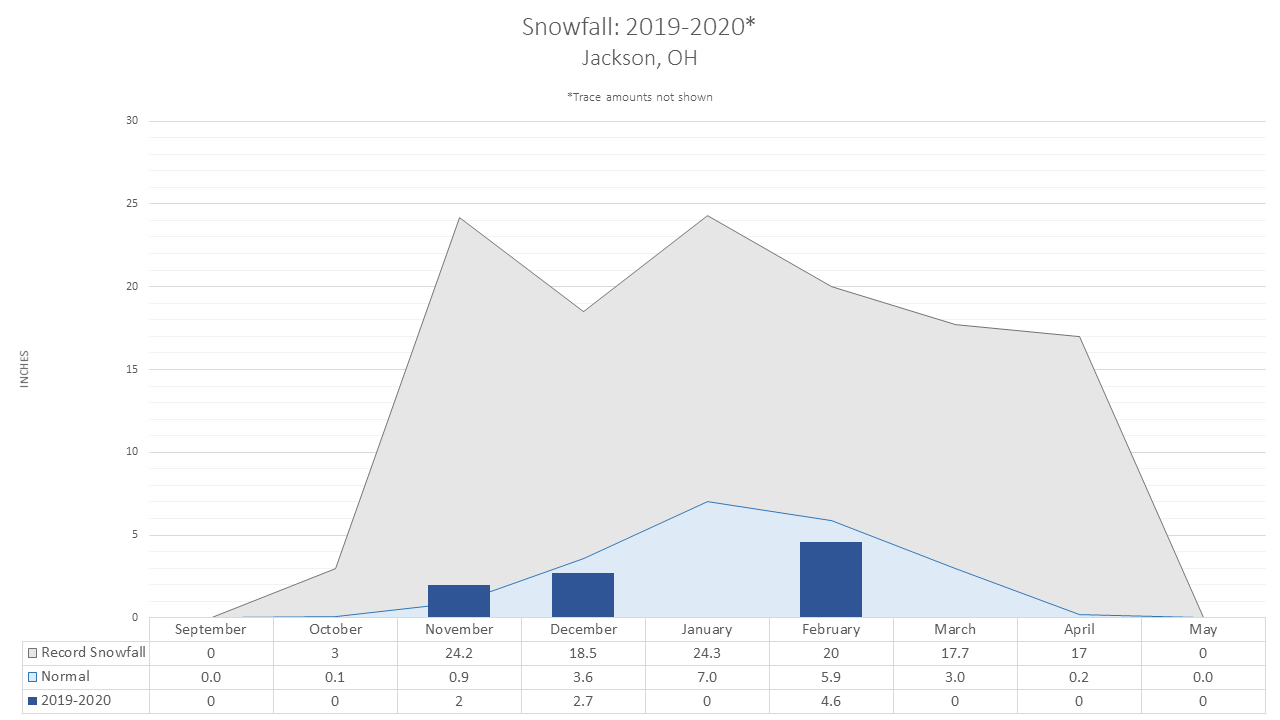
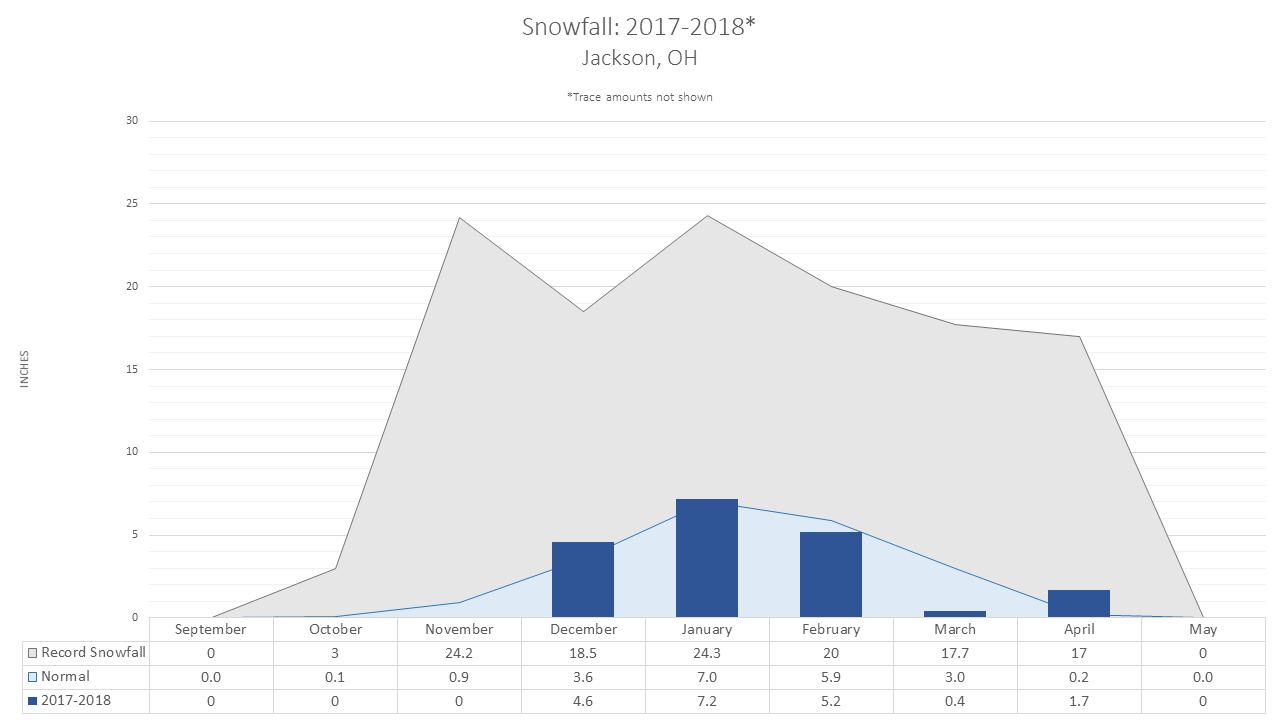
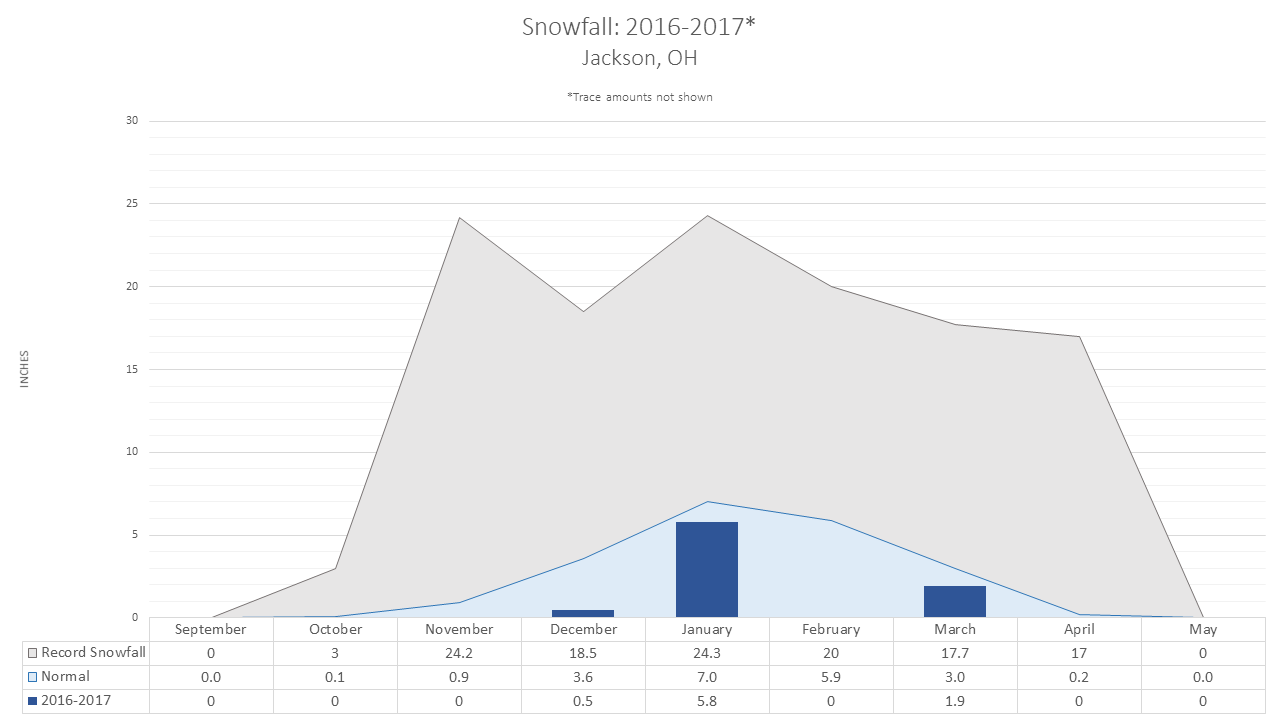
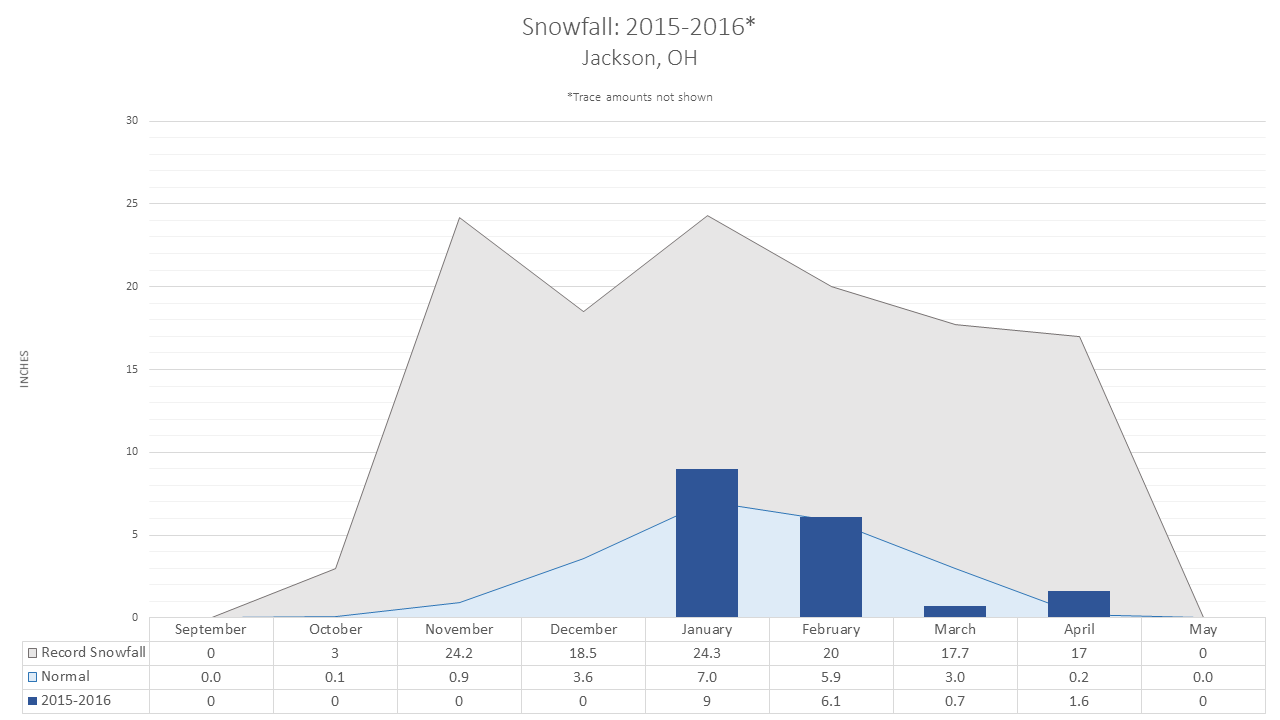
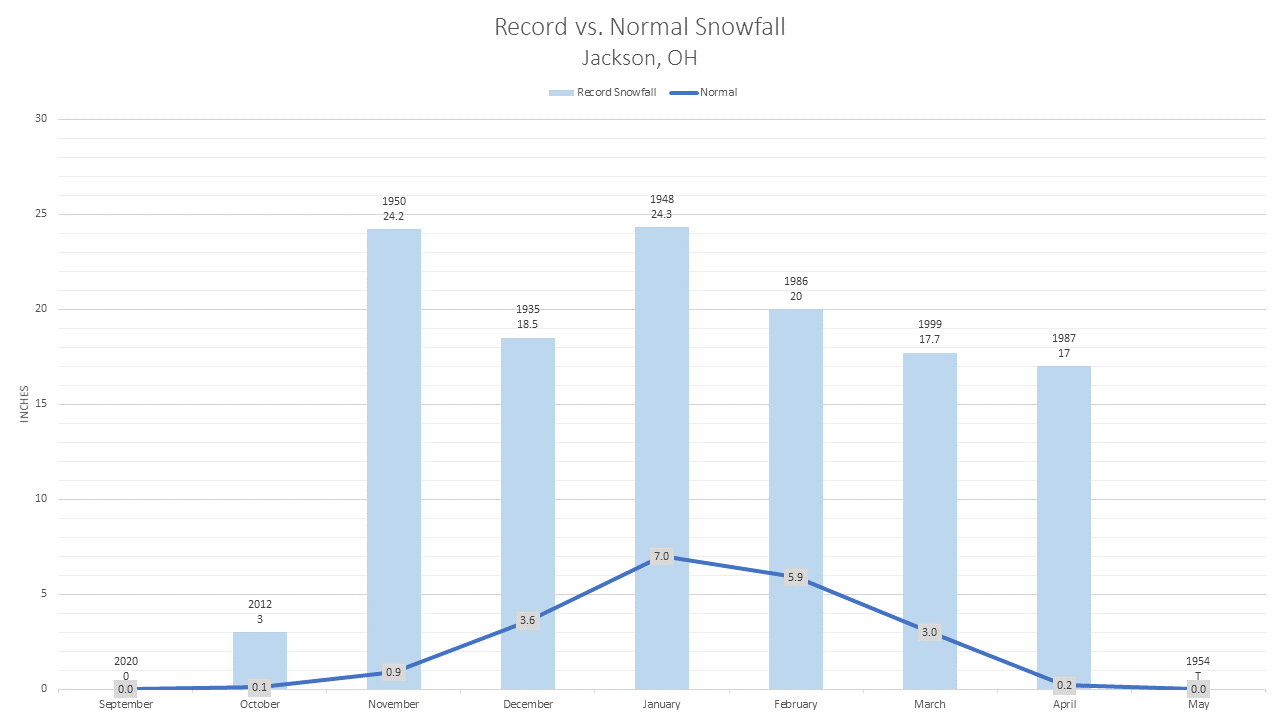
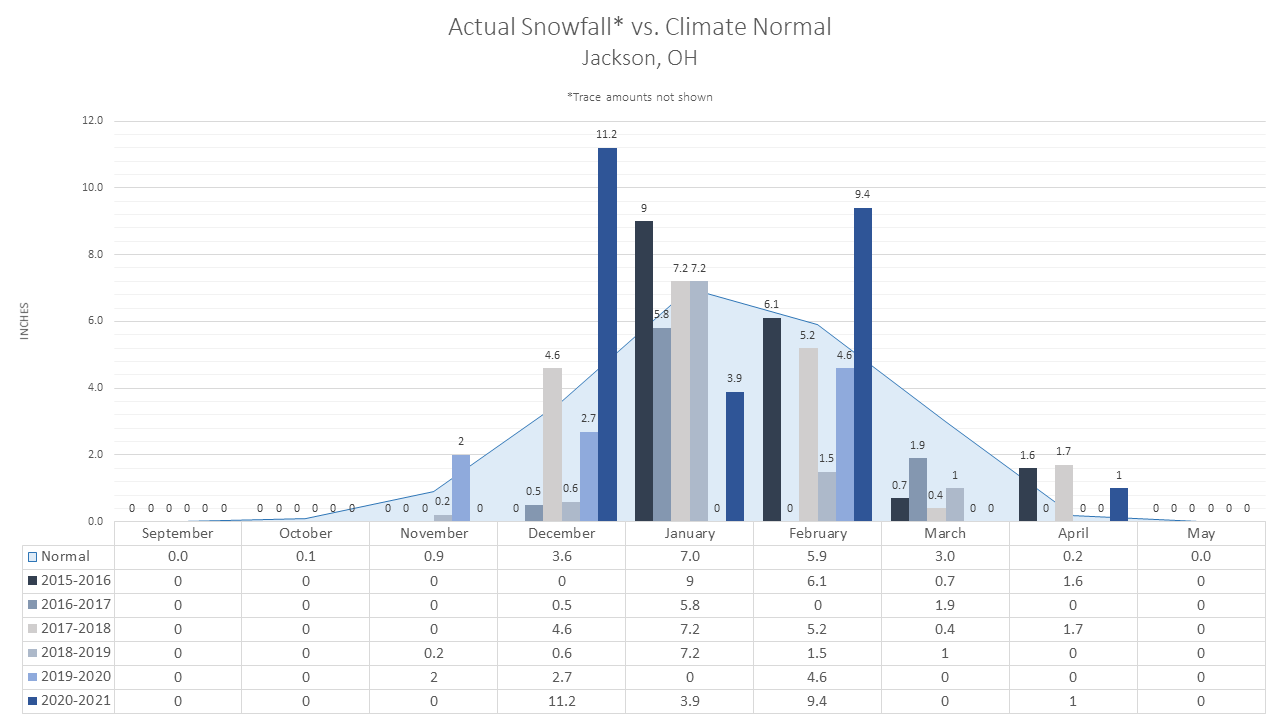
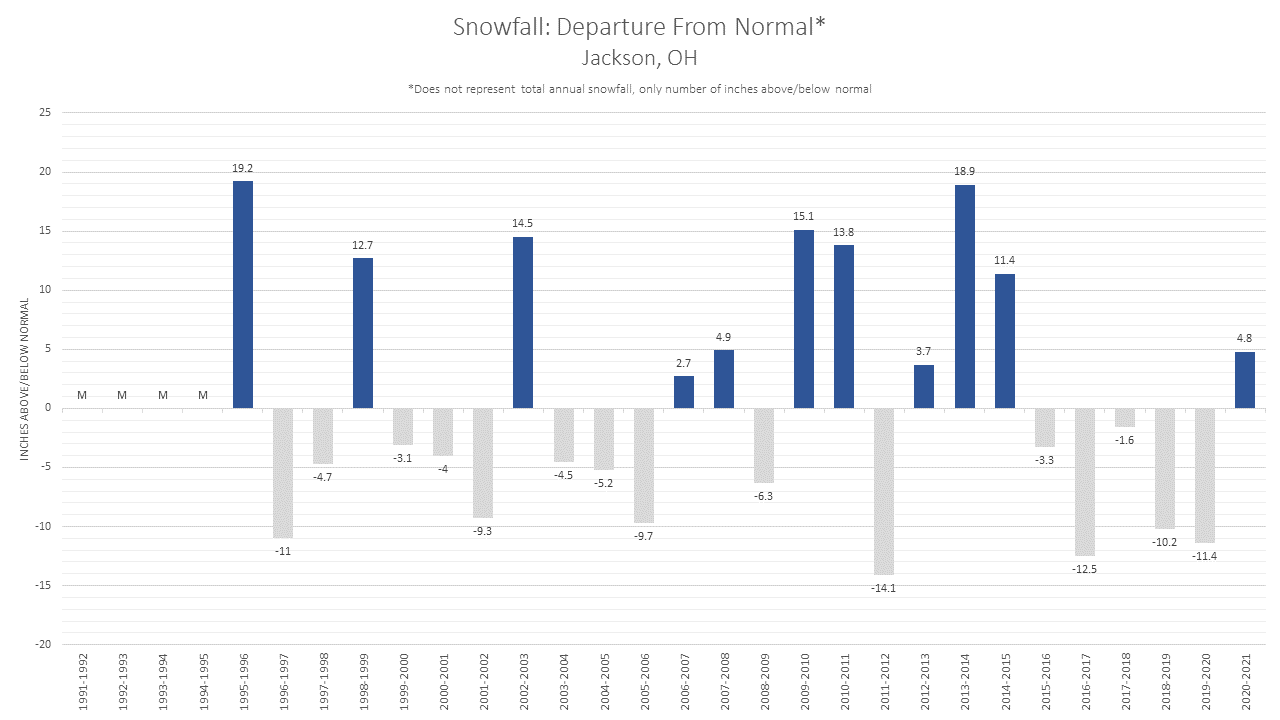
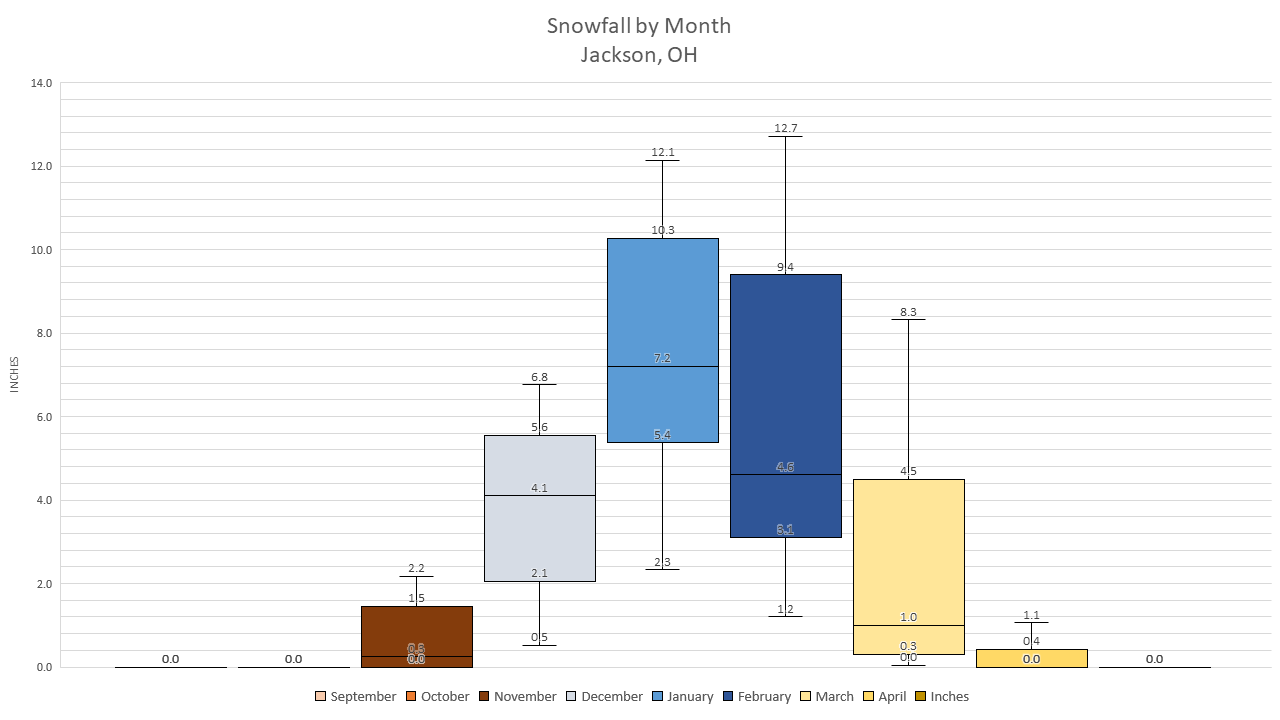
Jackson, OH |
||||||
|
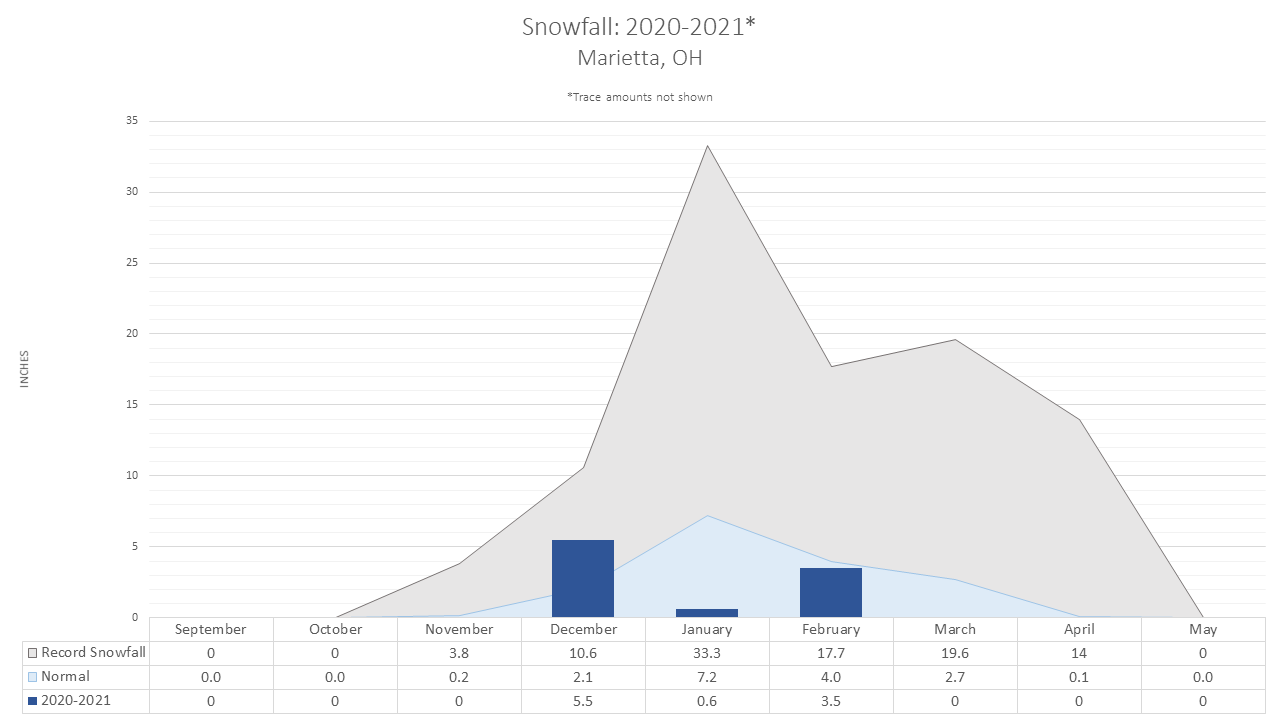
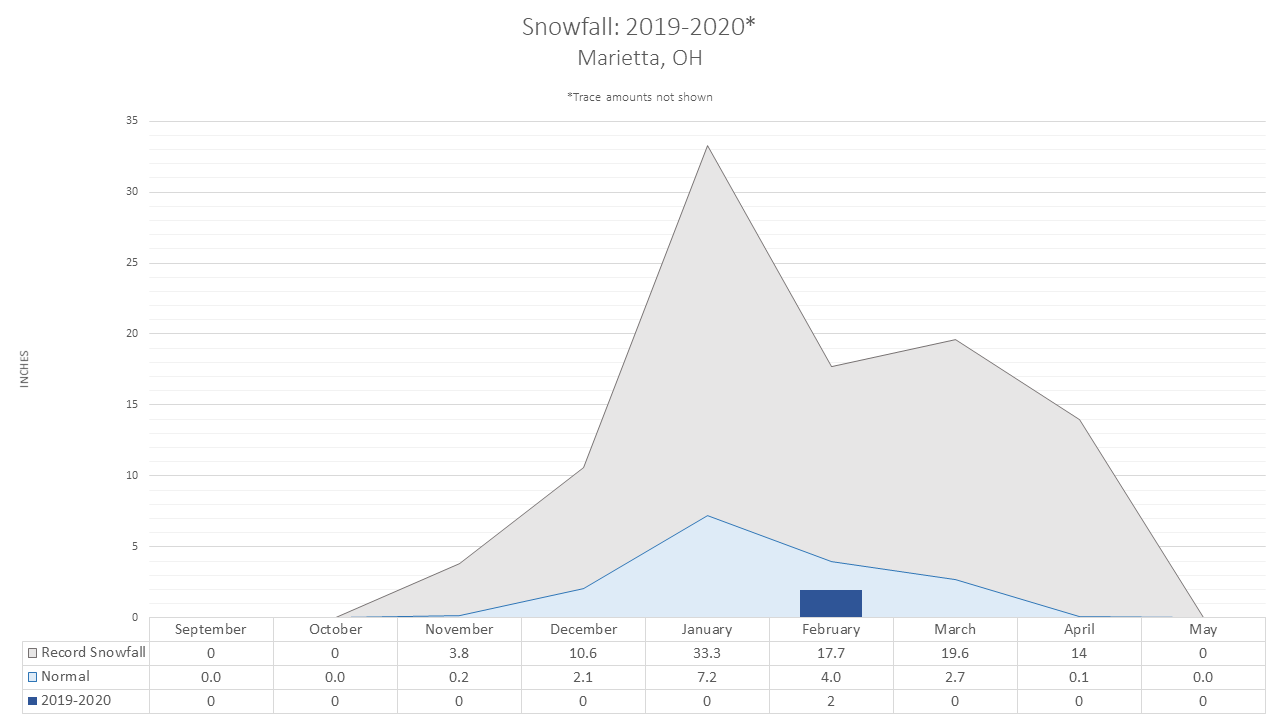
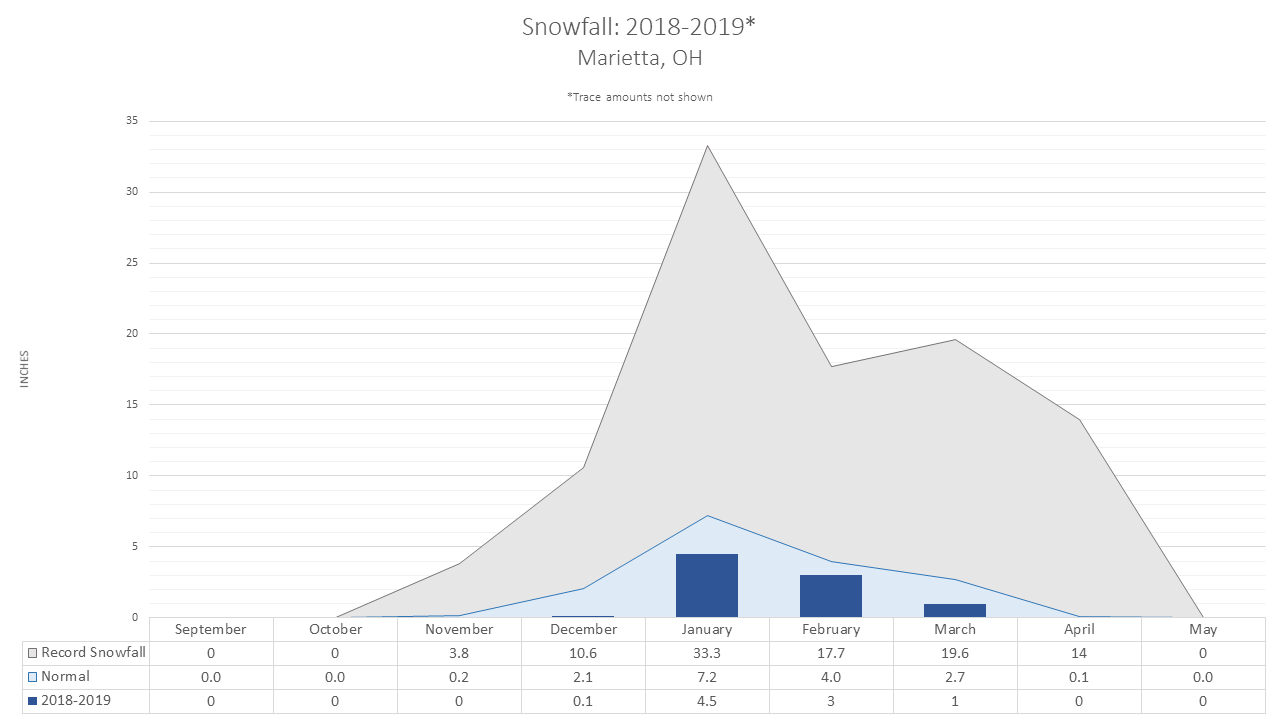
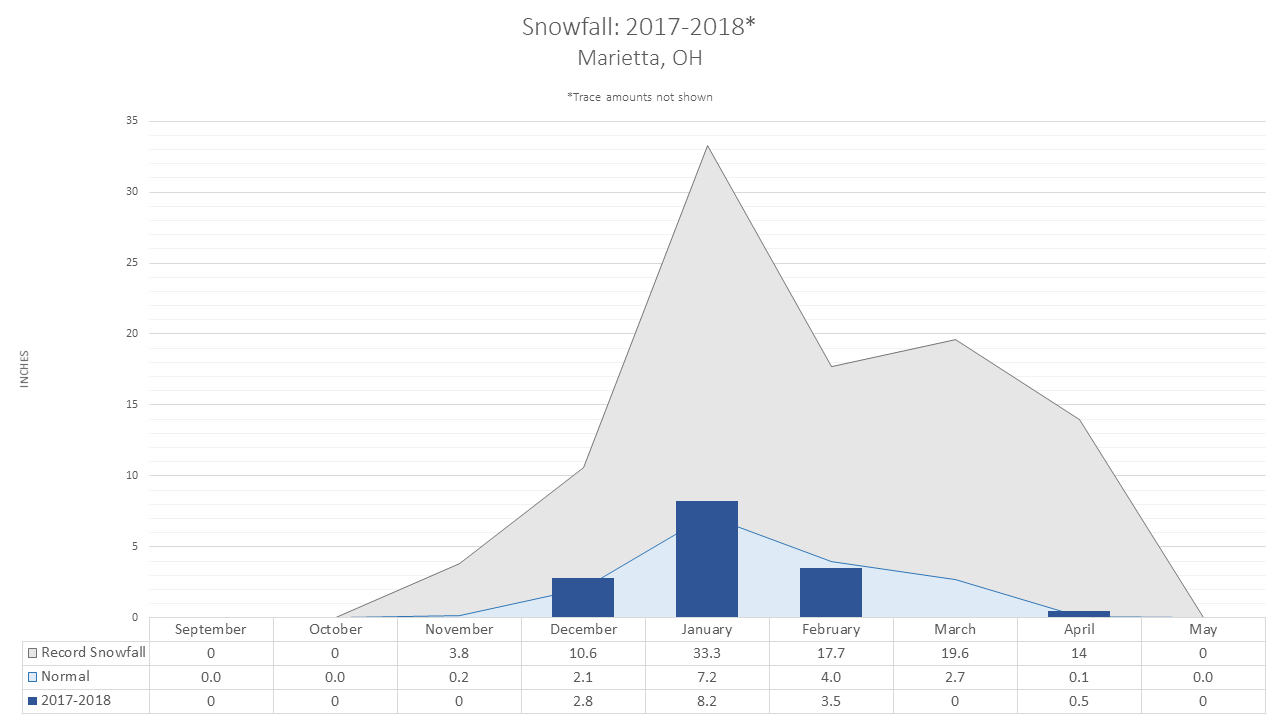
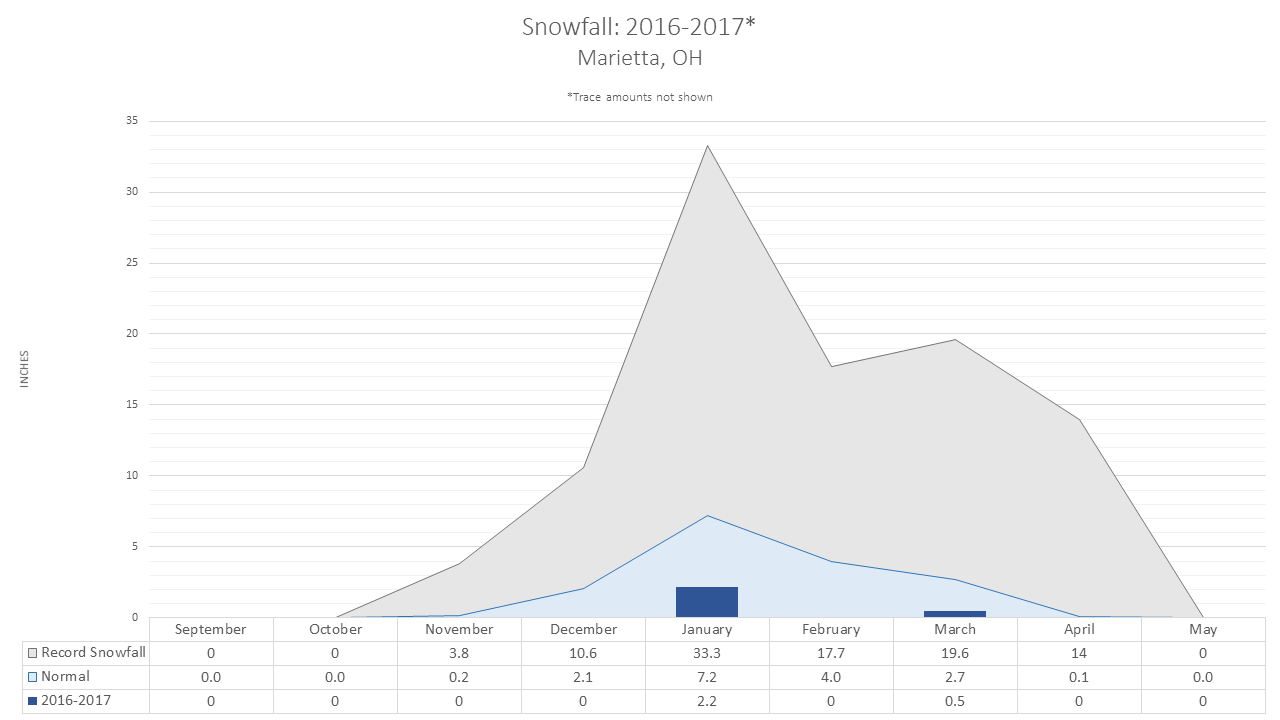
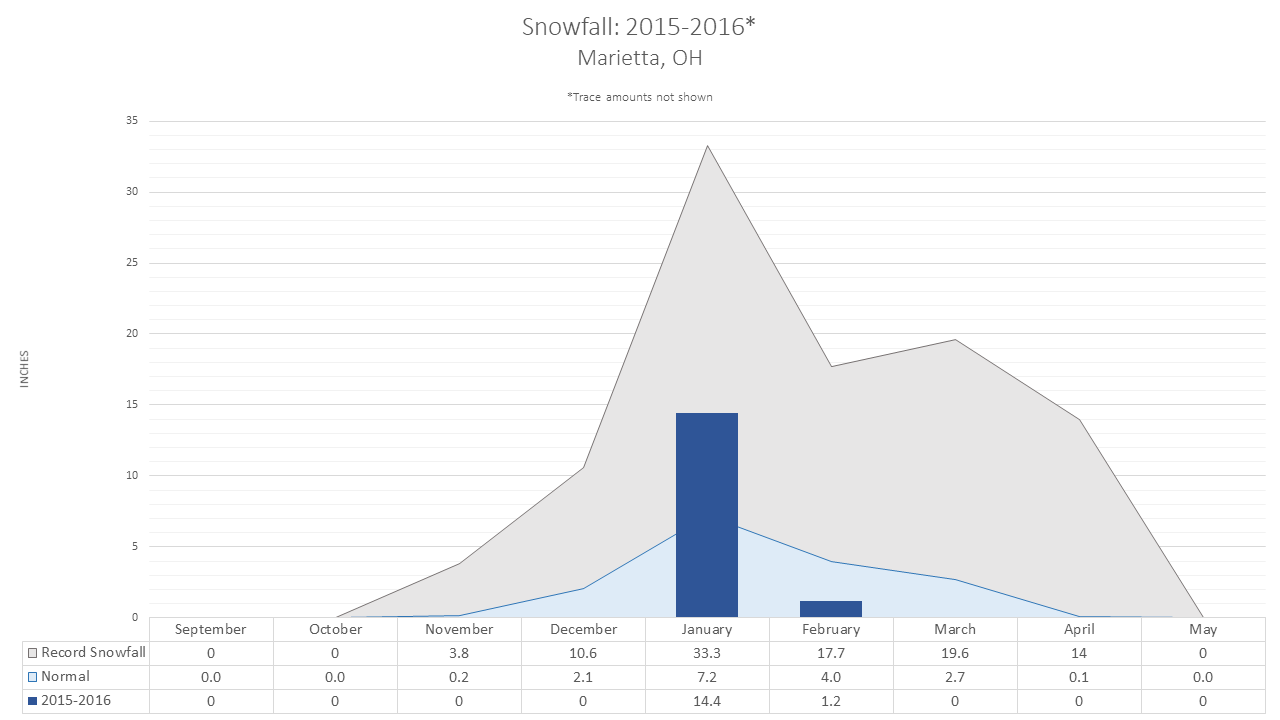
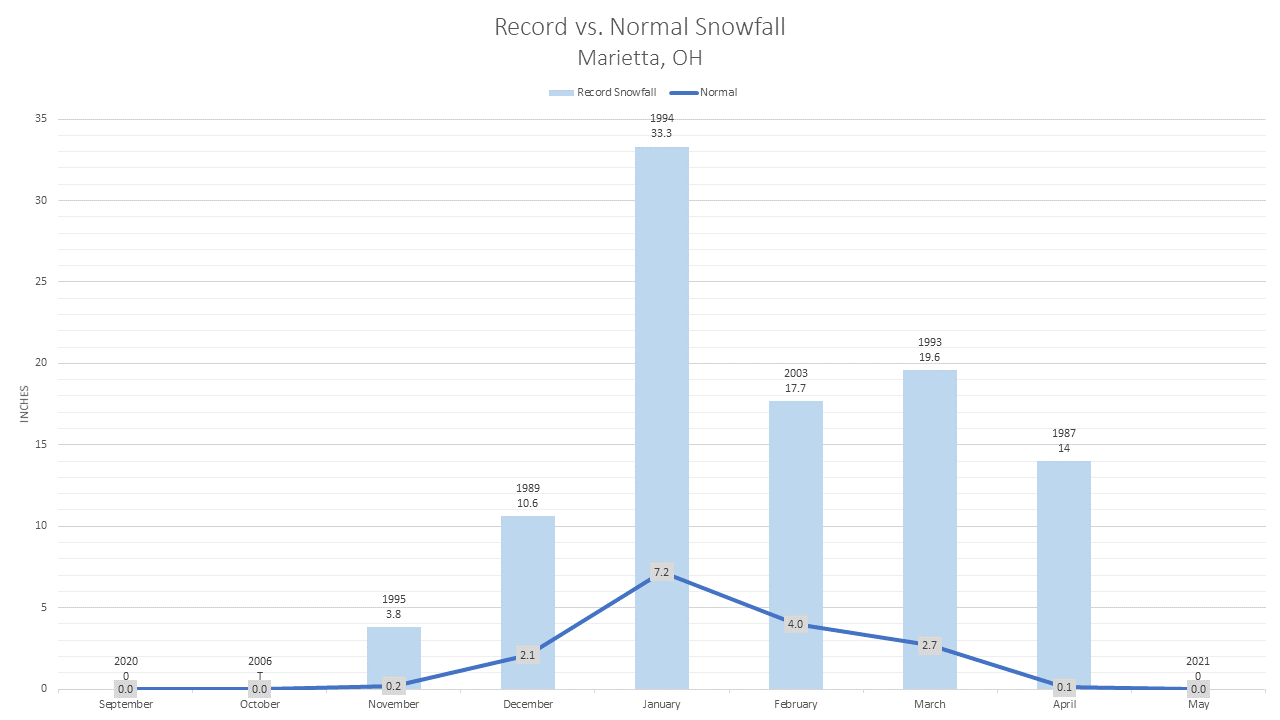
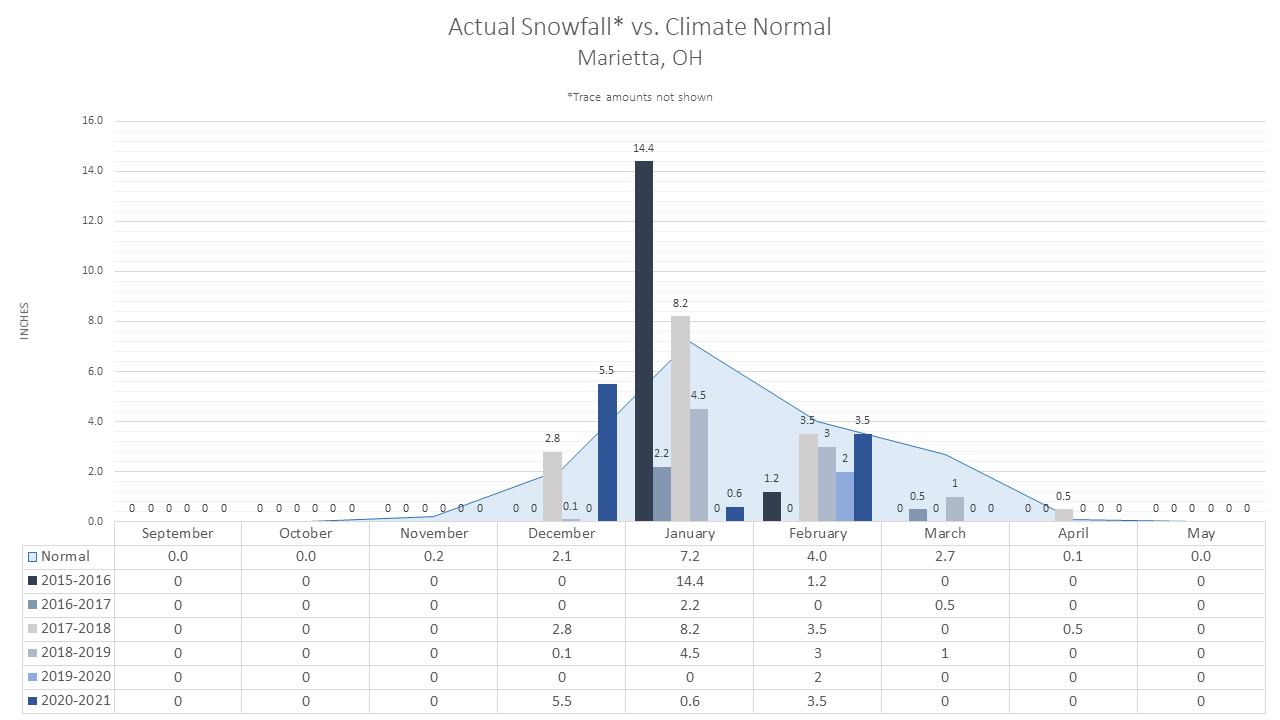
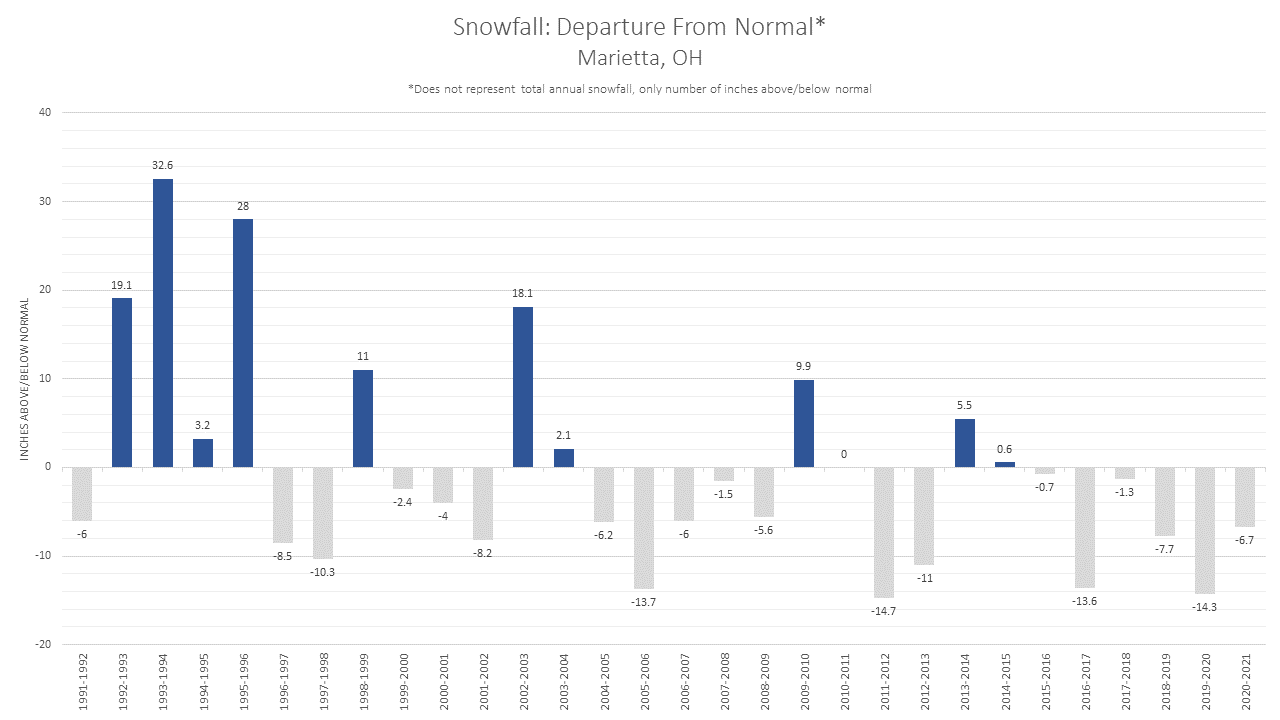
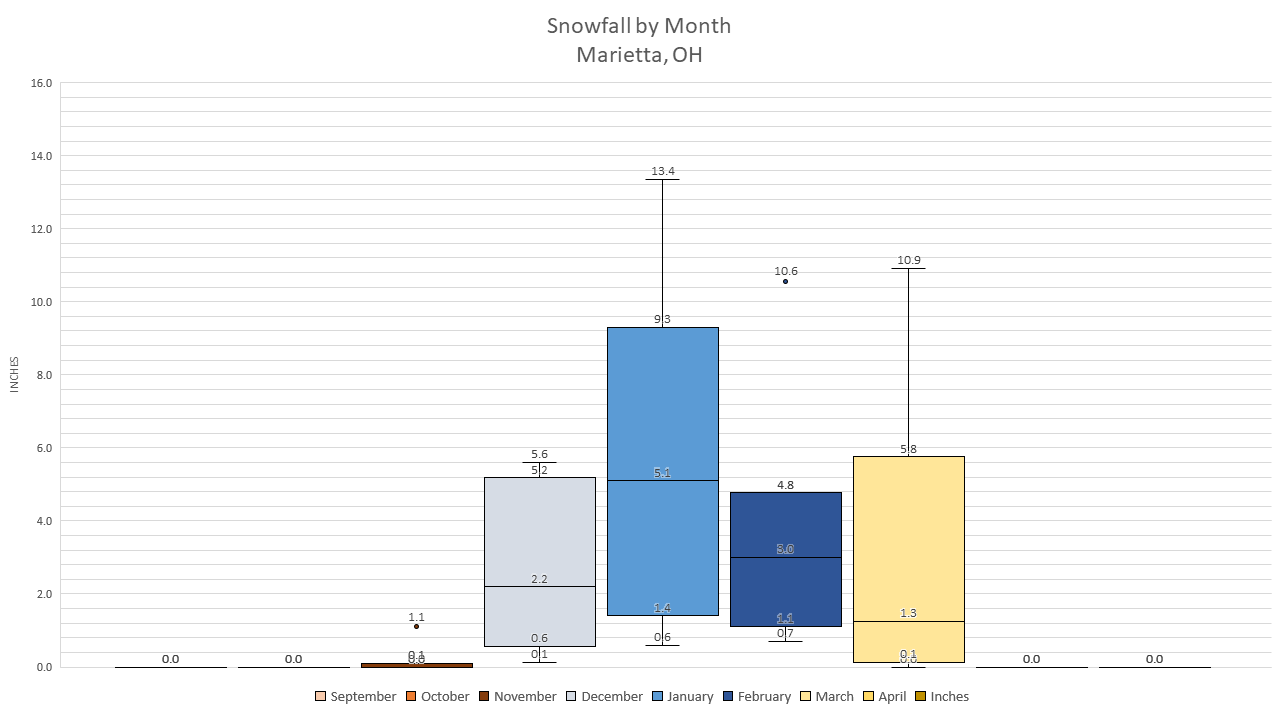
Marietta, OH |
||||||
|
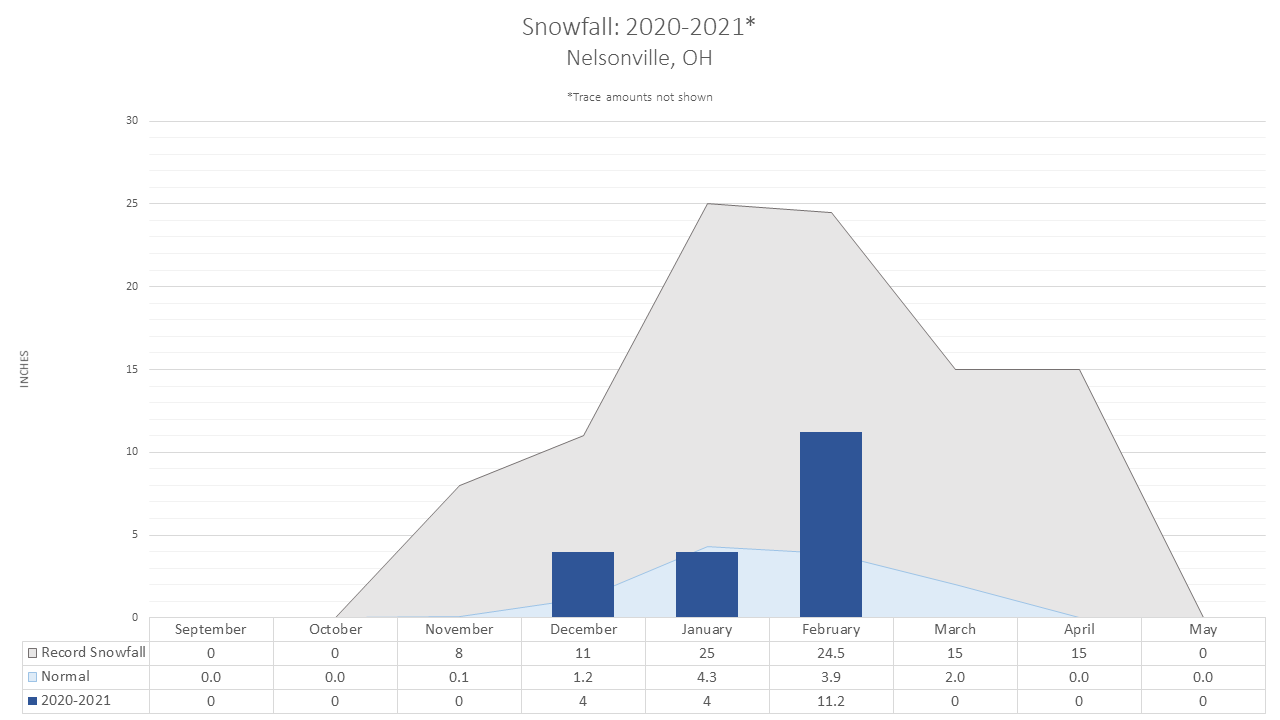
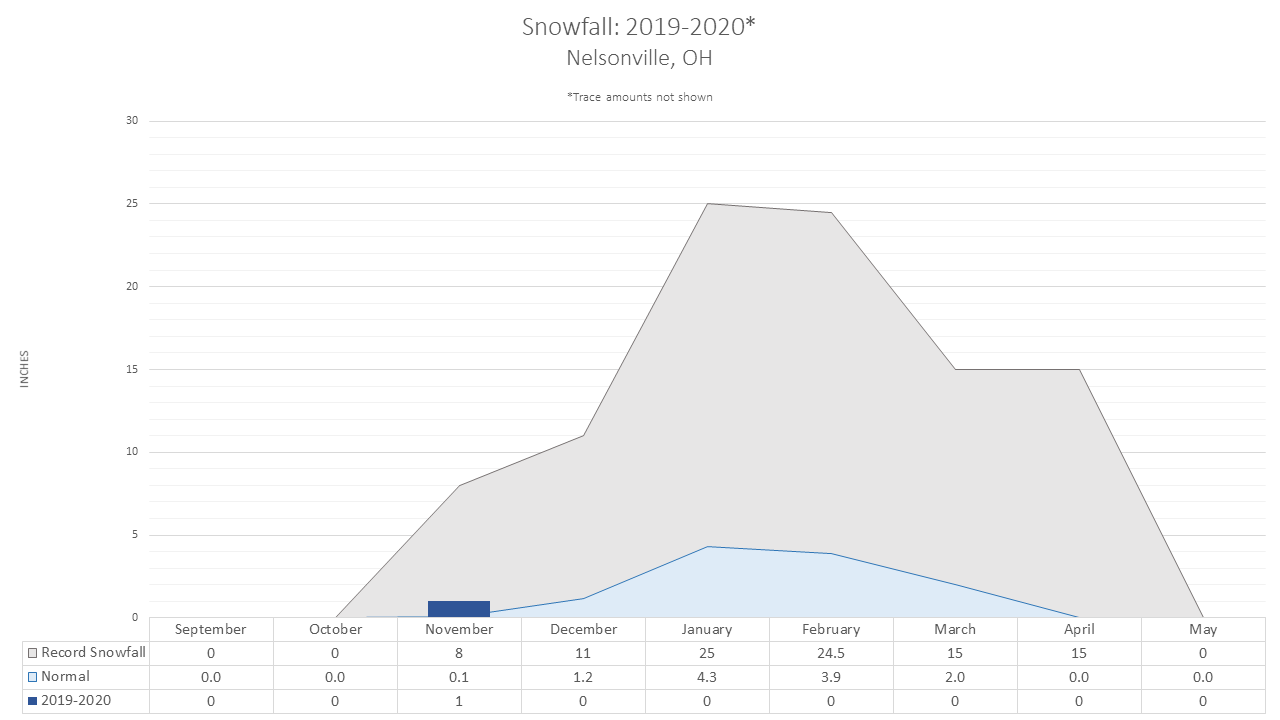
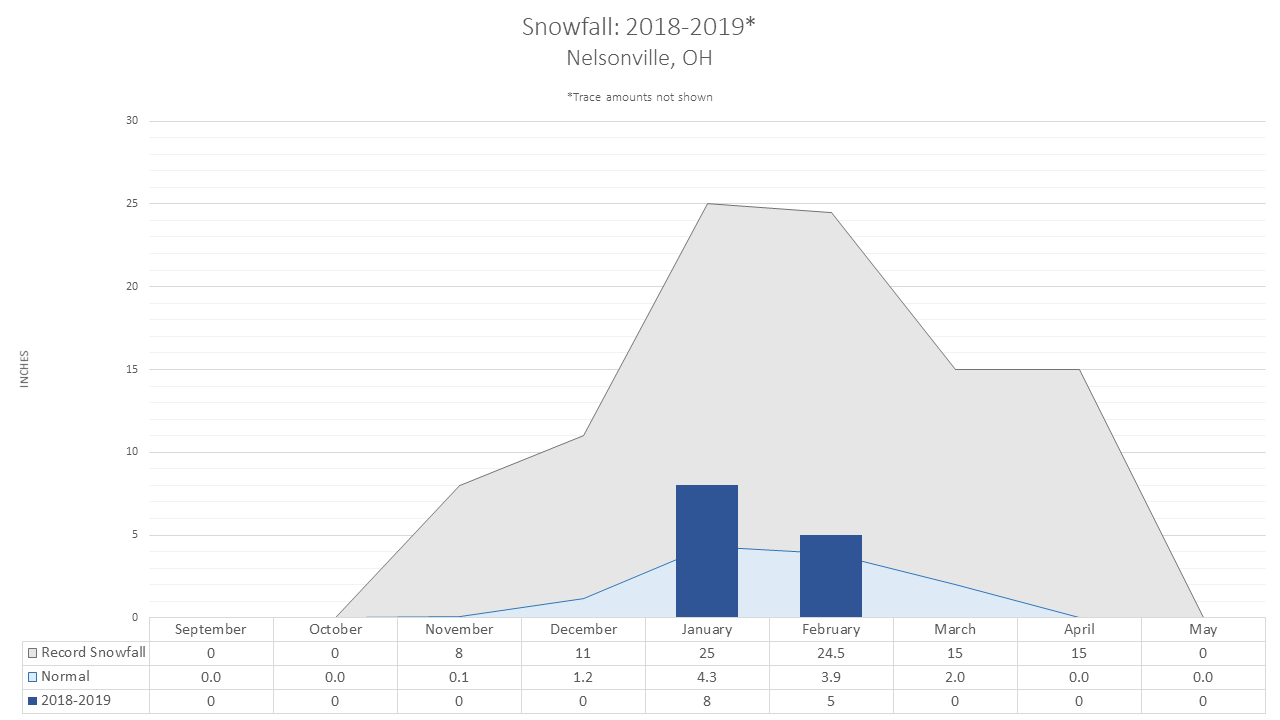
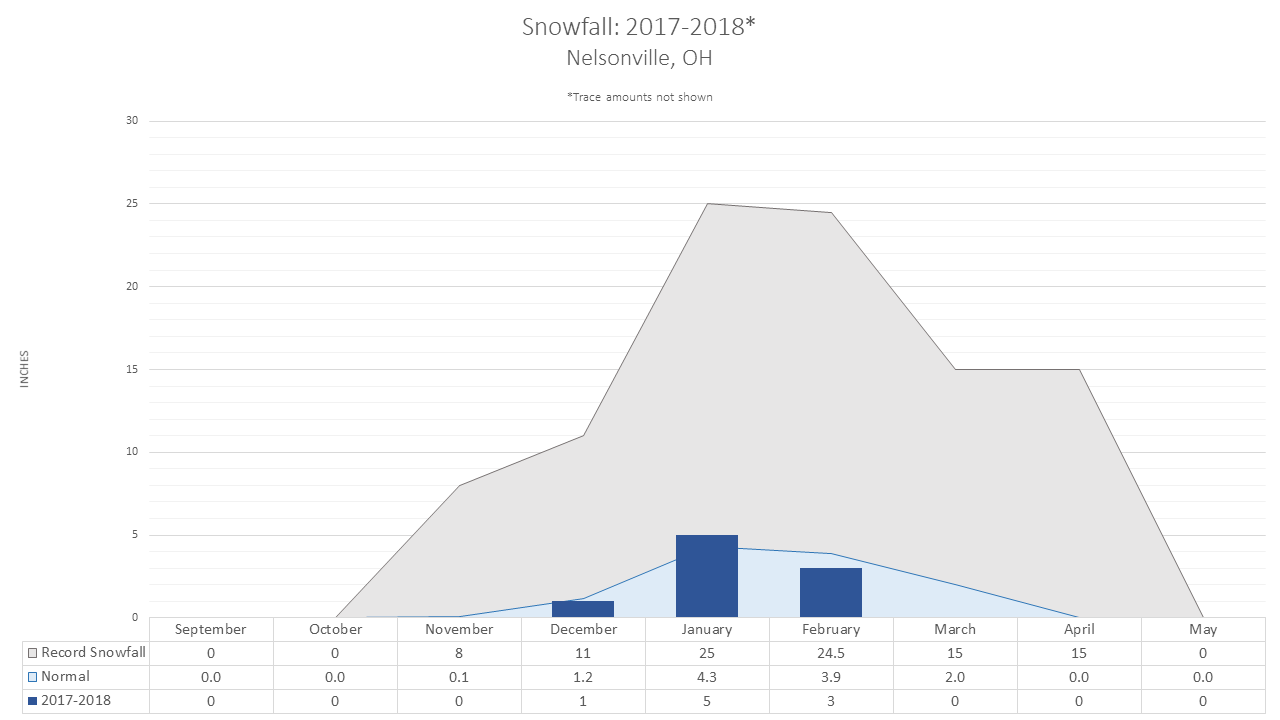
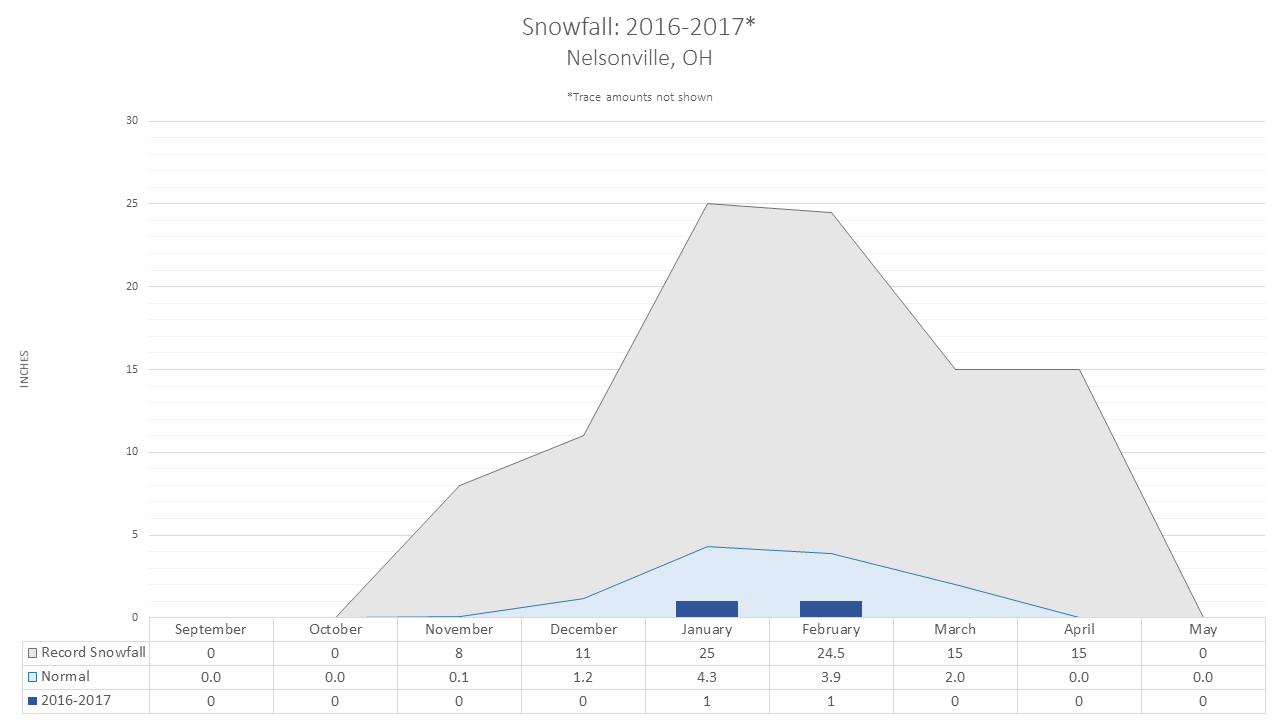
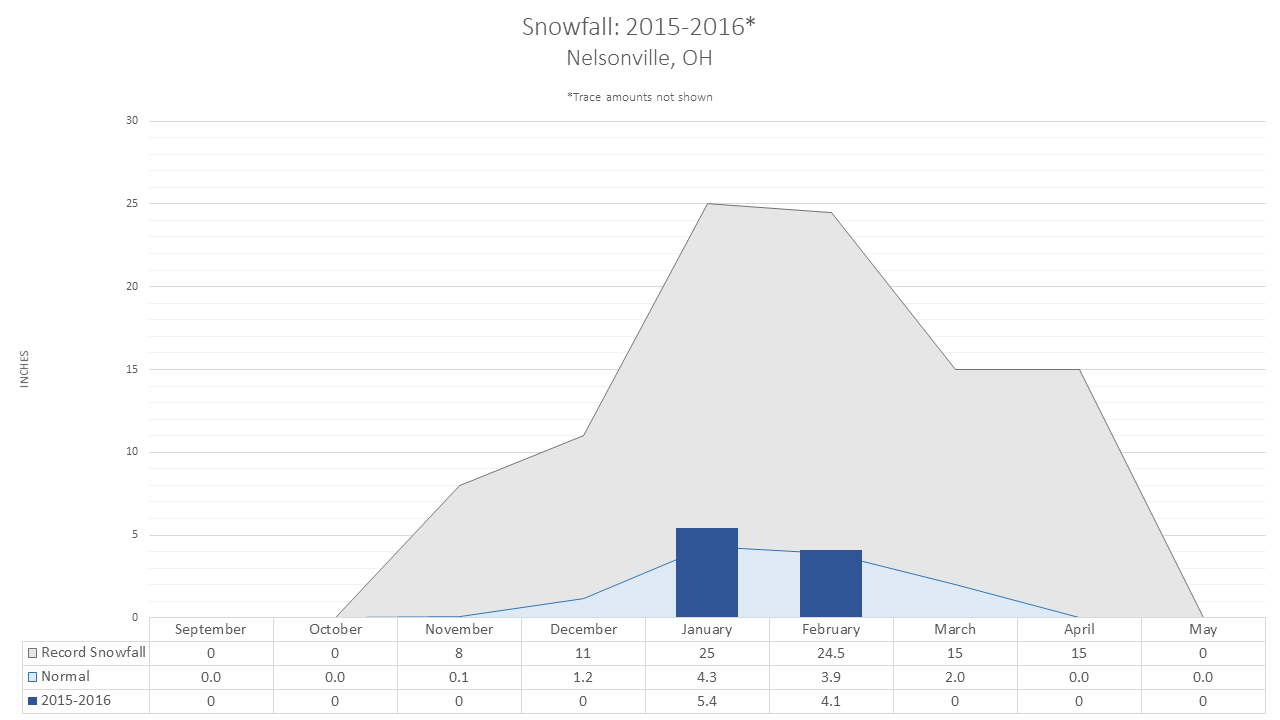
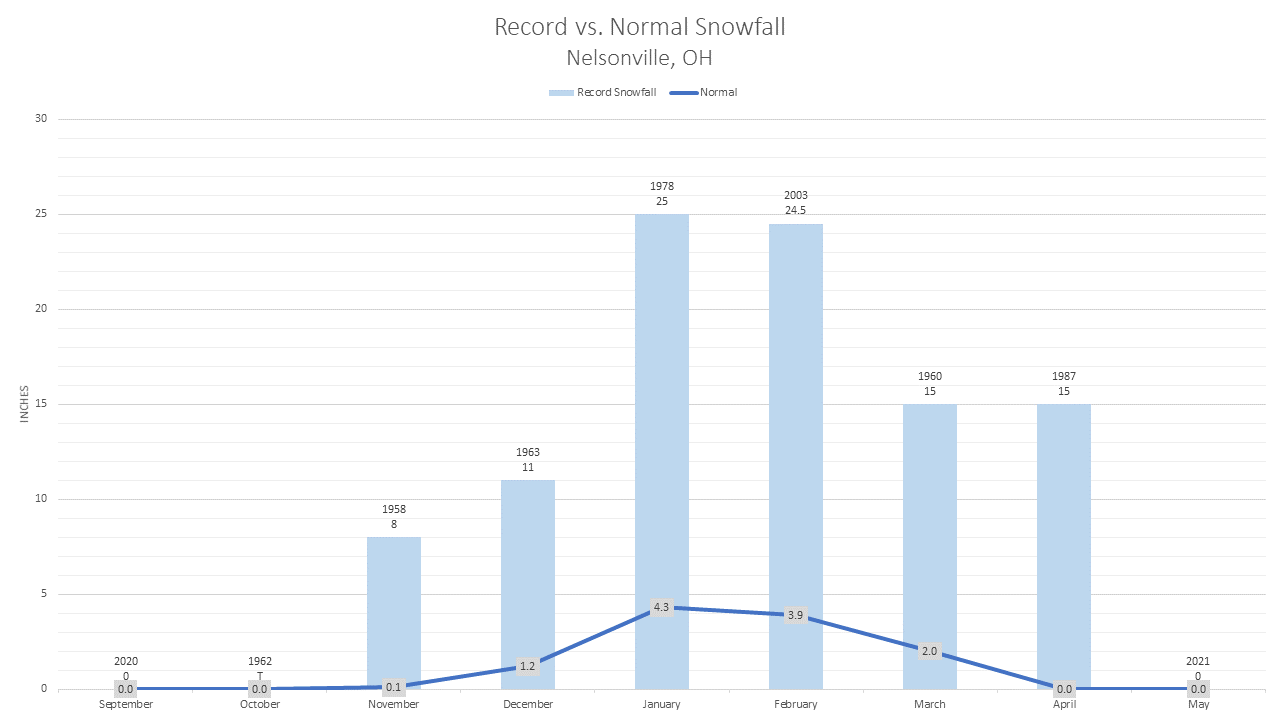
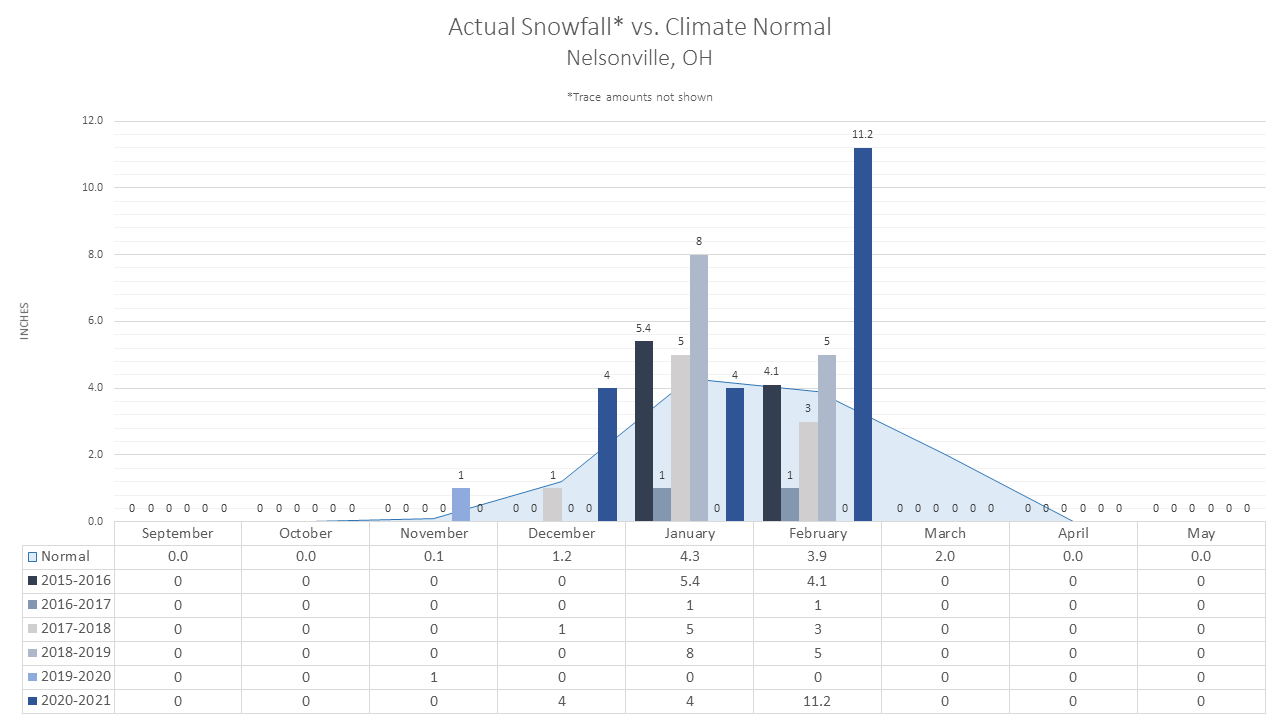
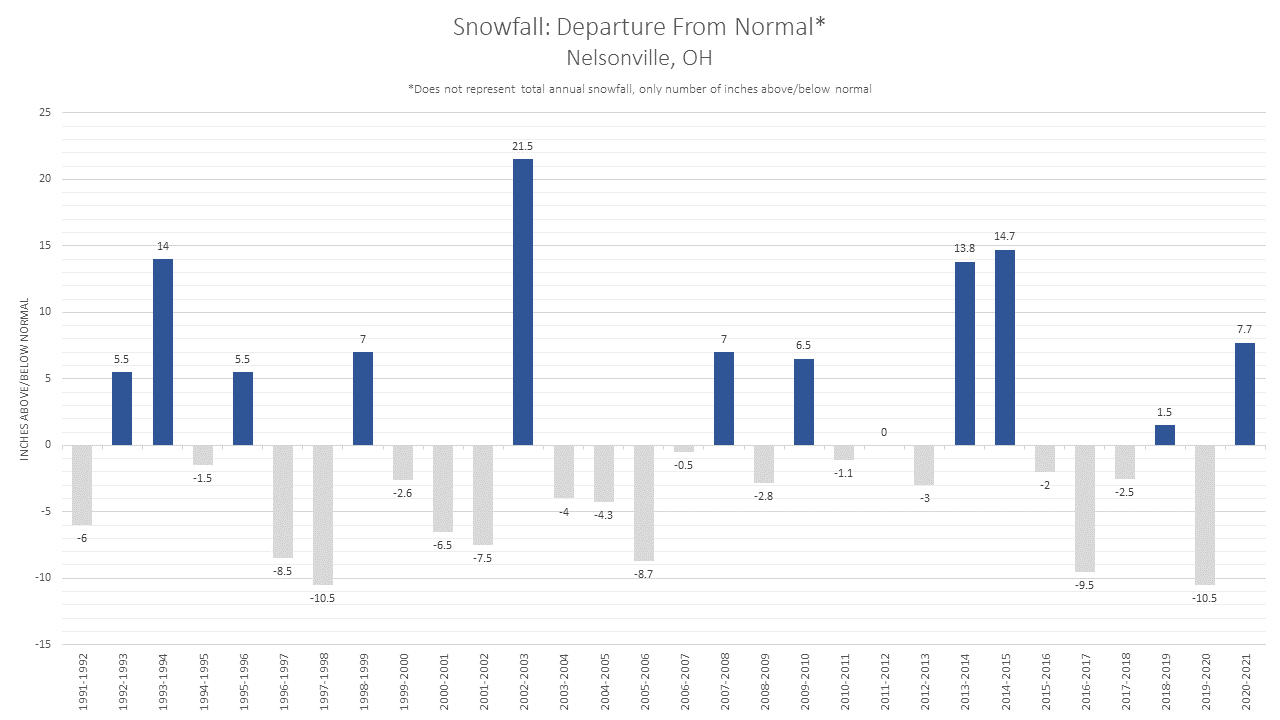
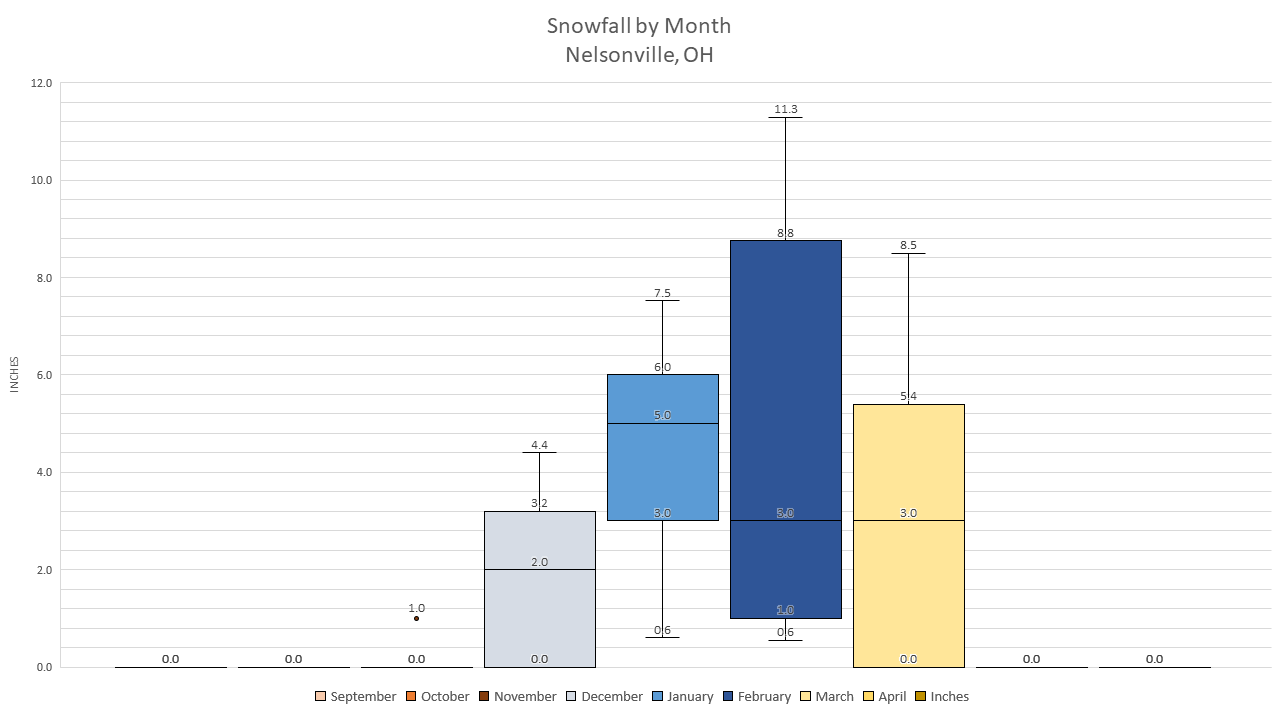
Nelsonville, OH |
||||||
|
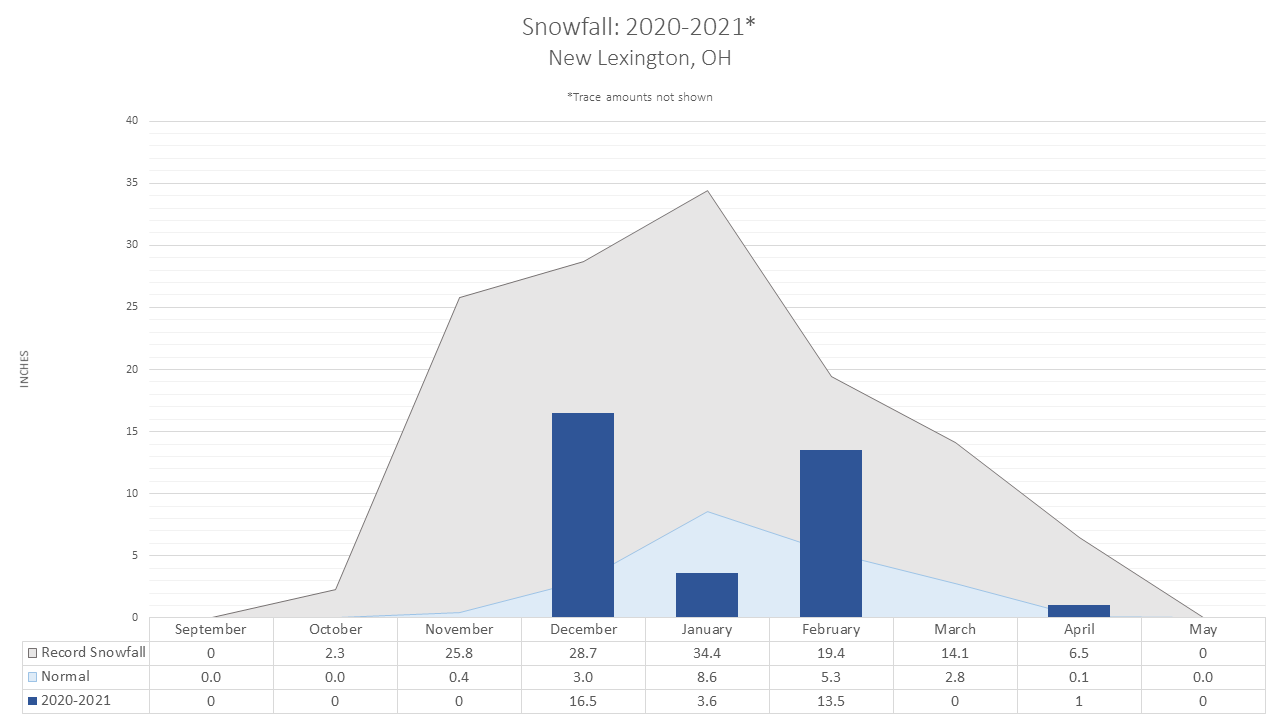
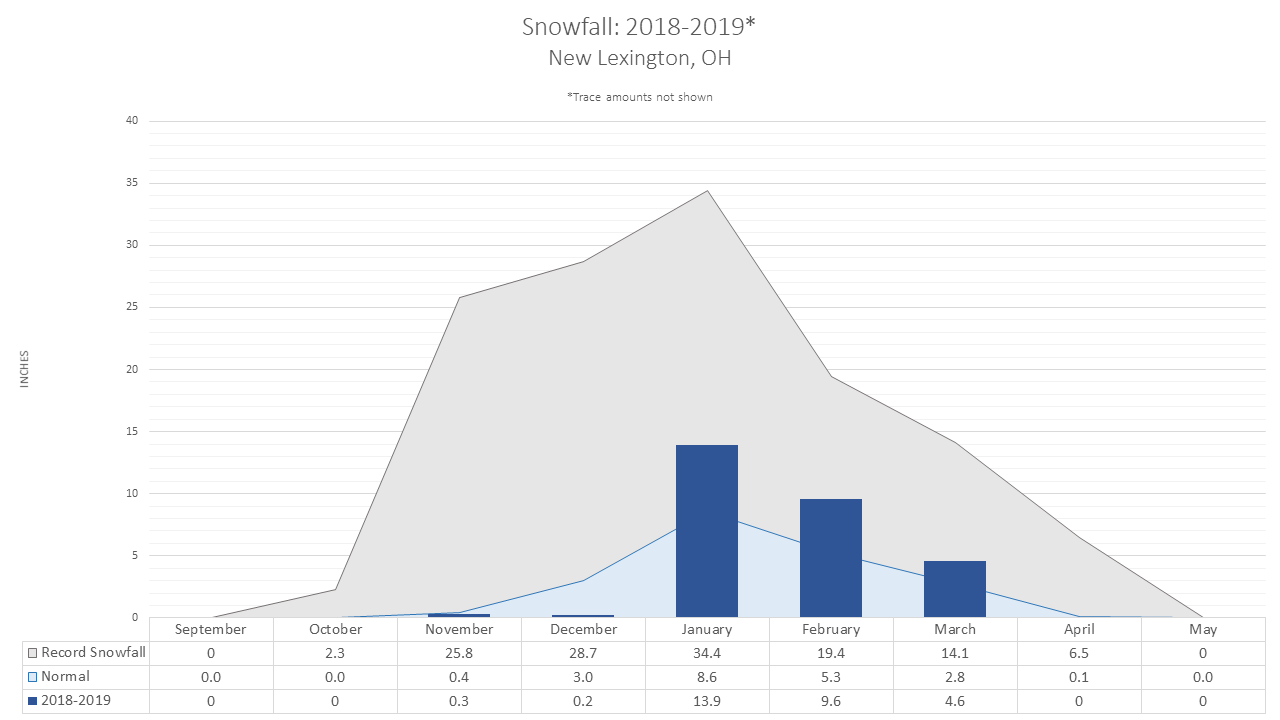
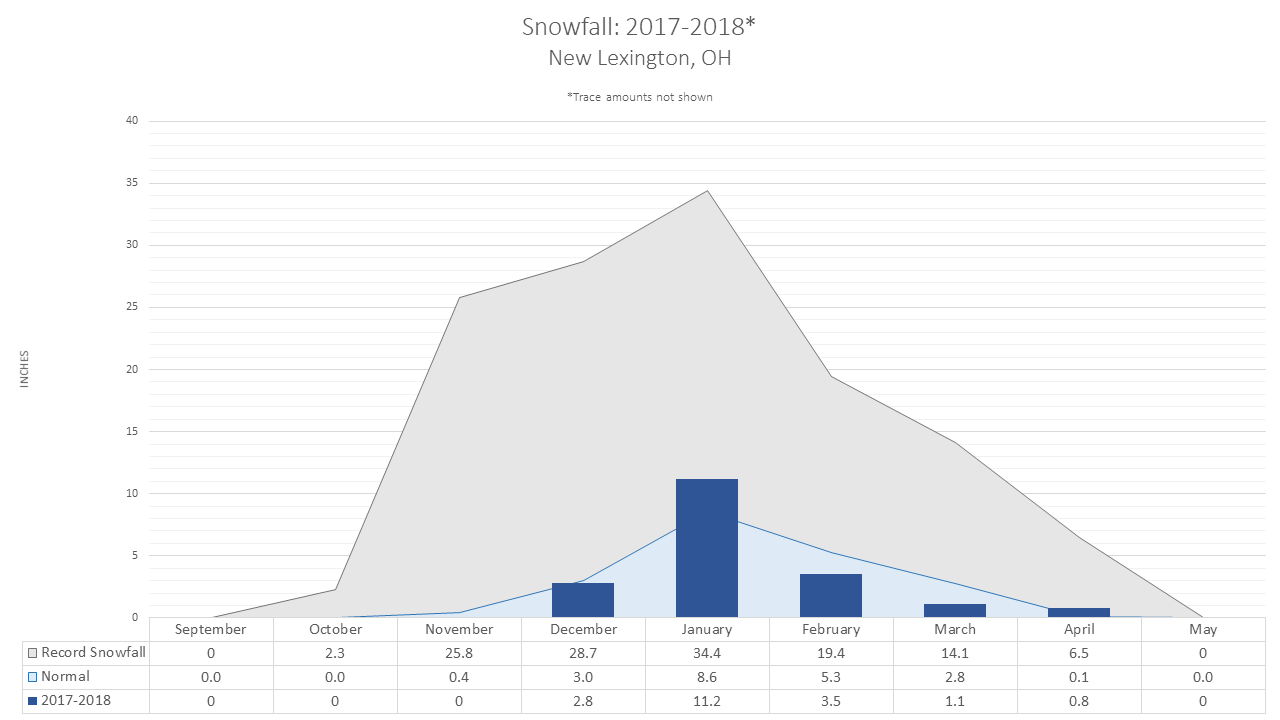
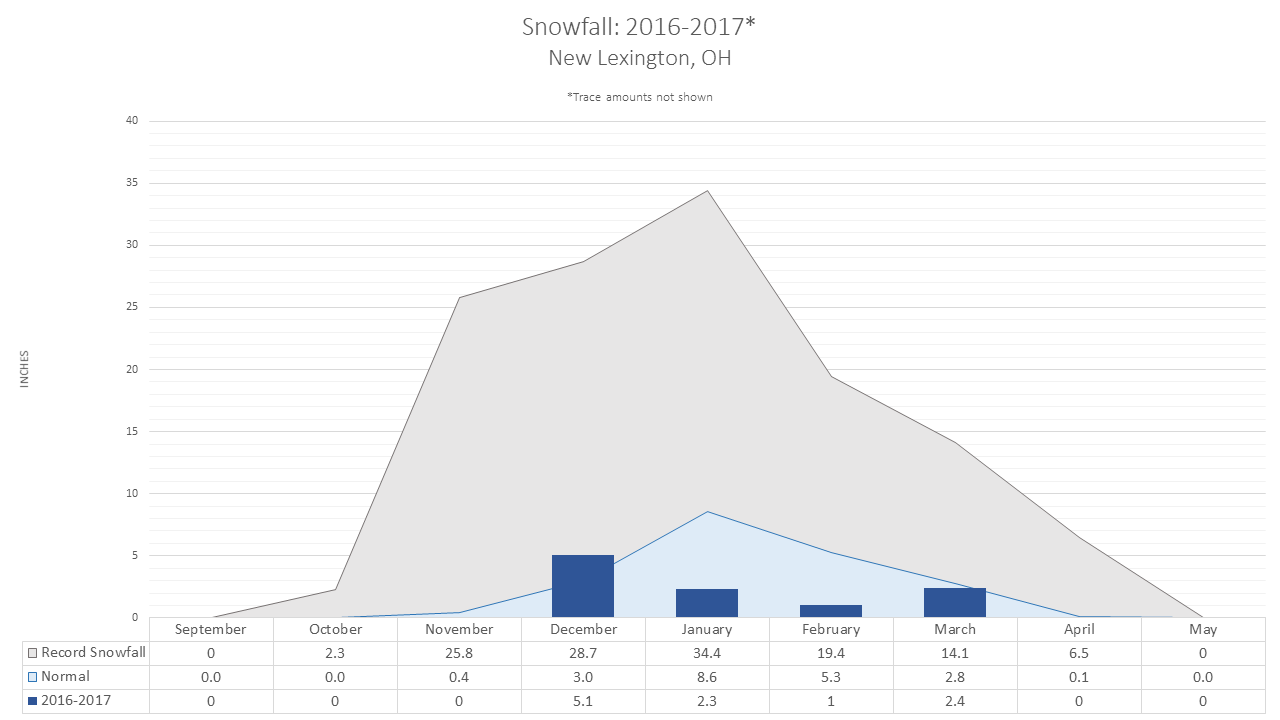
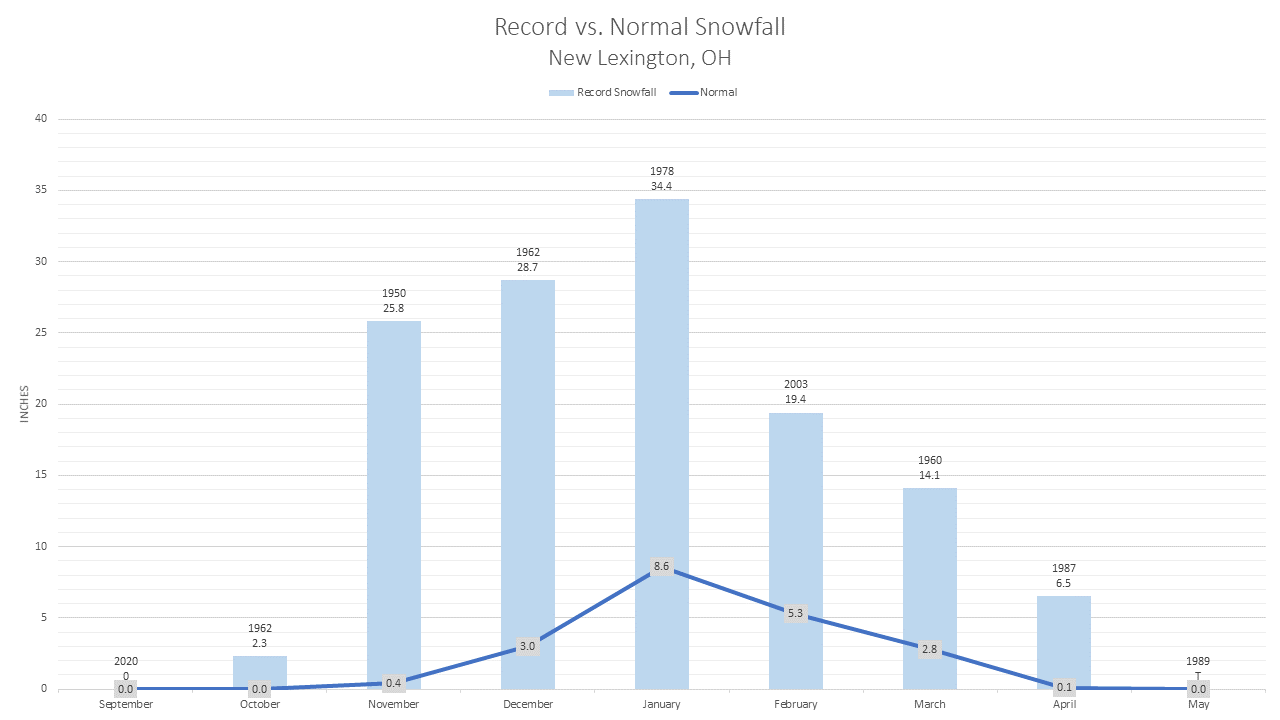
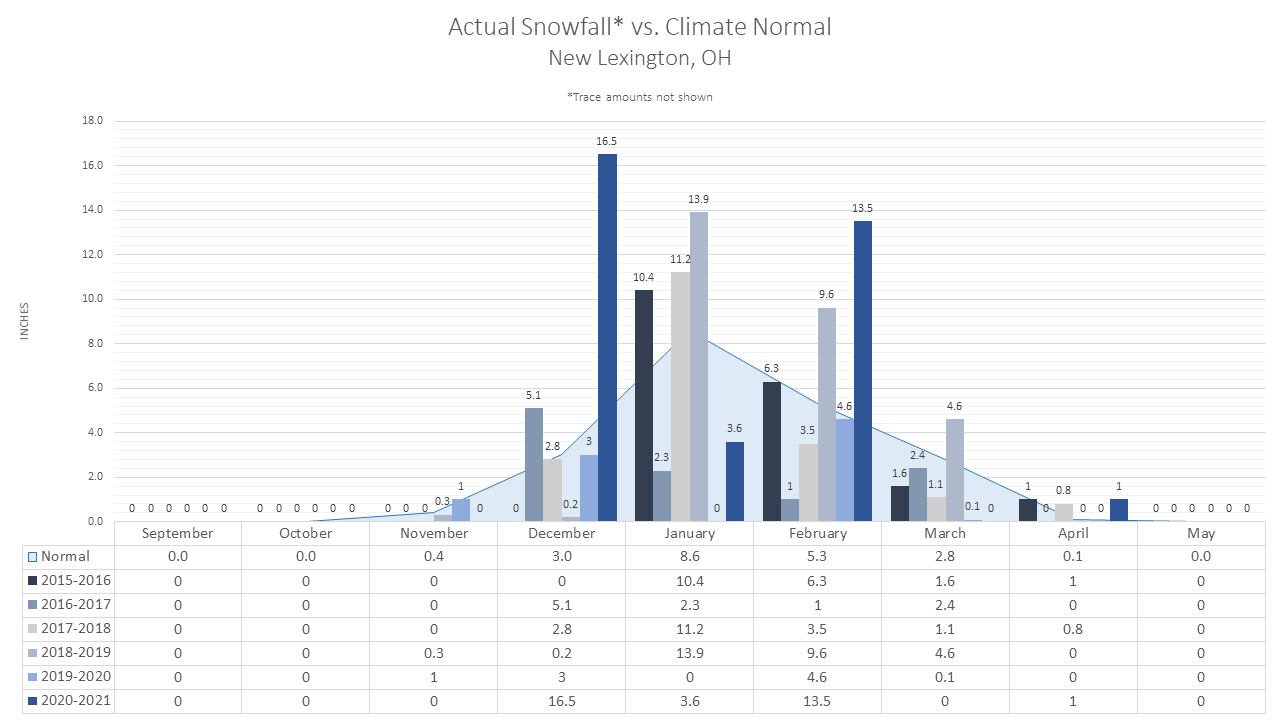
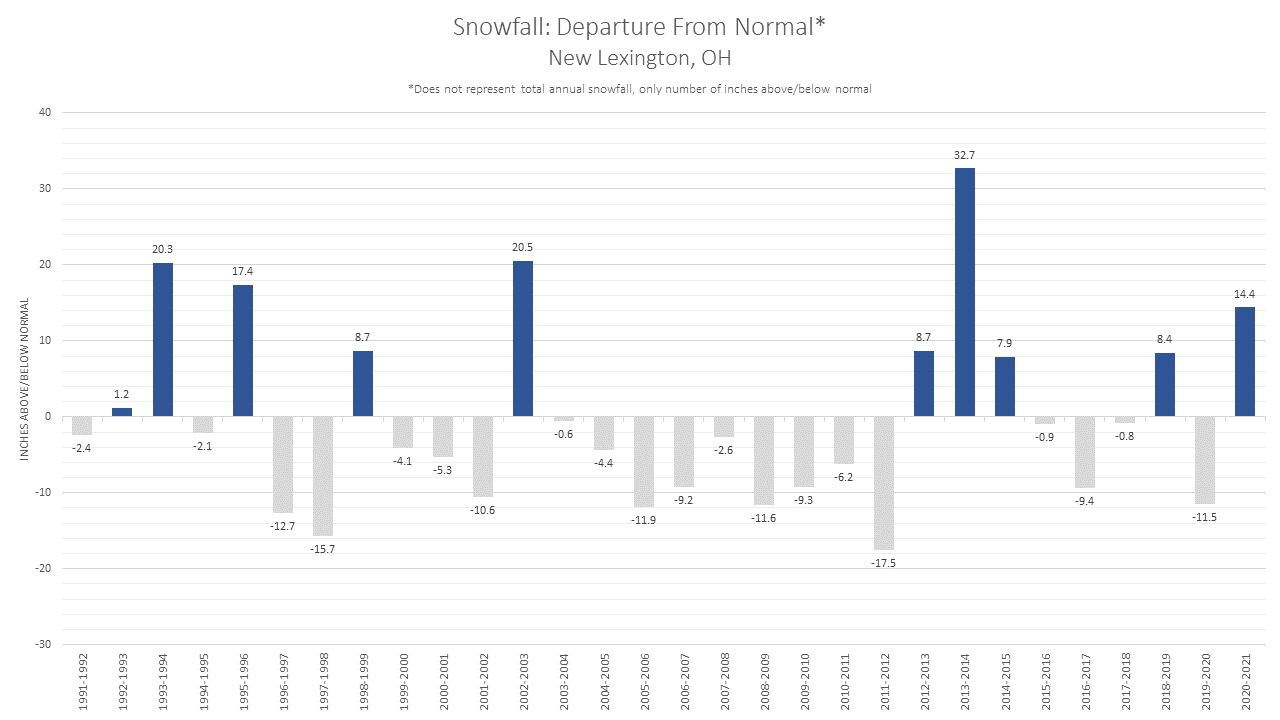
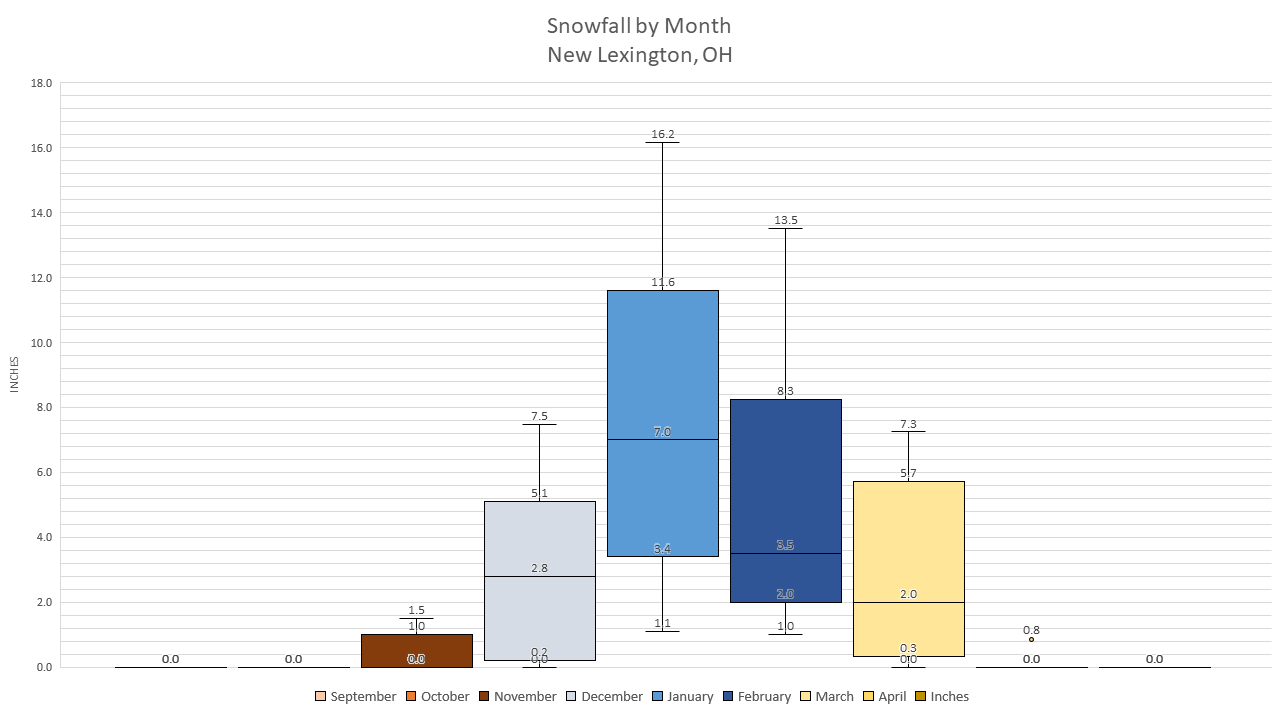
New Lexington, OH |
||||||
|
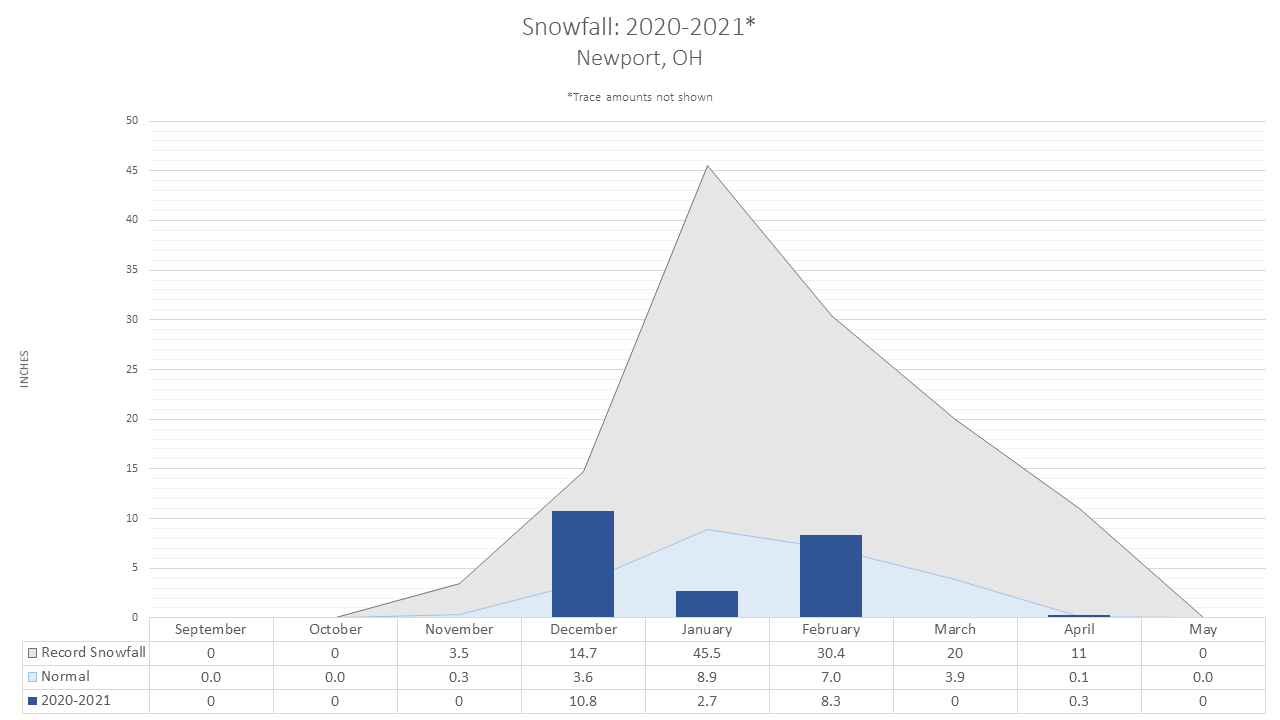
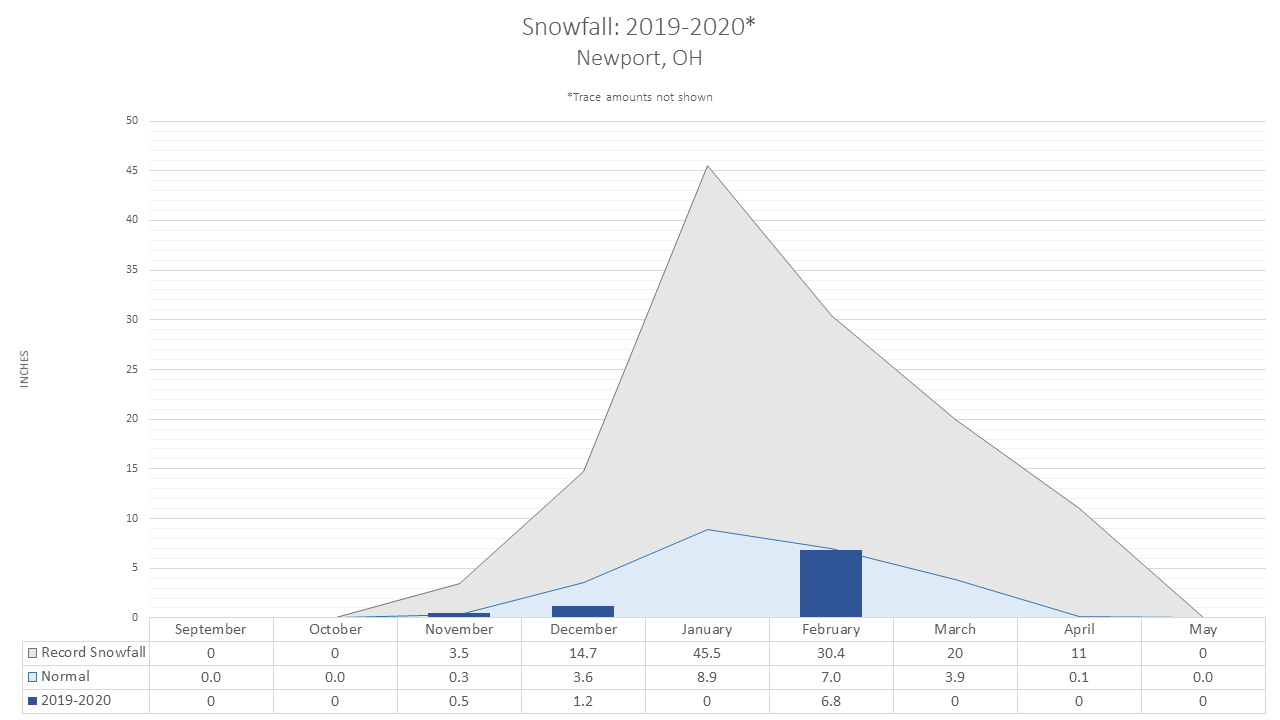
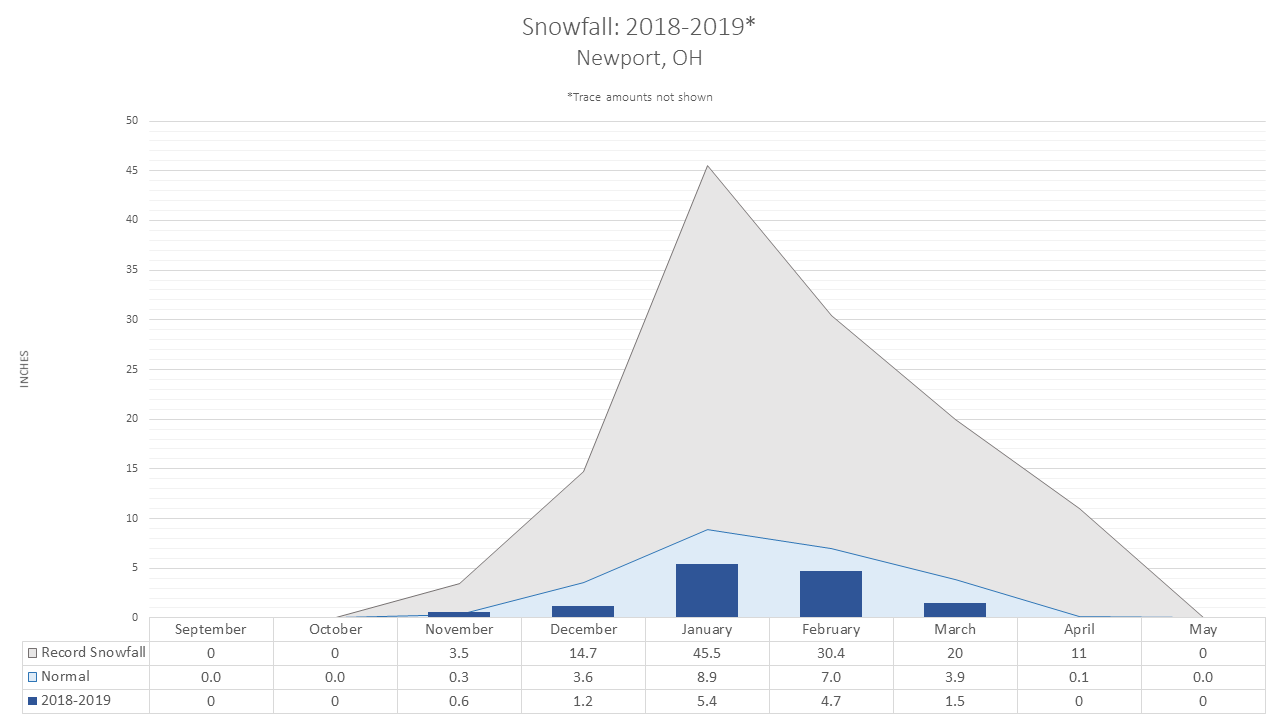
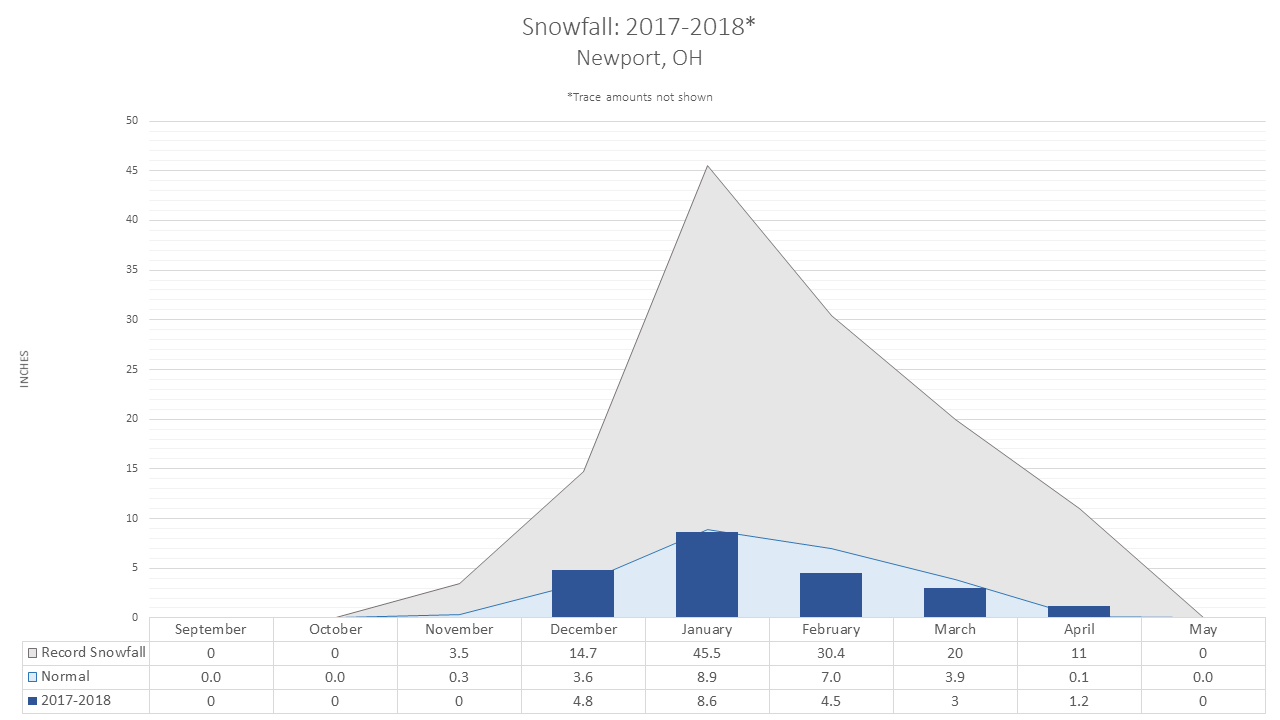
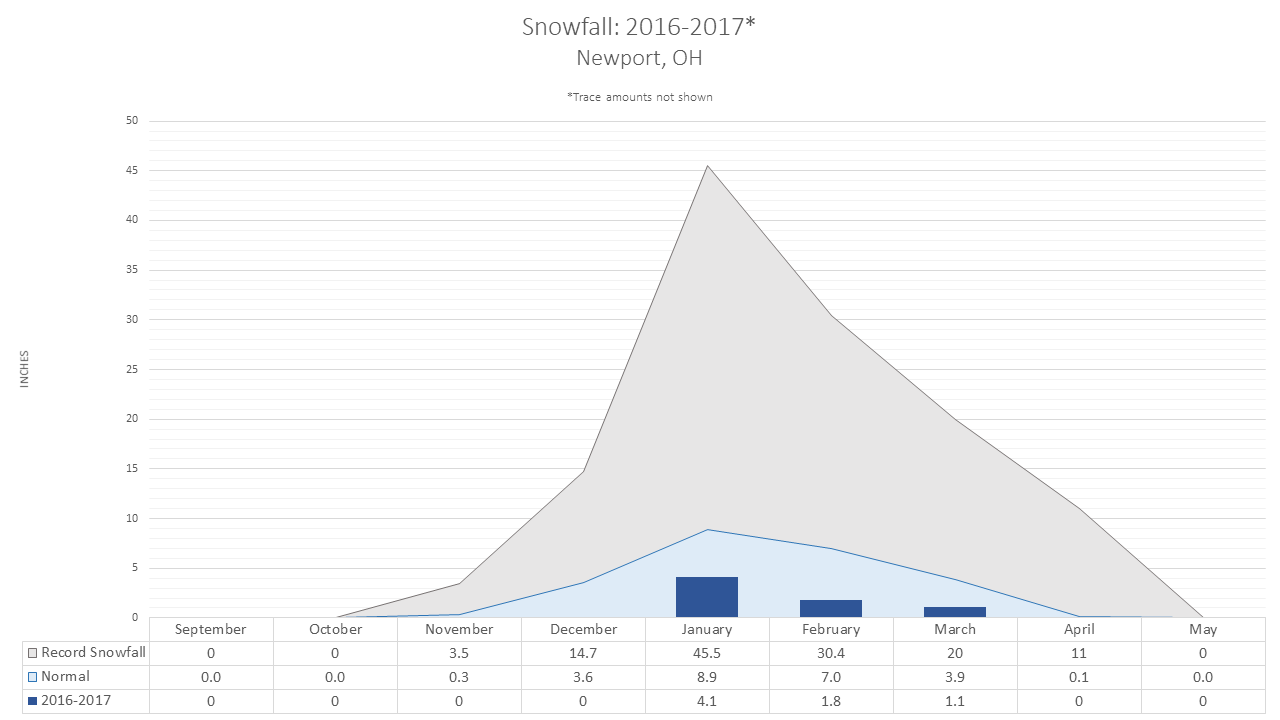
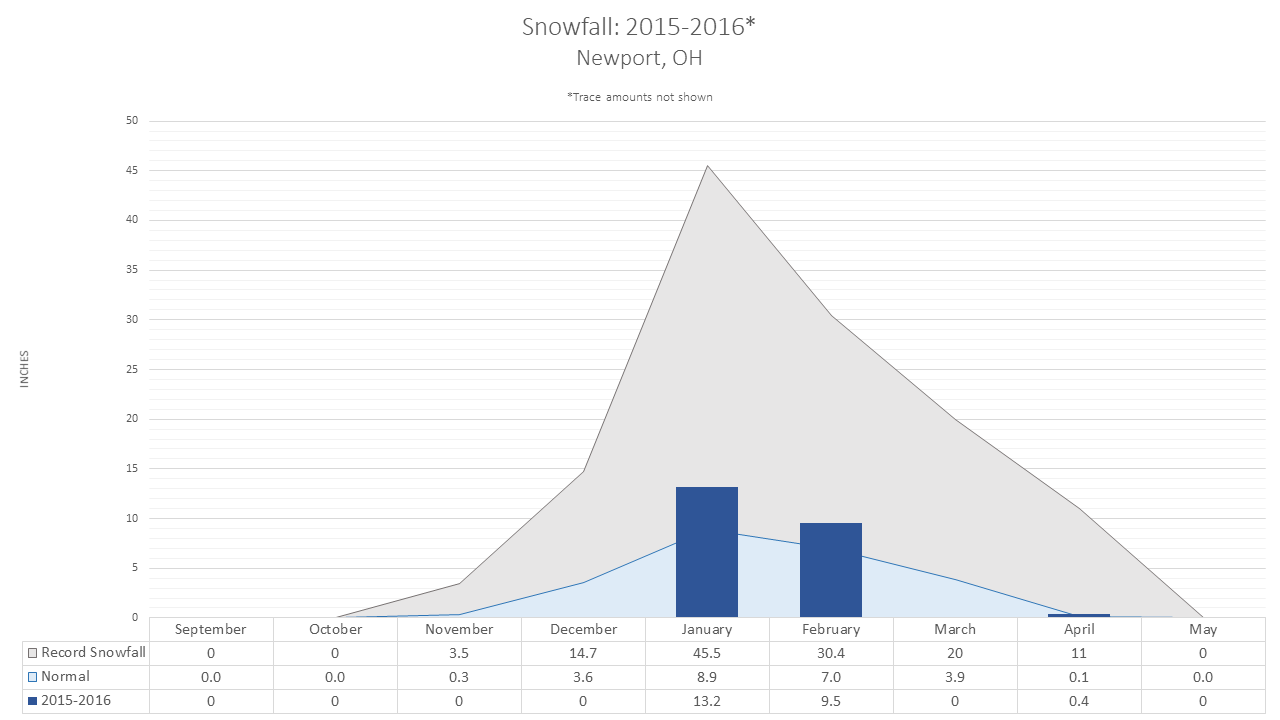
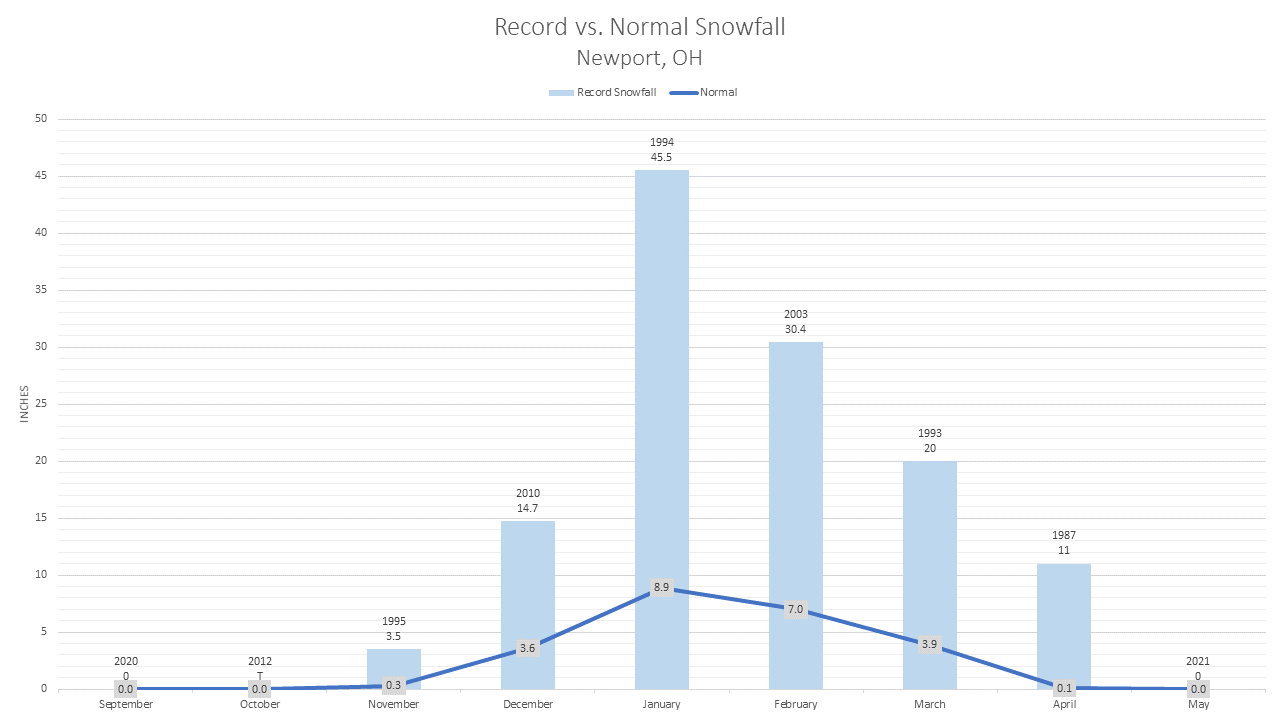
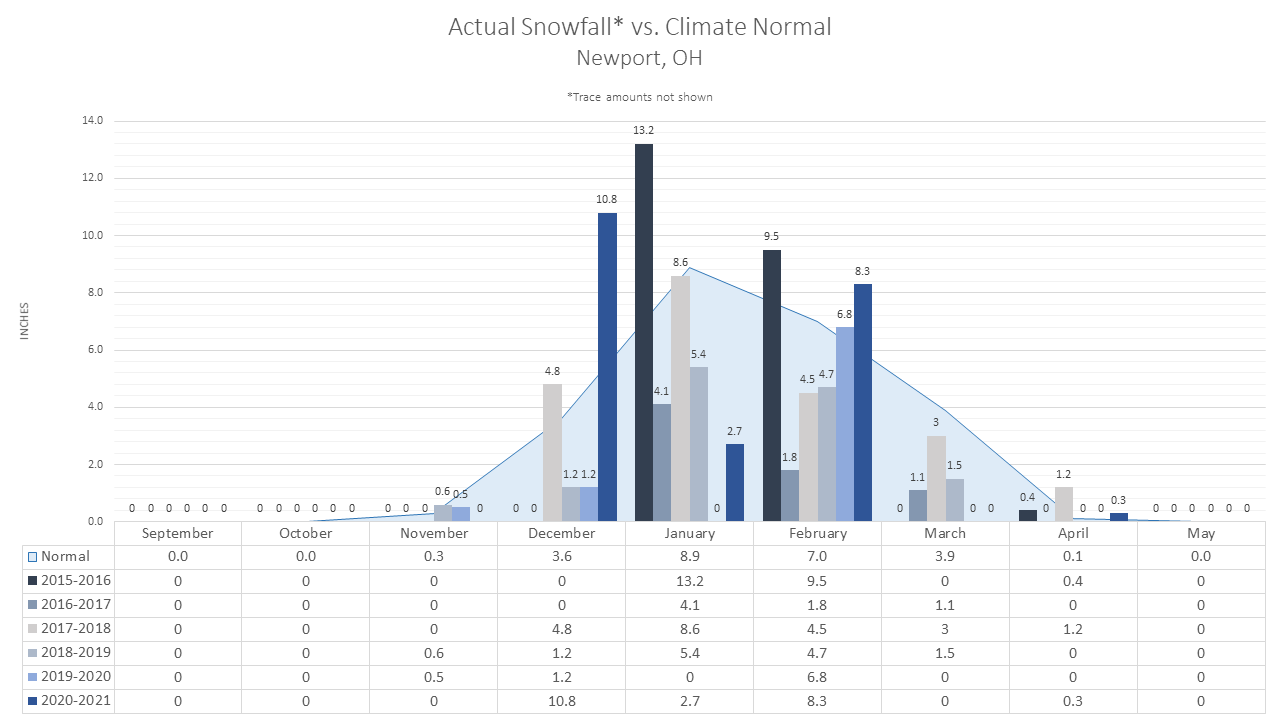
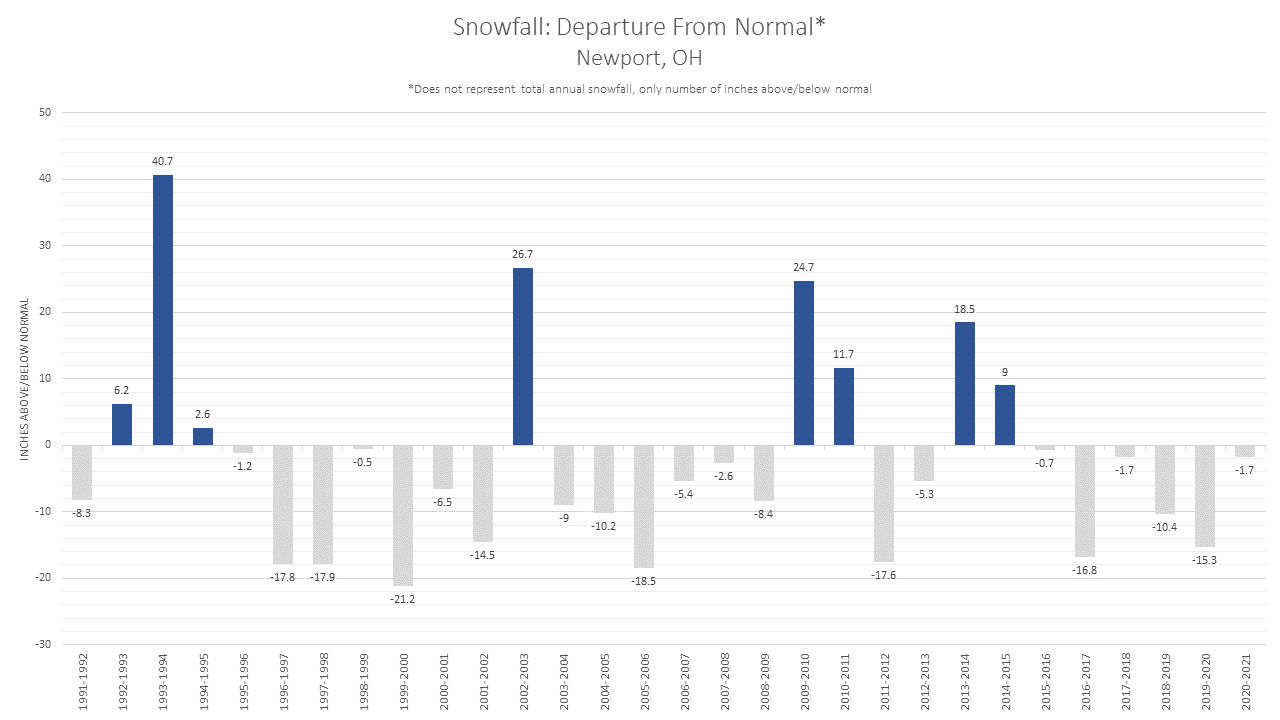
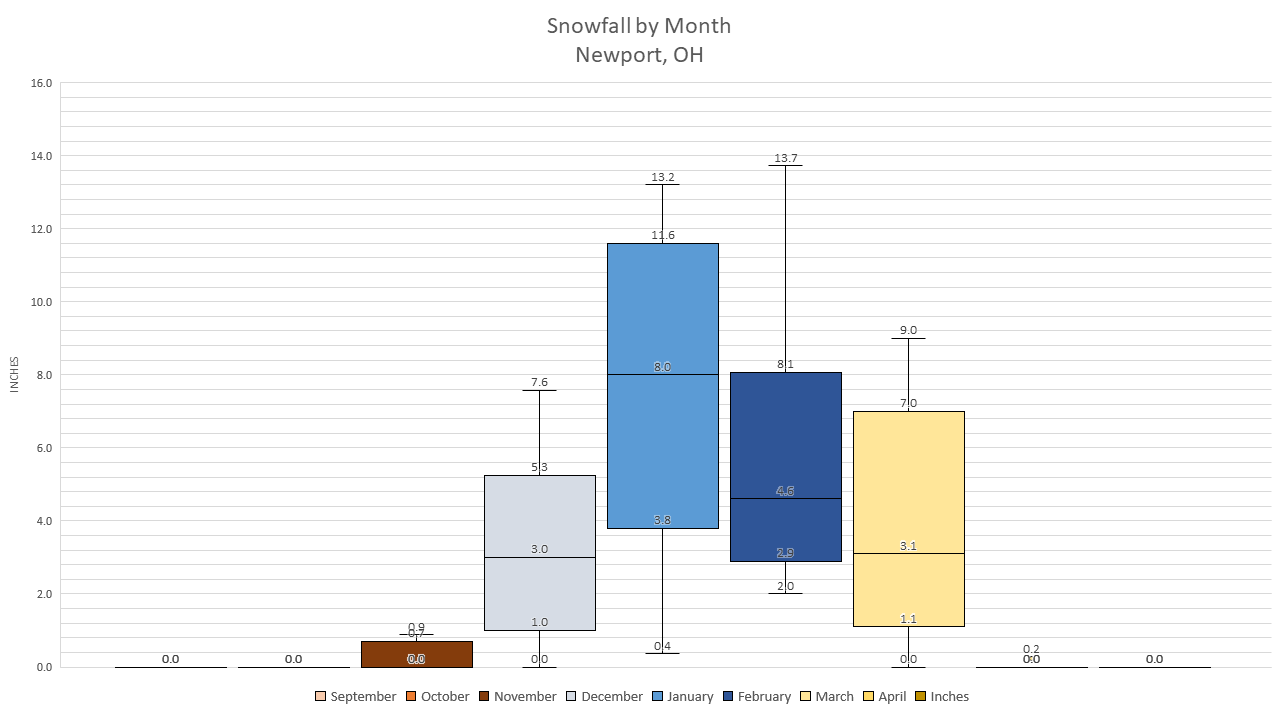
Newport, OH |
||||||
|
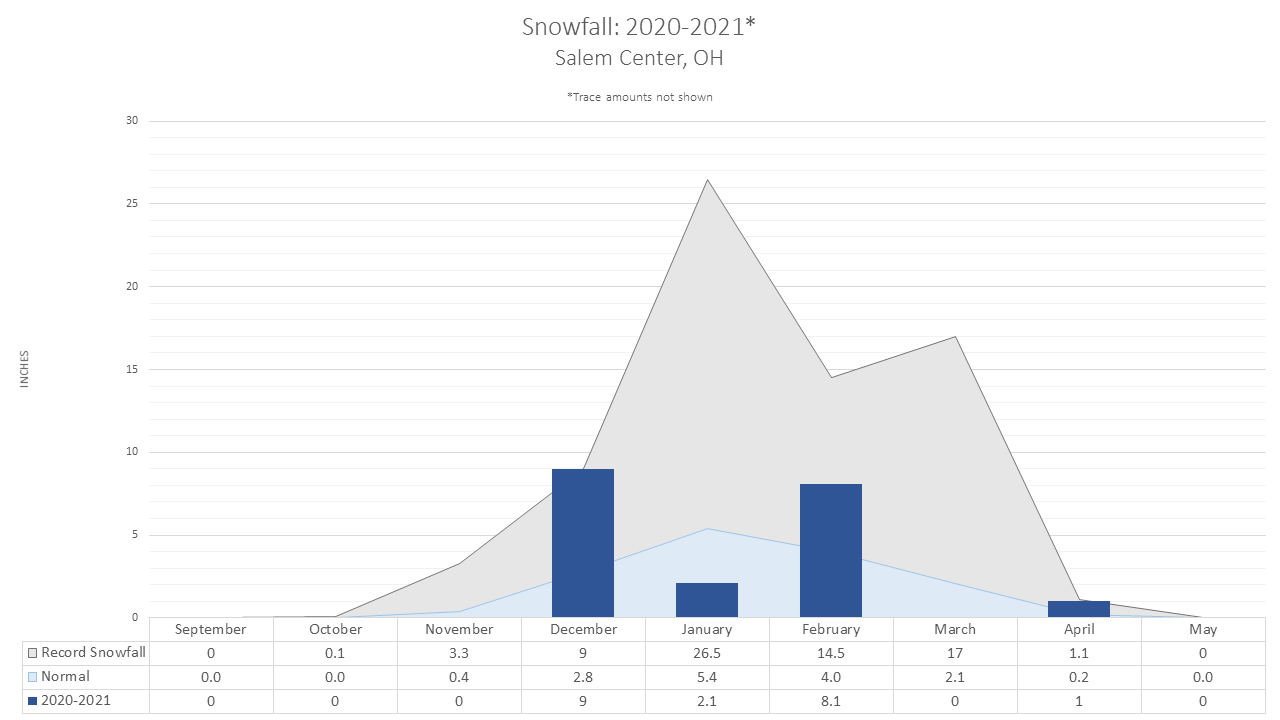
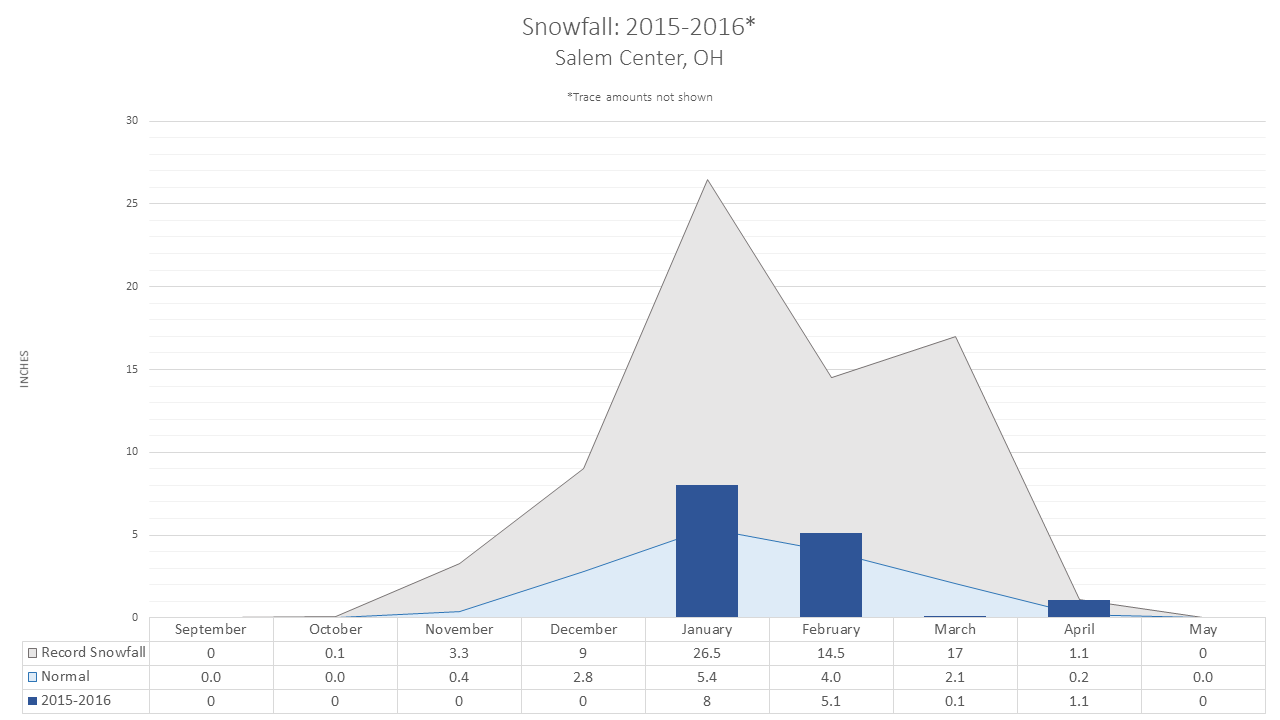
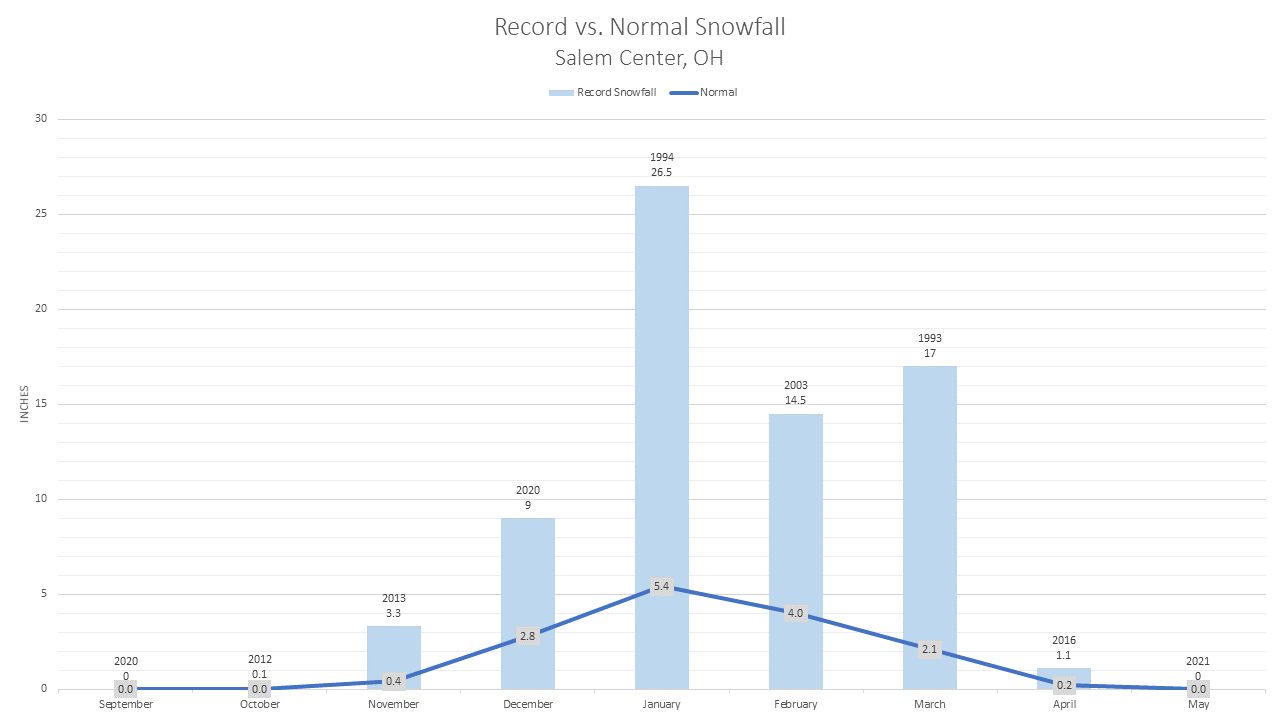
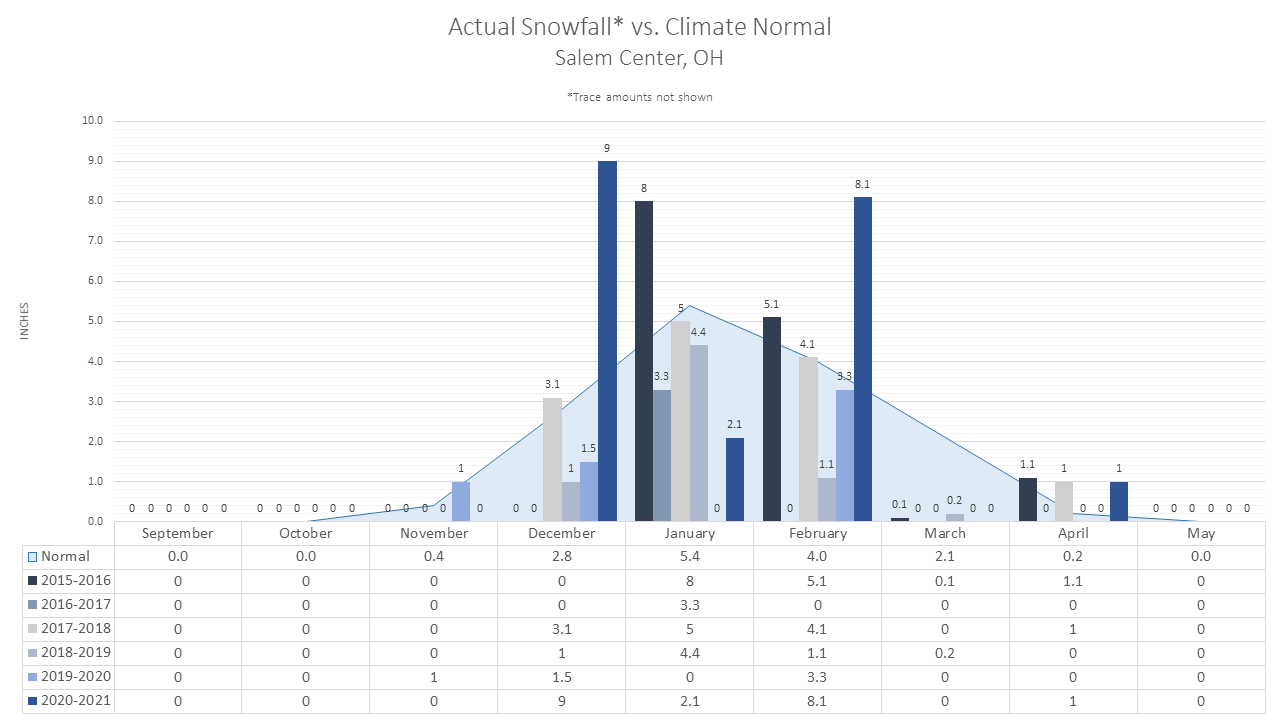
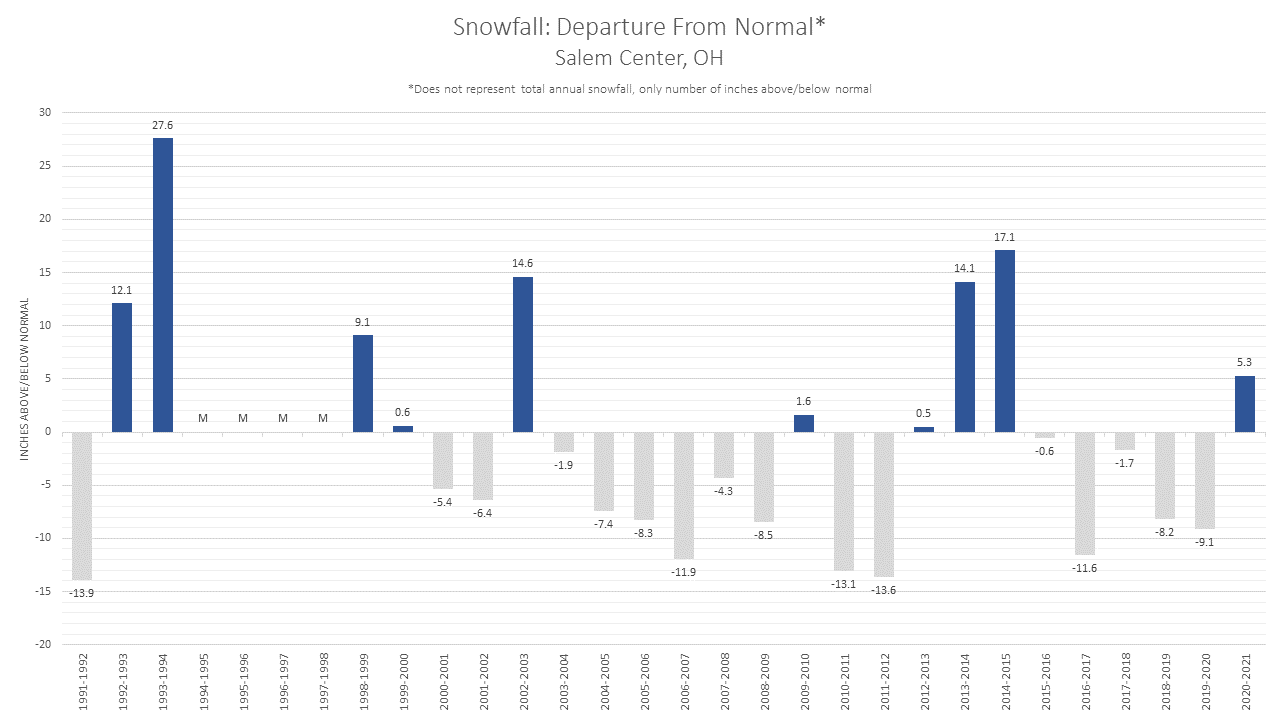
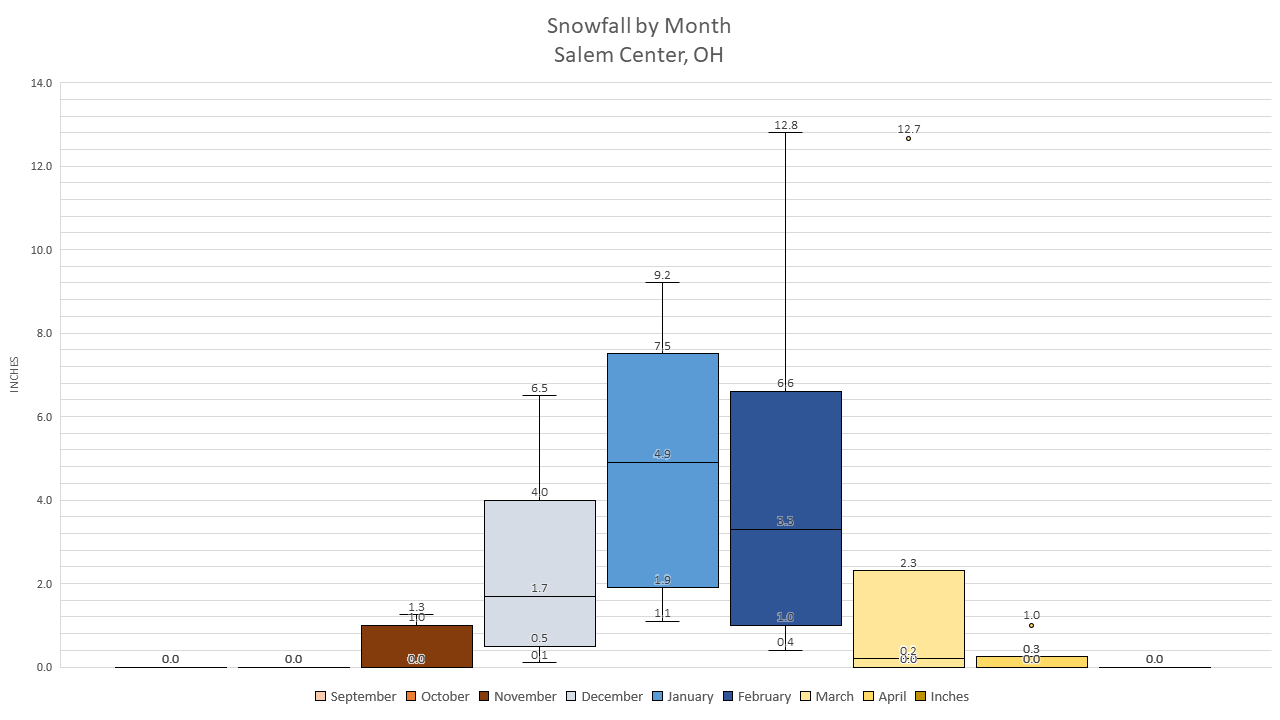
Salem Center, OH |
||||||
|
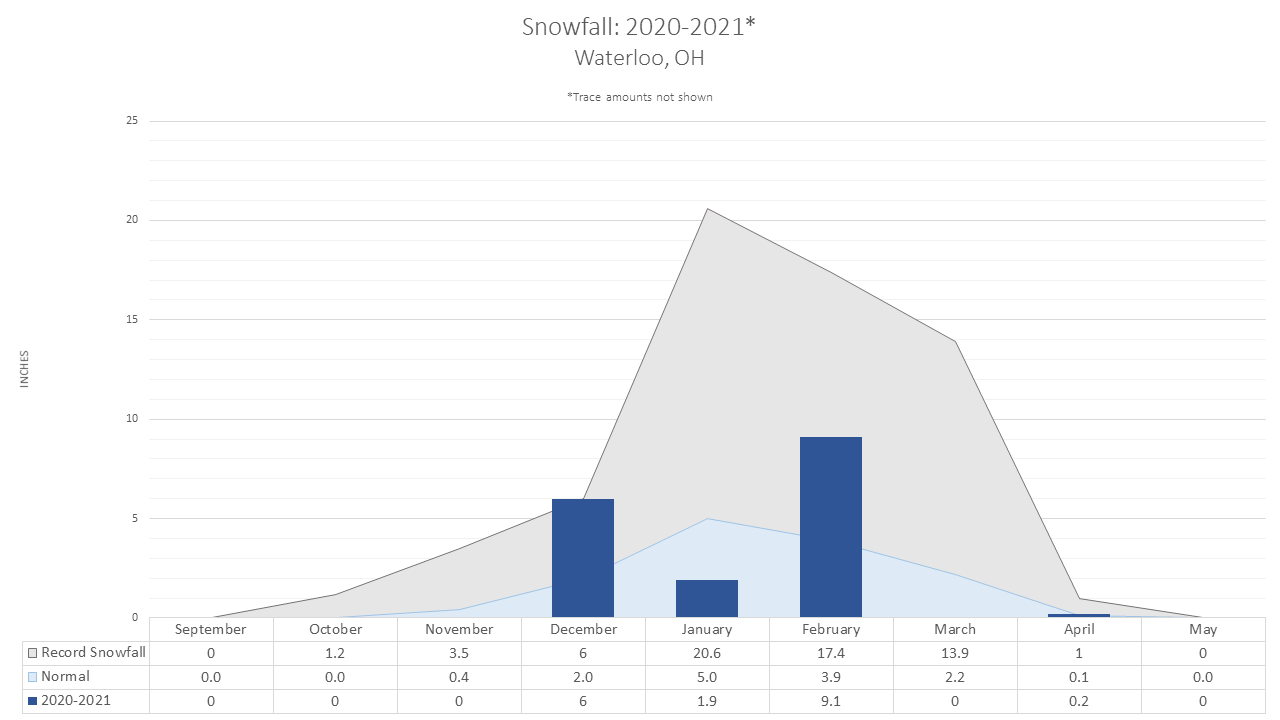
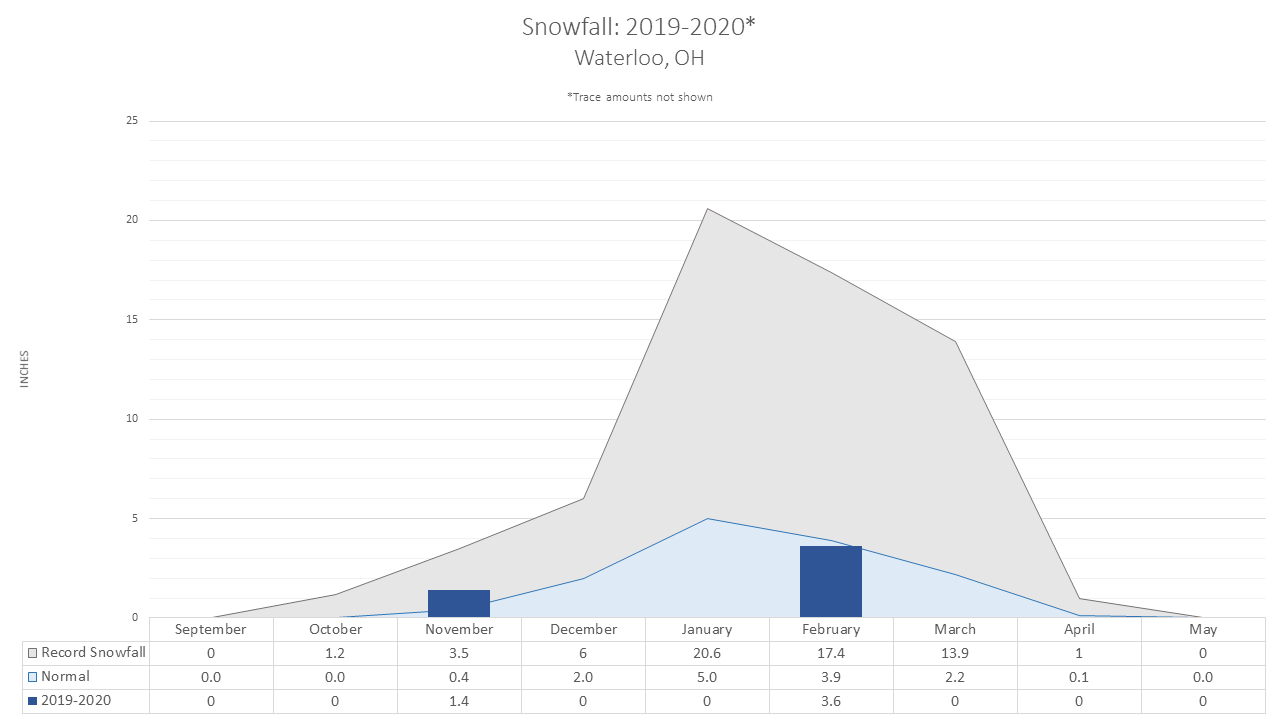
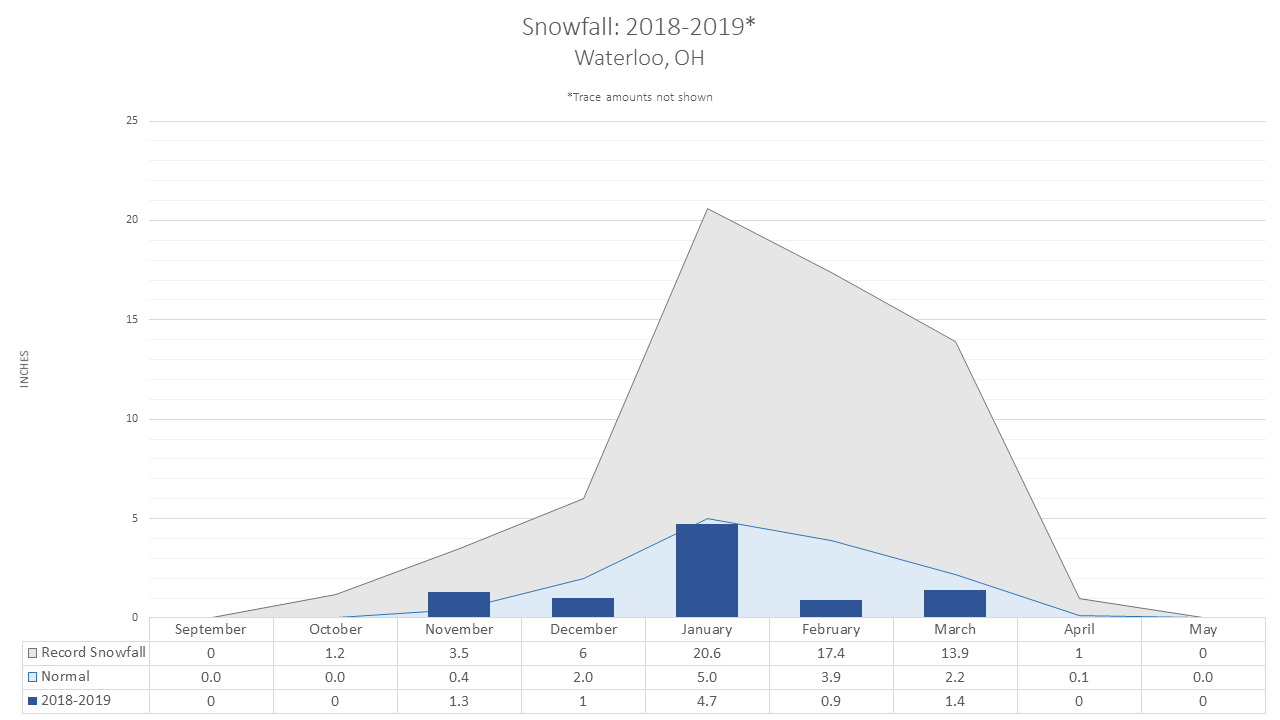
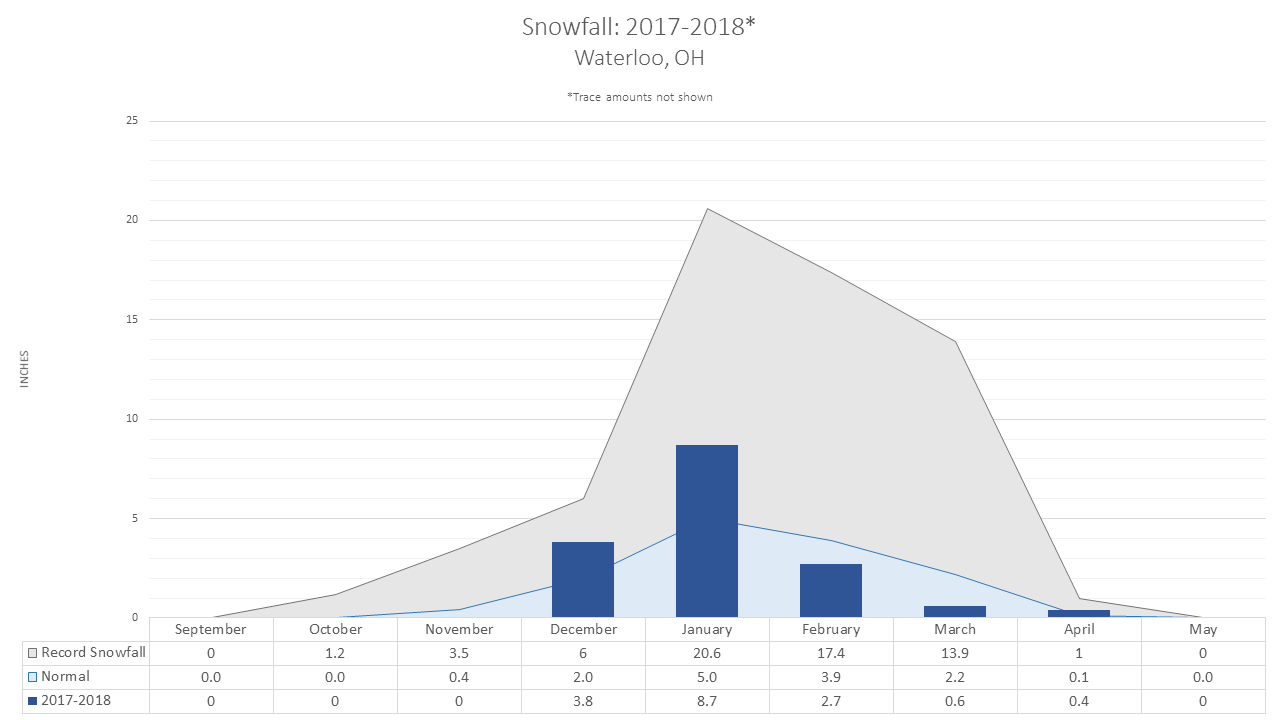
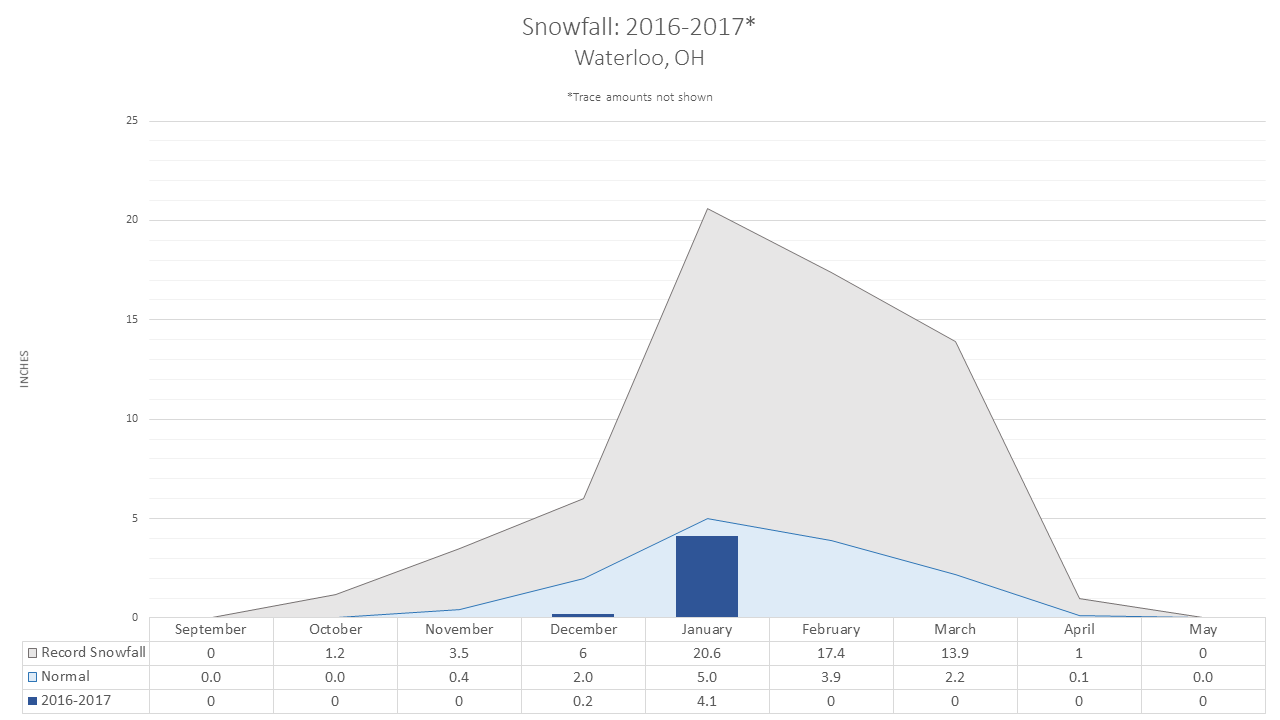
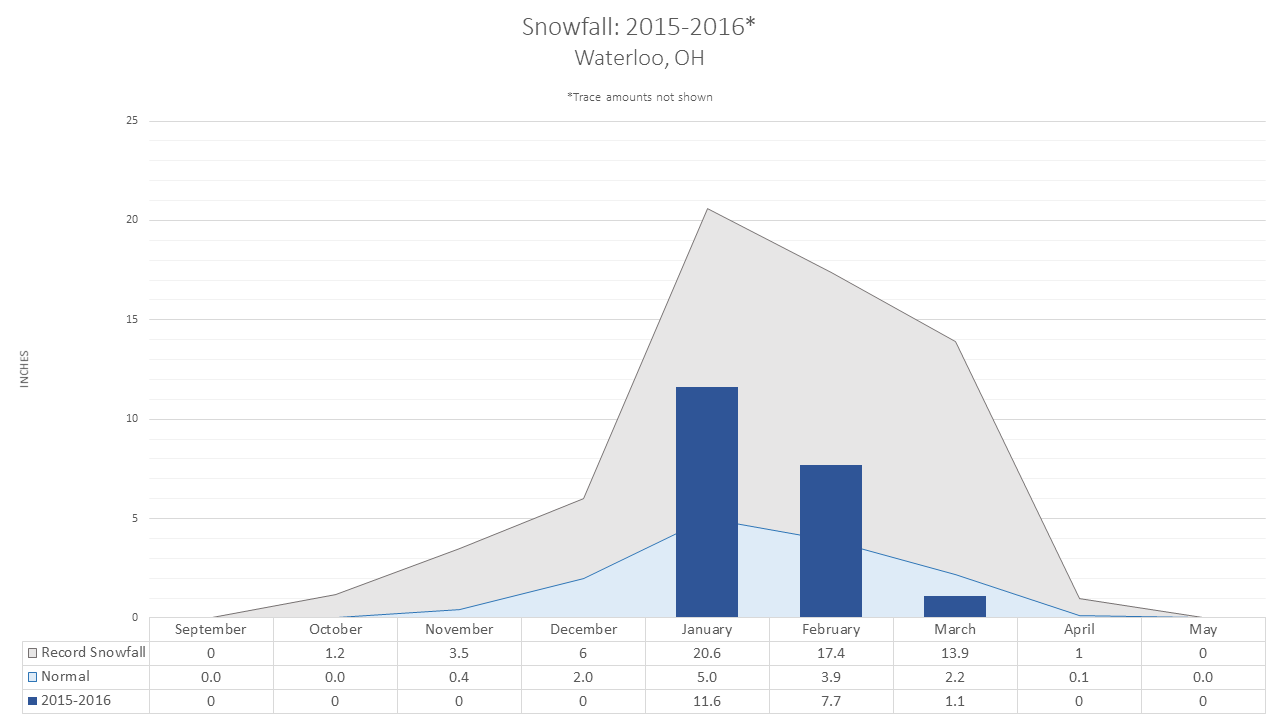
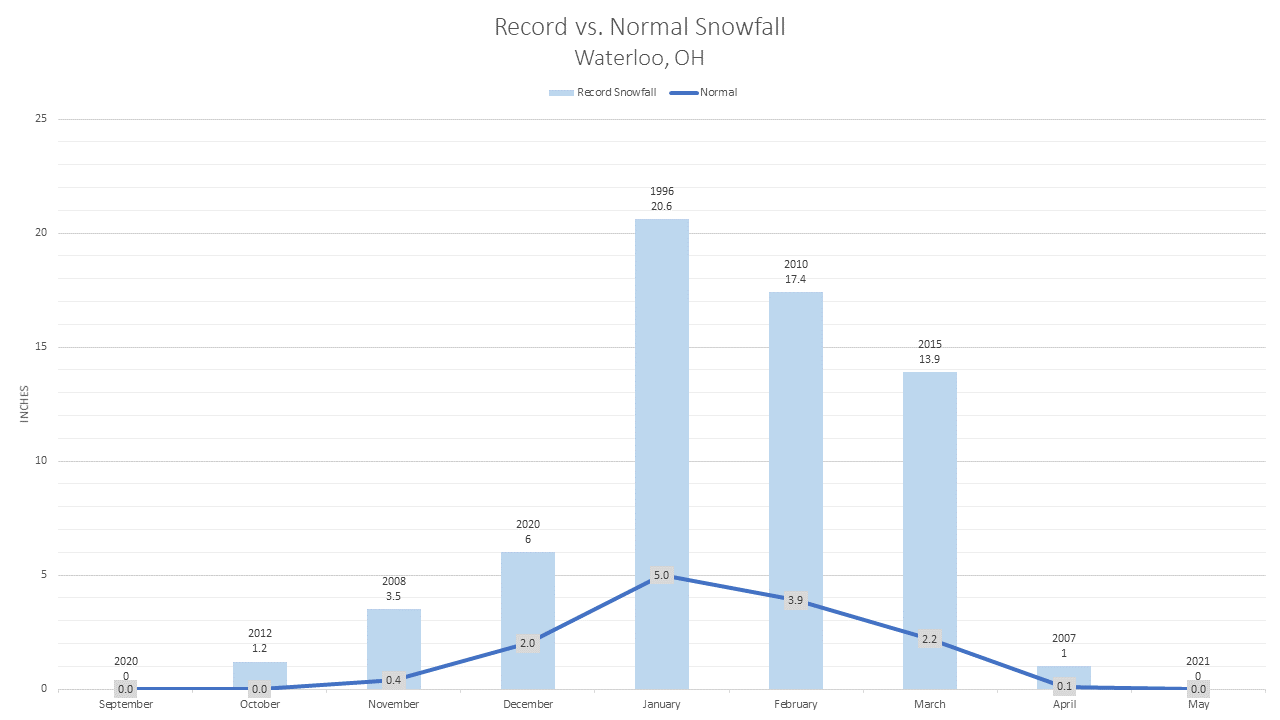
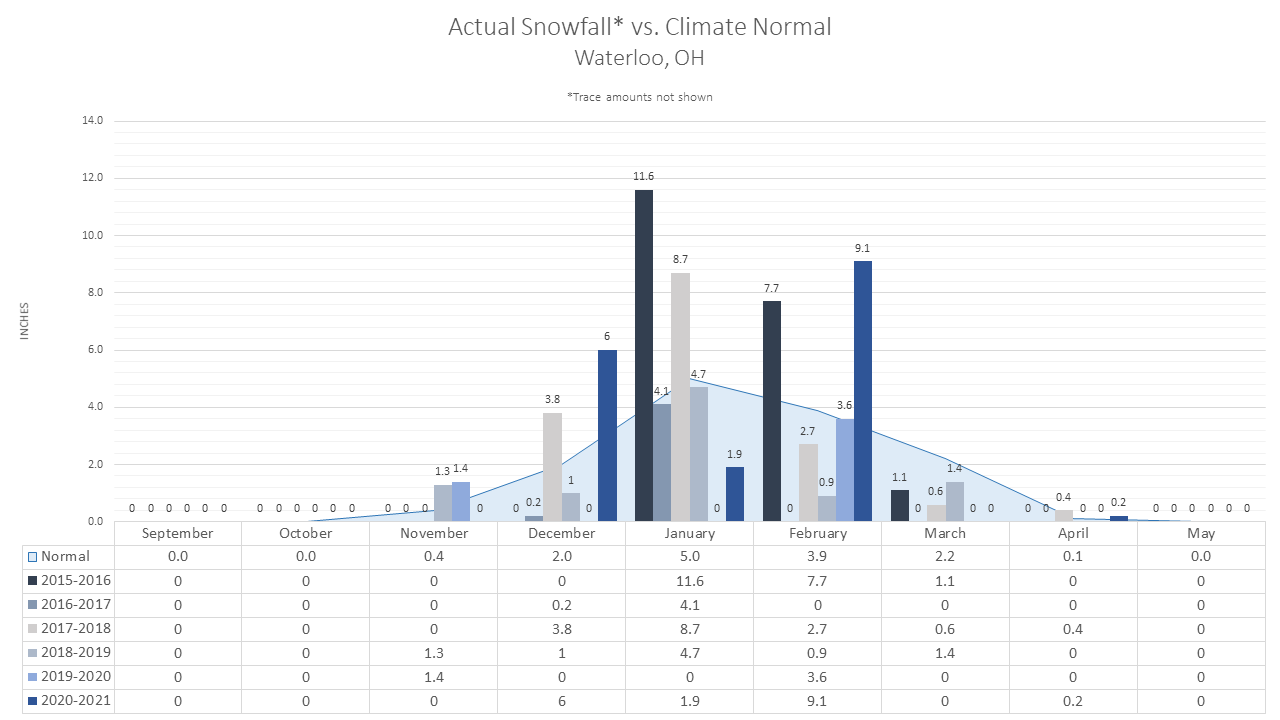
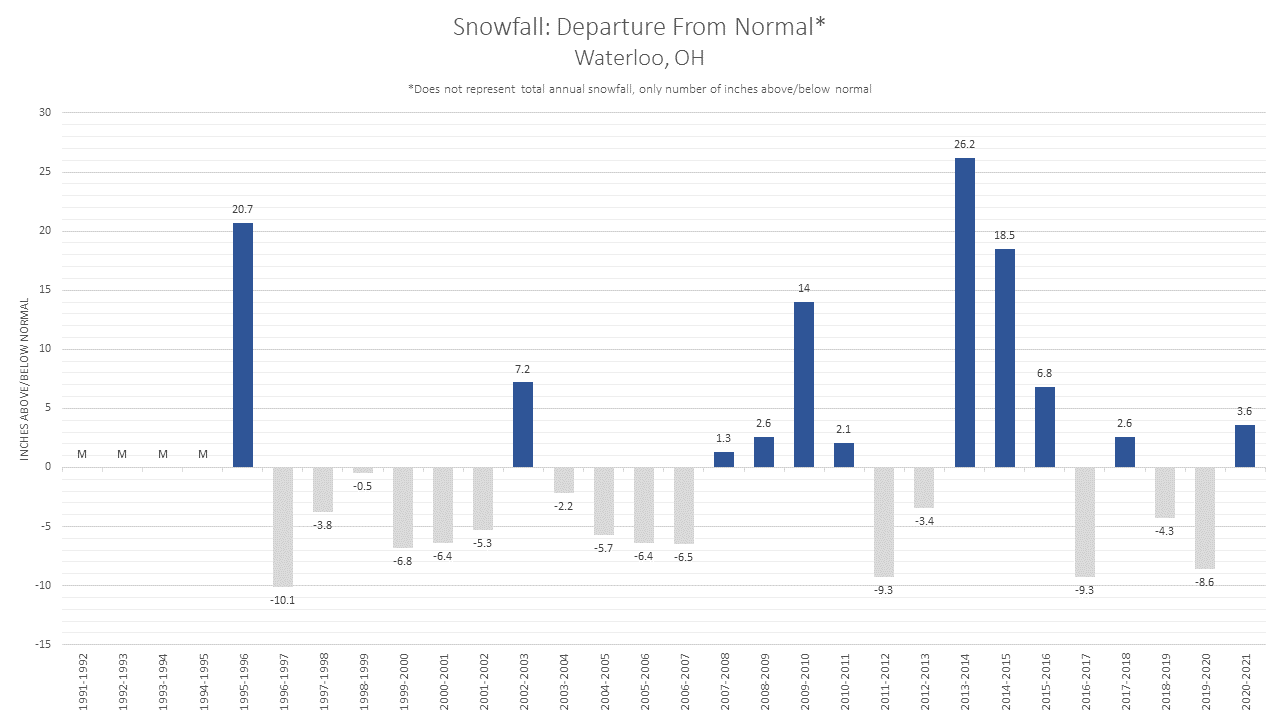
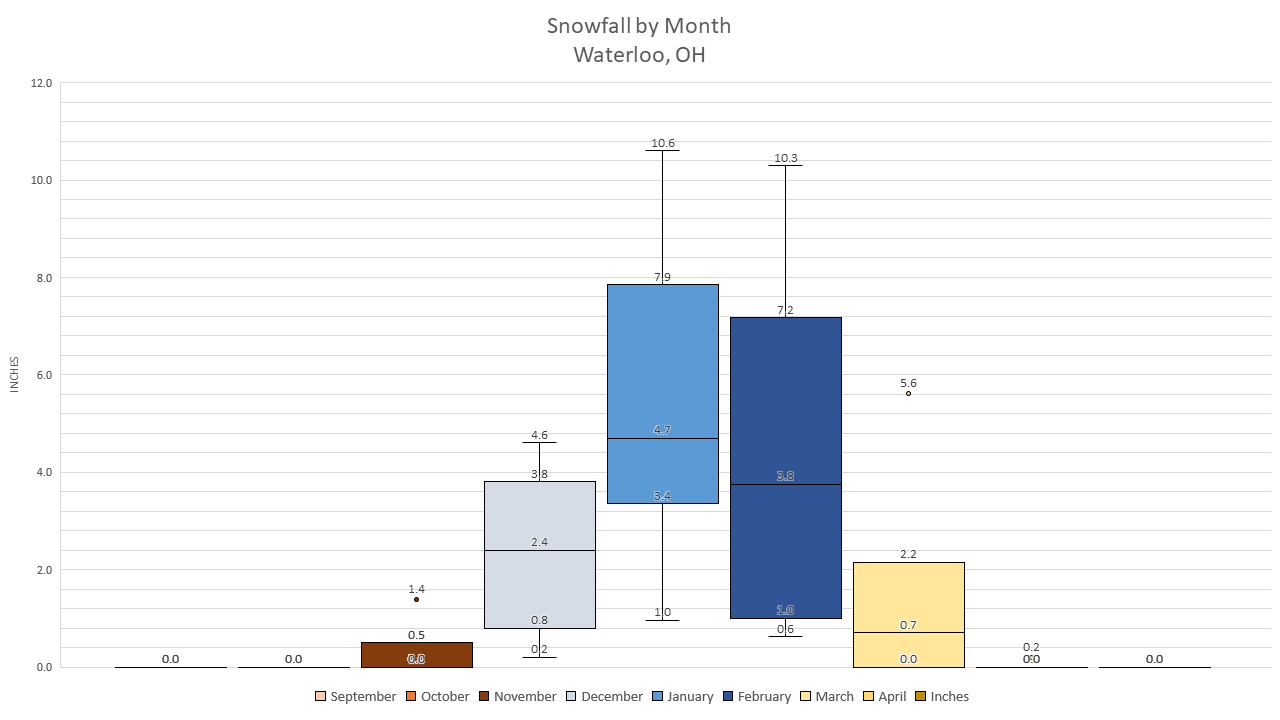
Waterloo, OH |
|
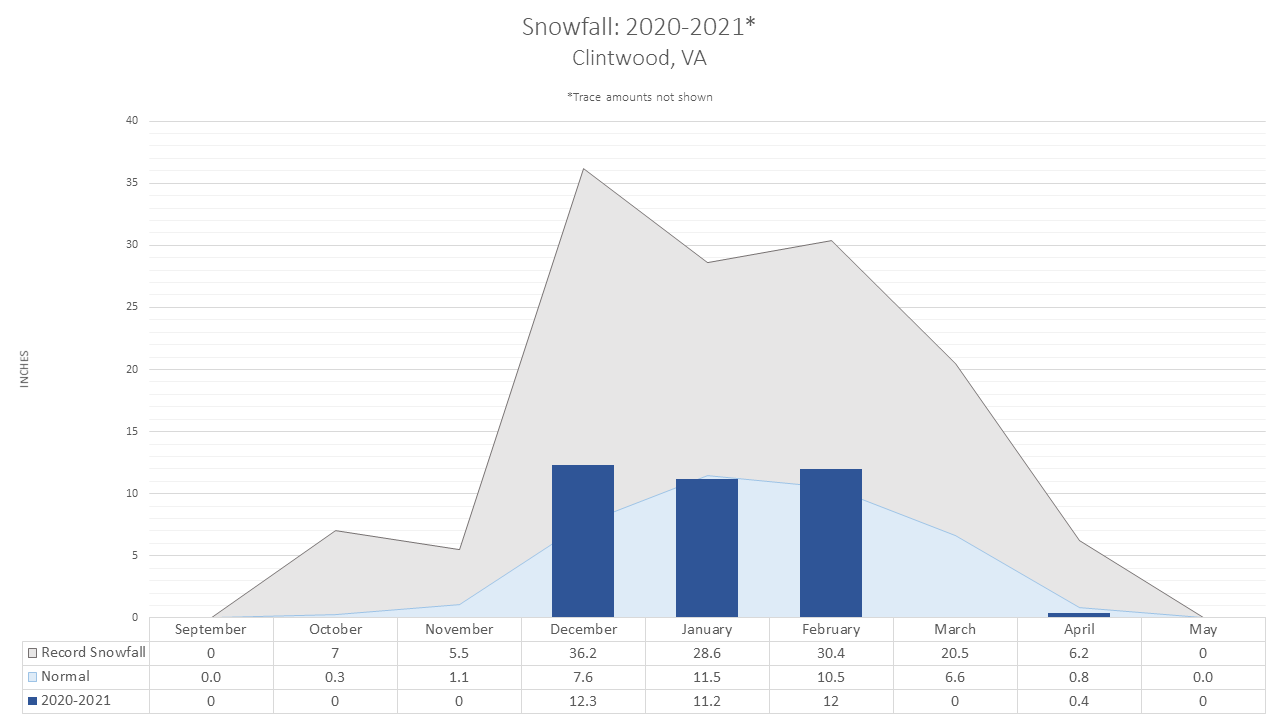
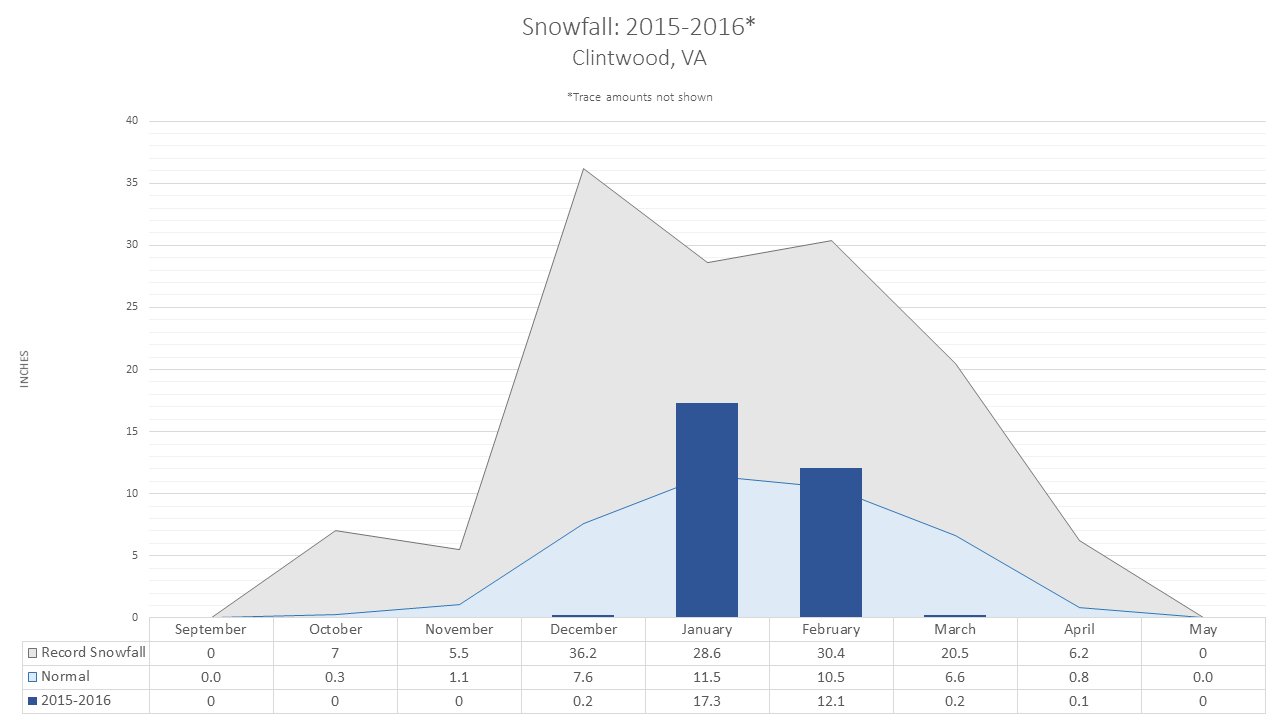
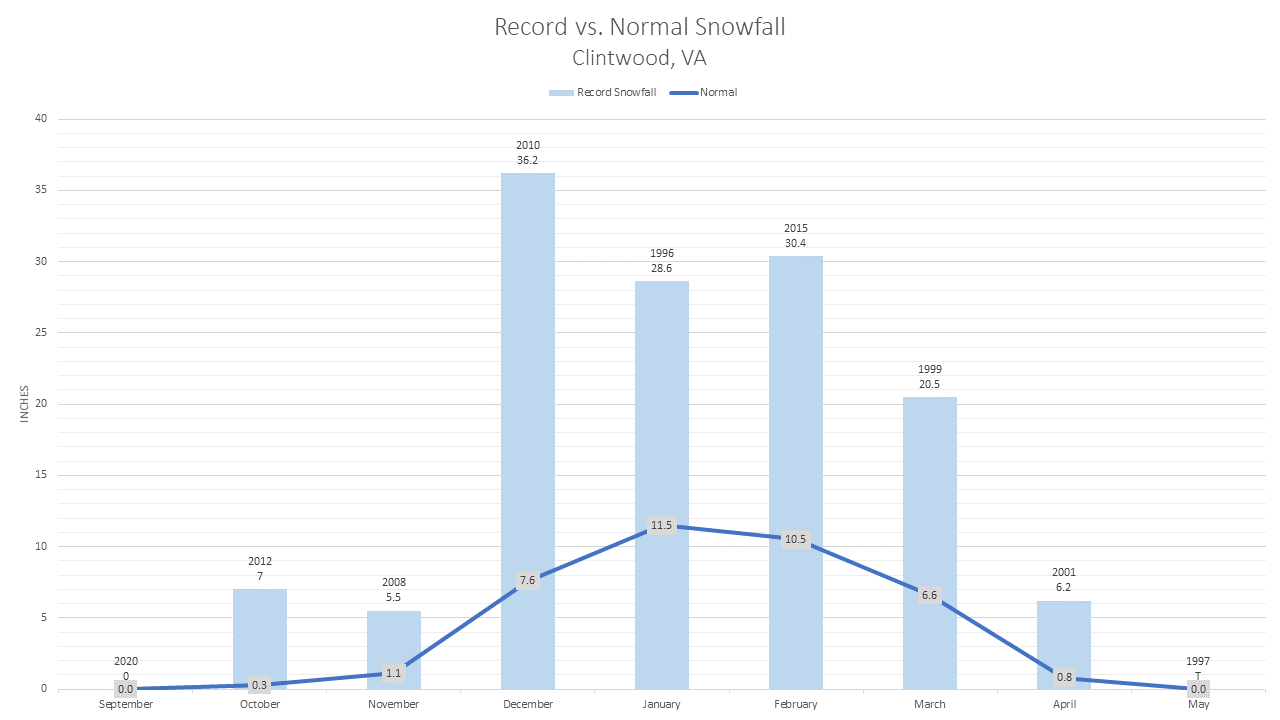
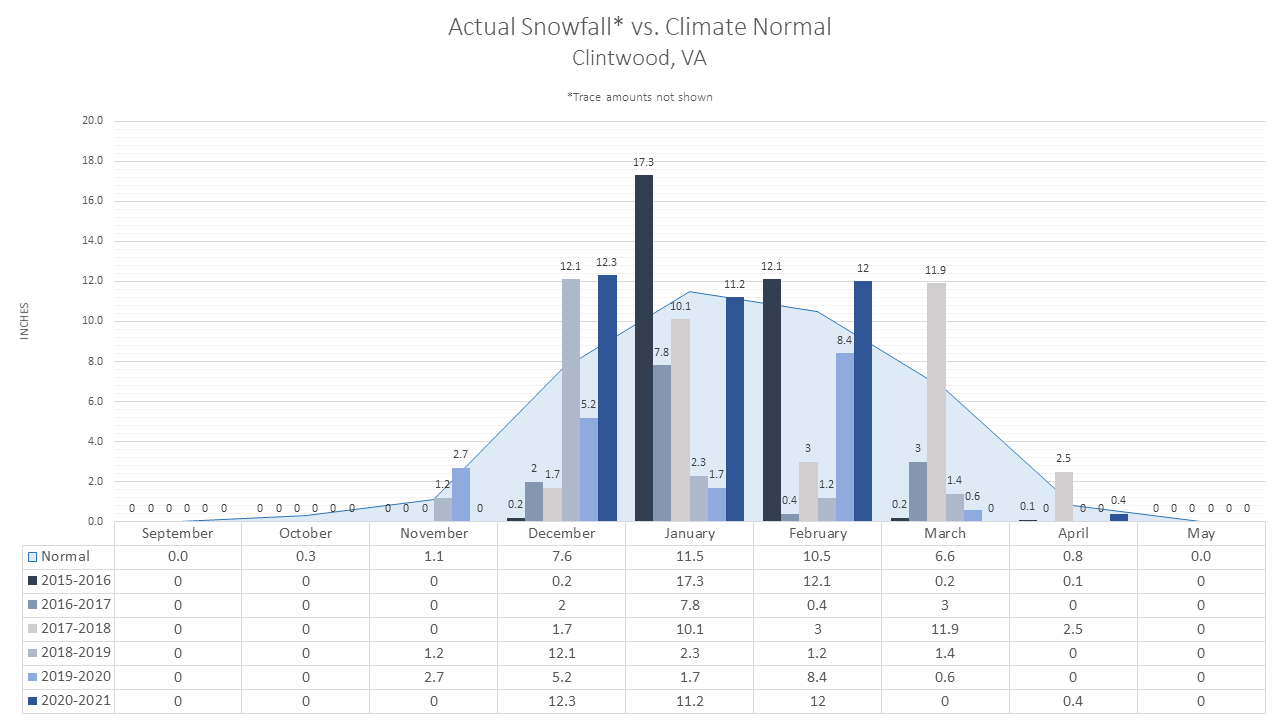
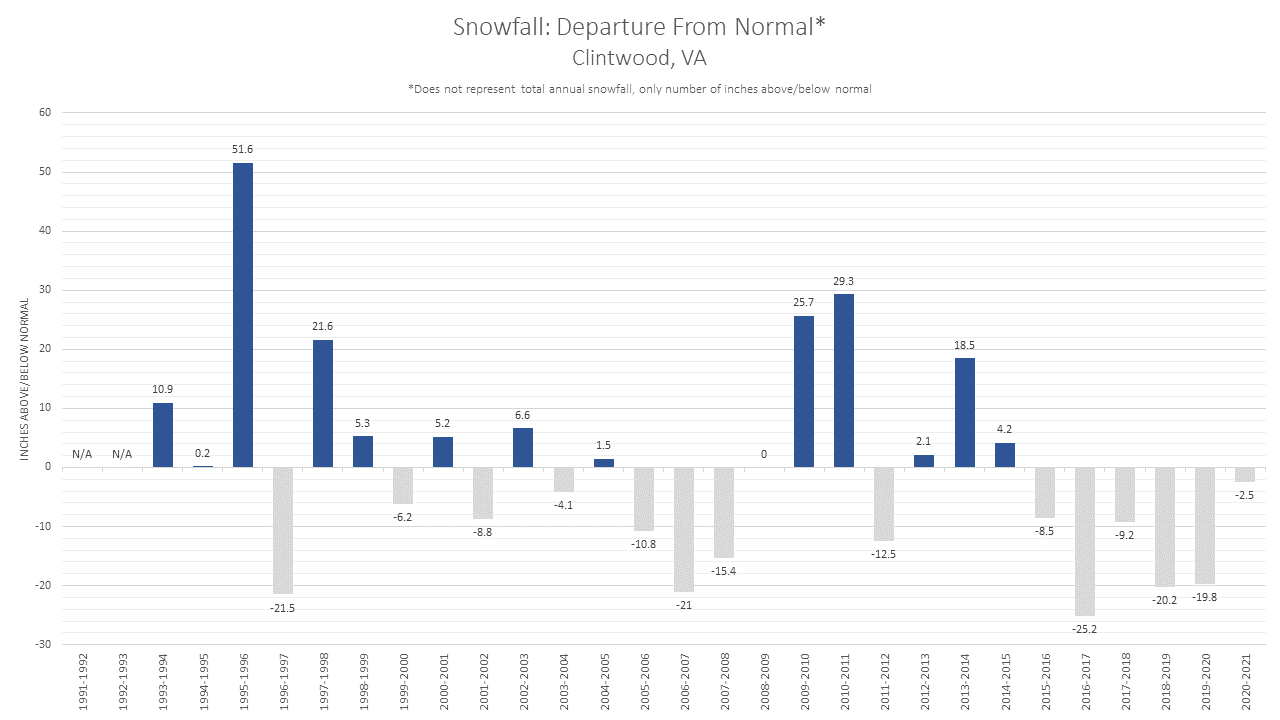
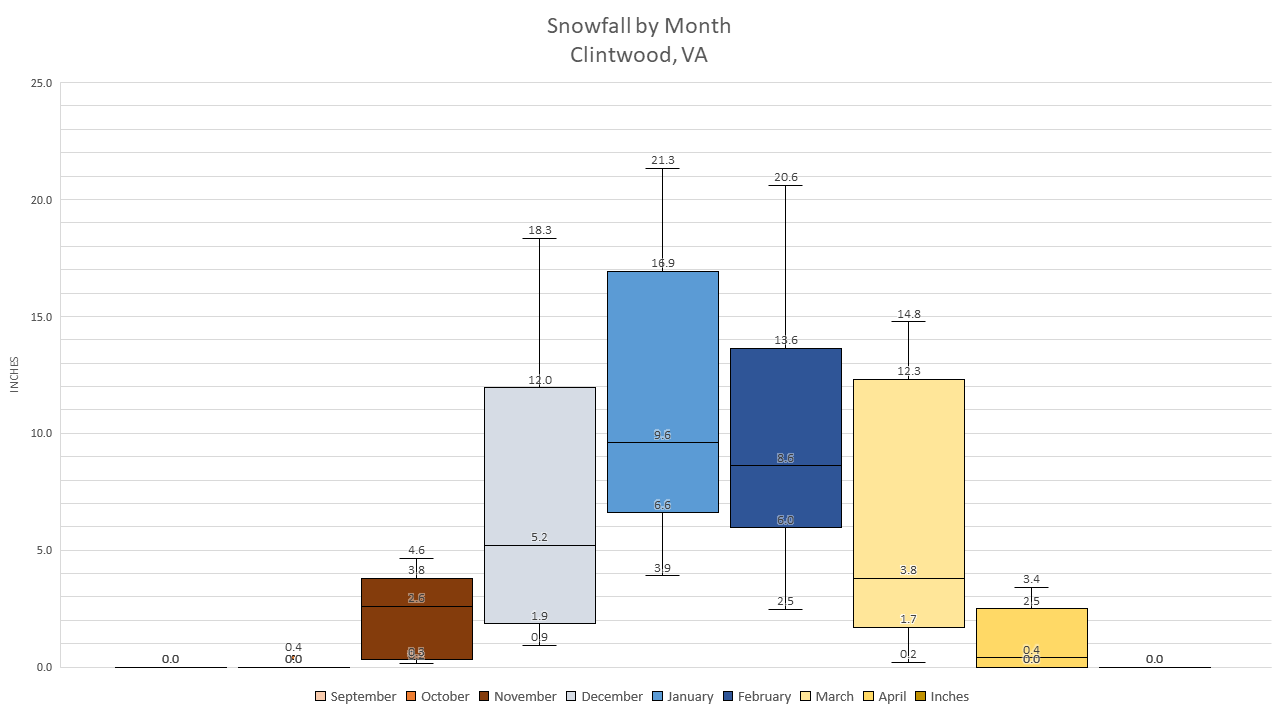
Clintwood, VA |
||||||
|
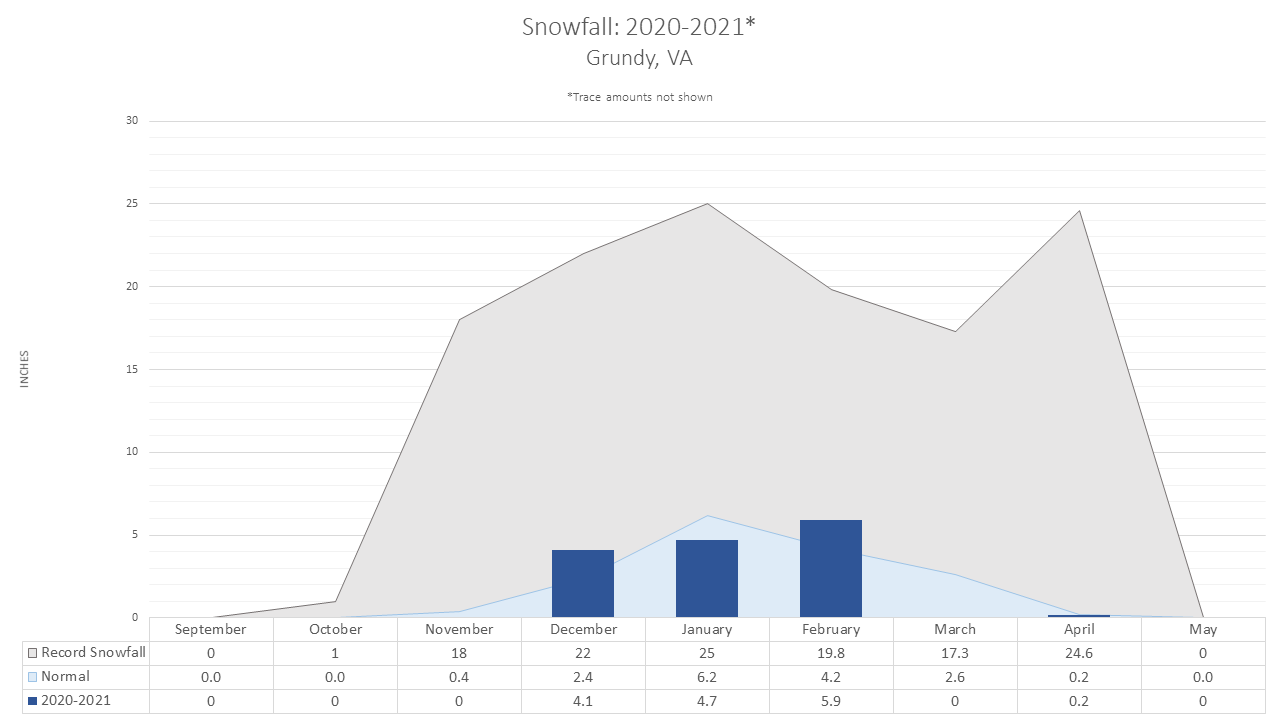
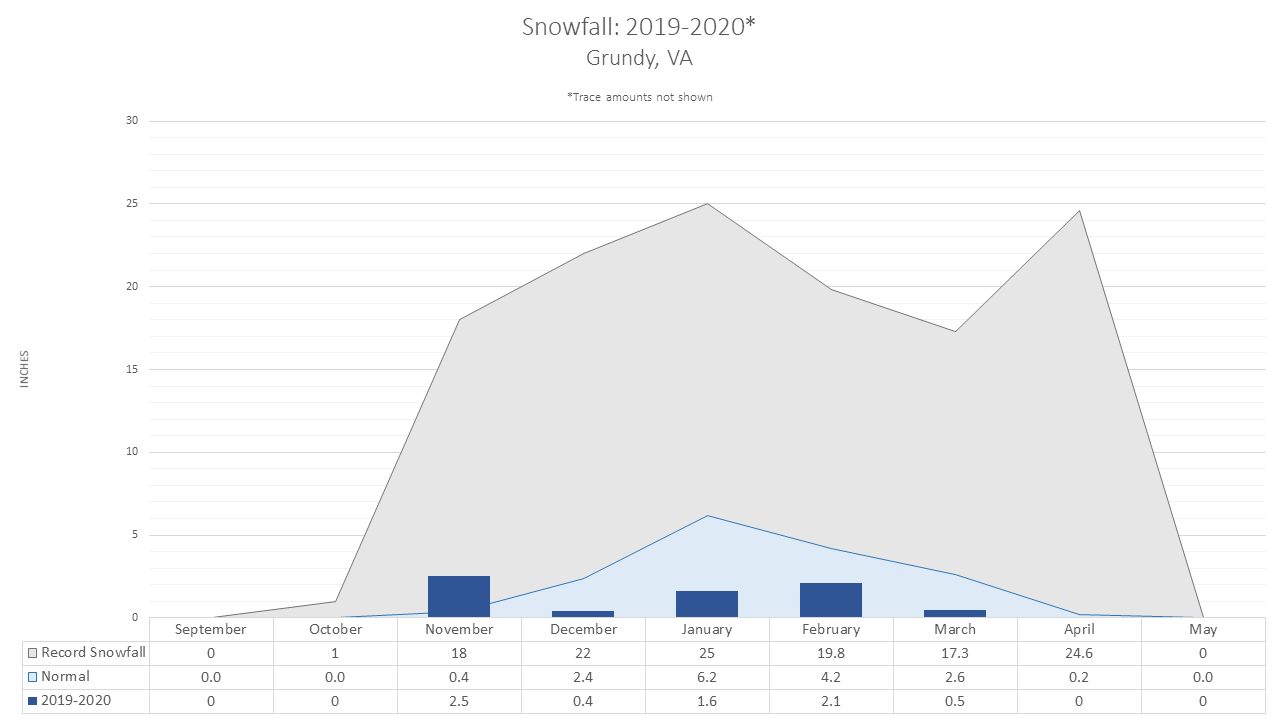
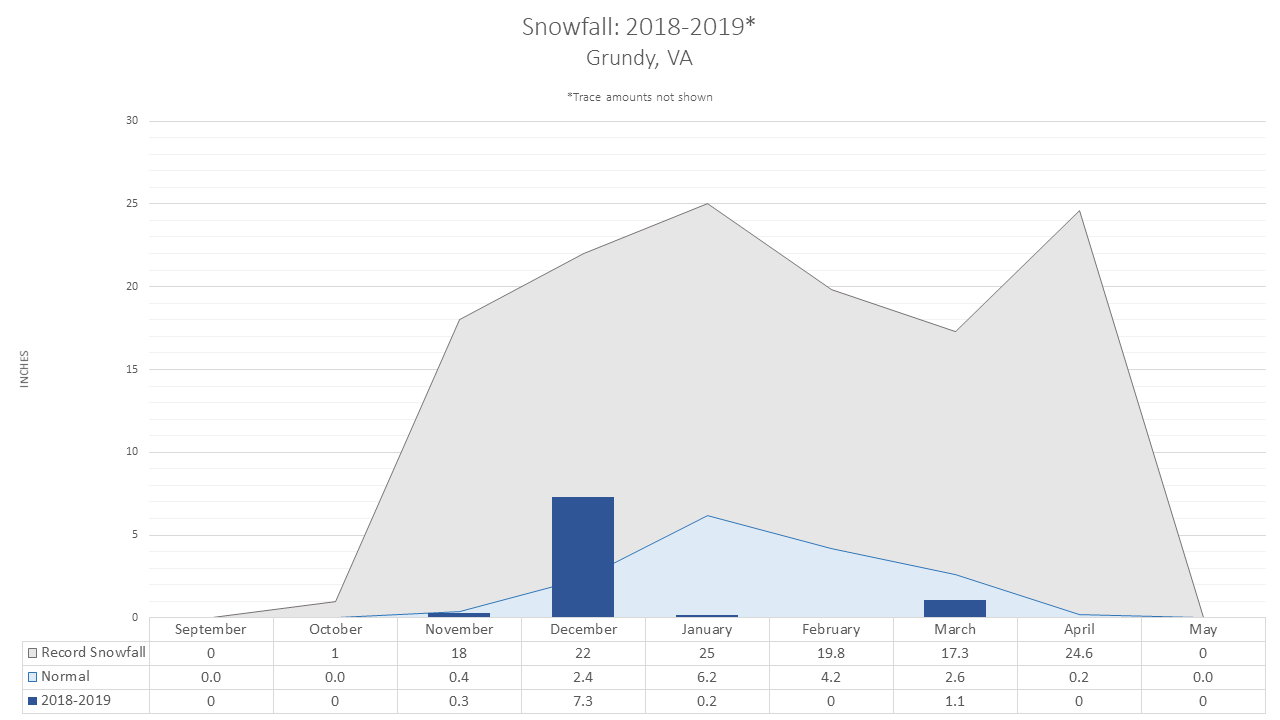
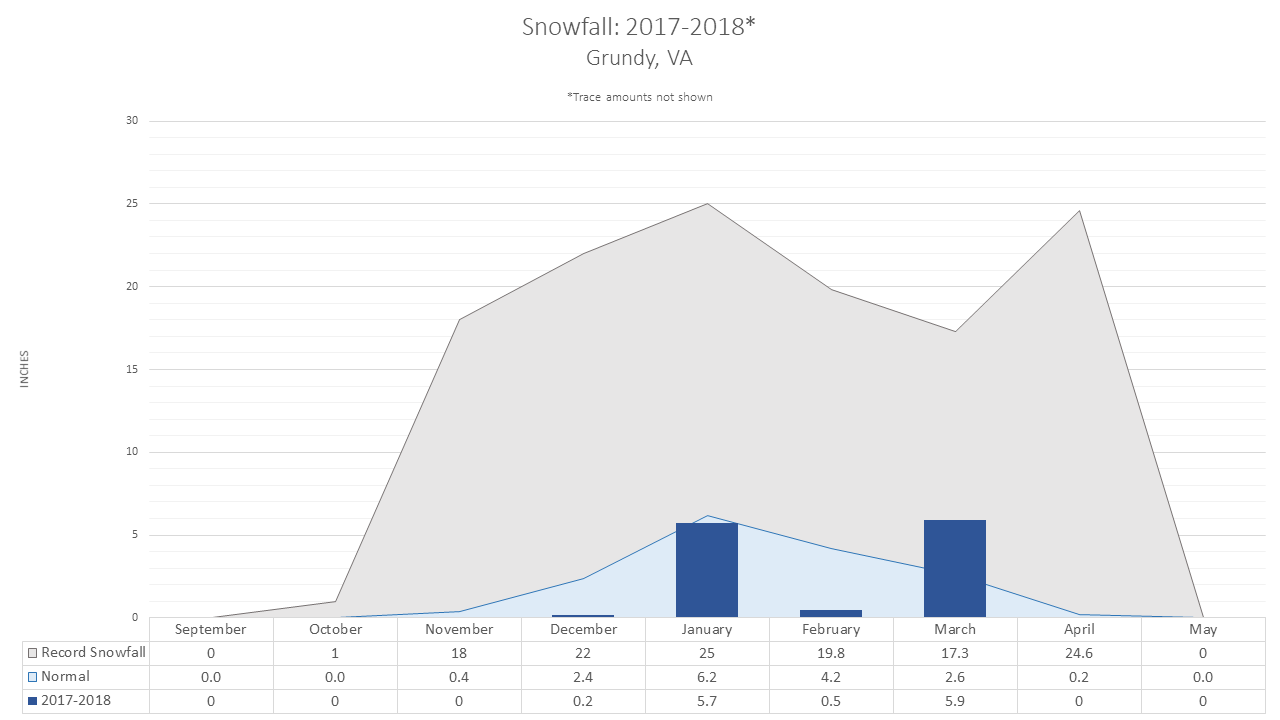
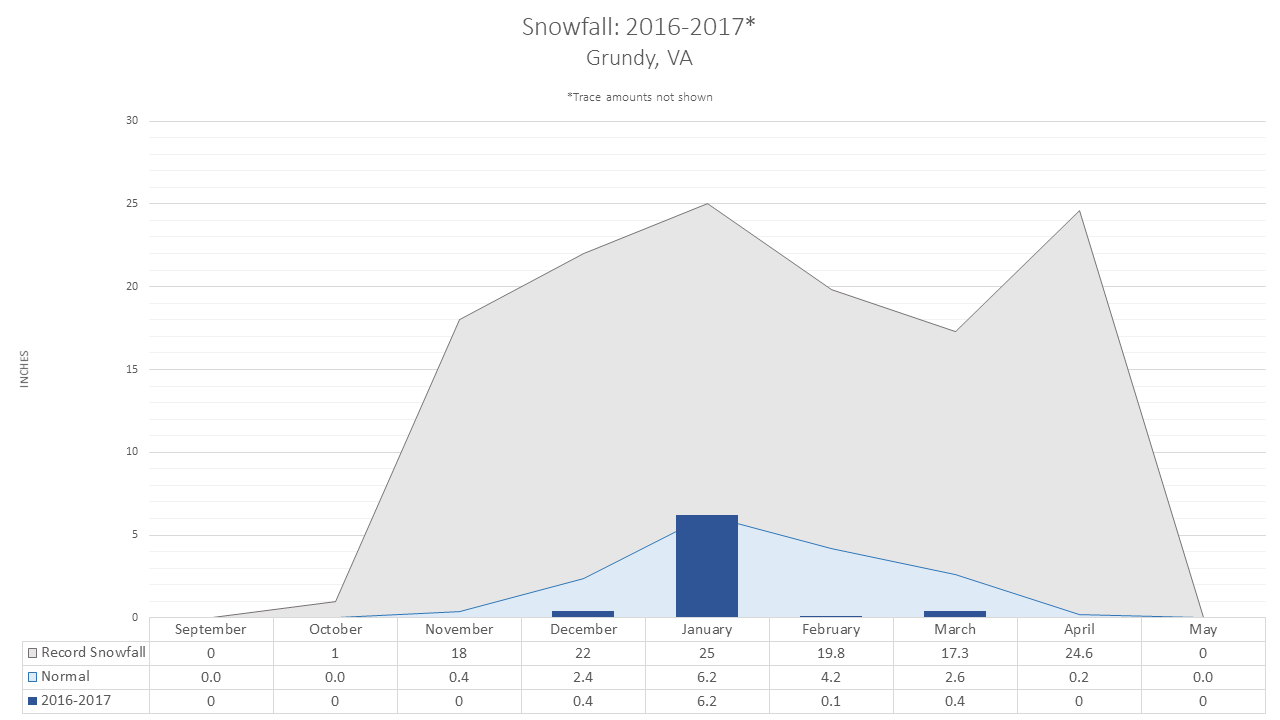
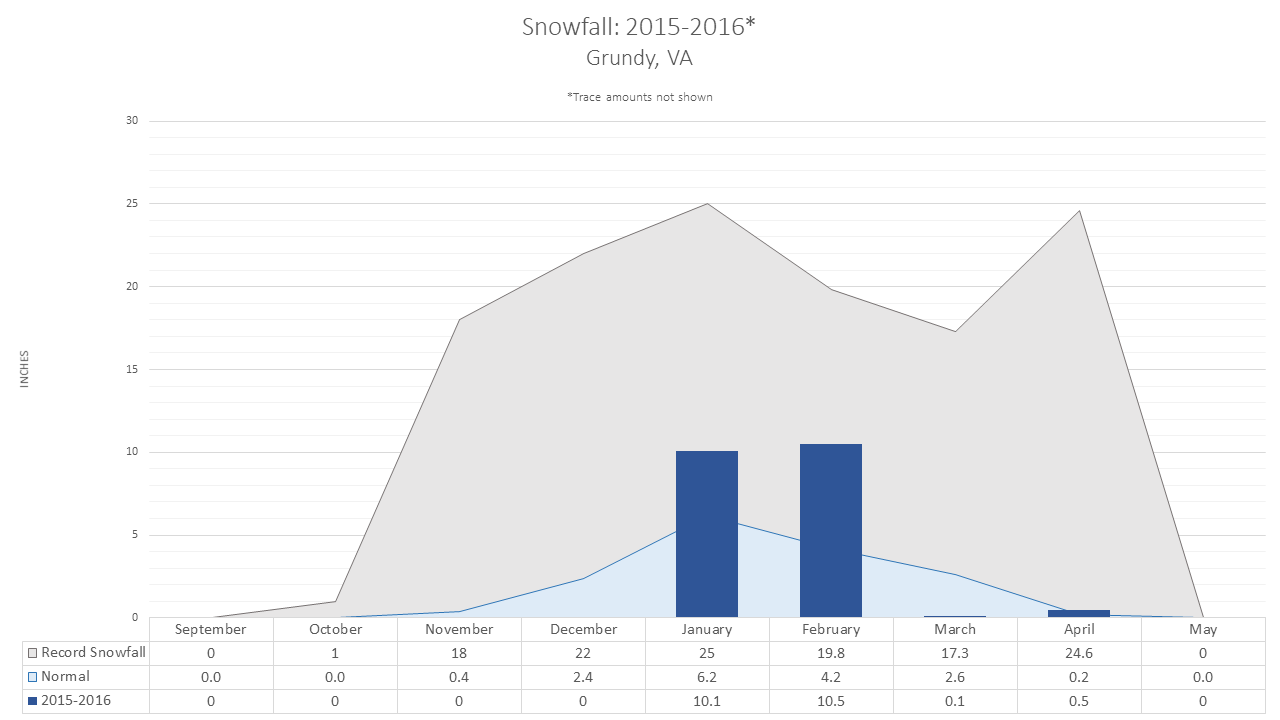
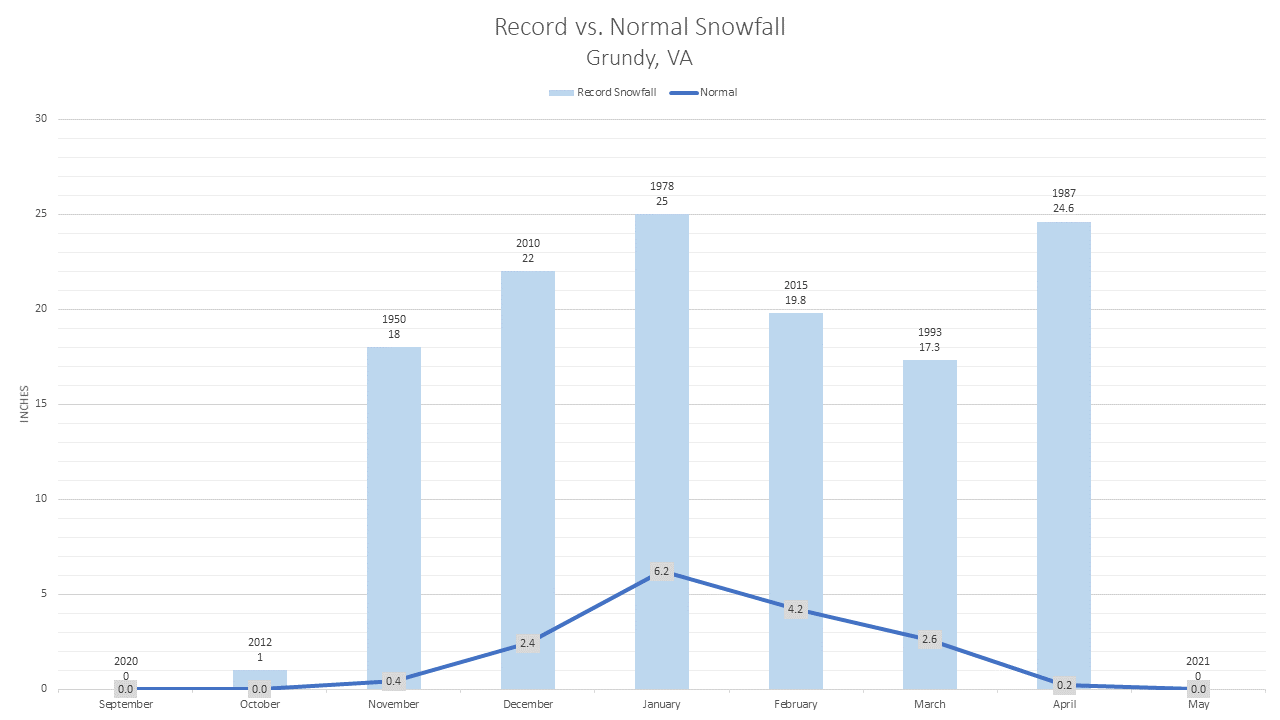
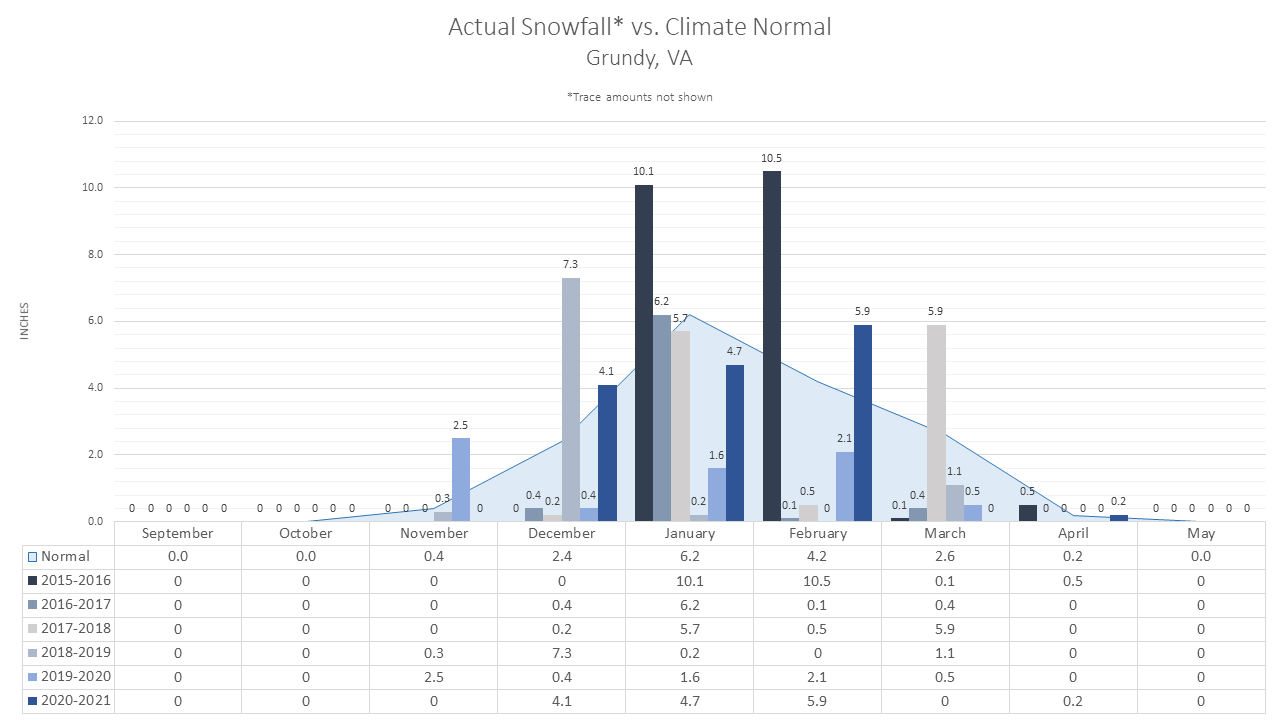
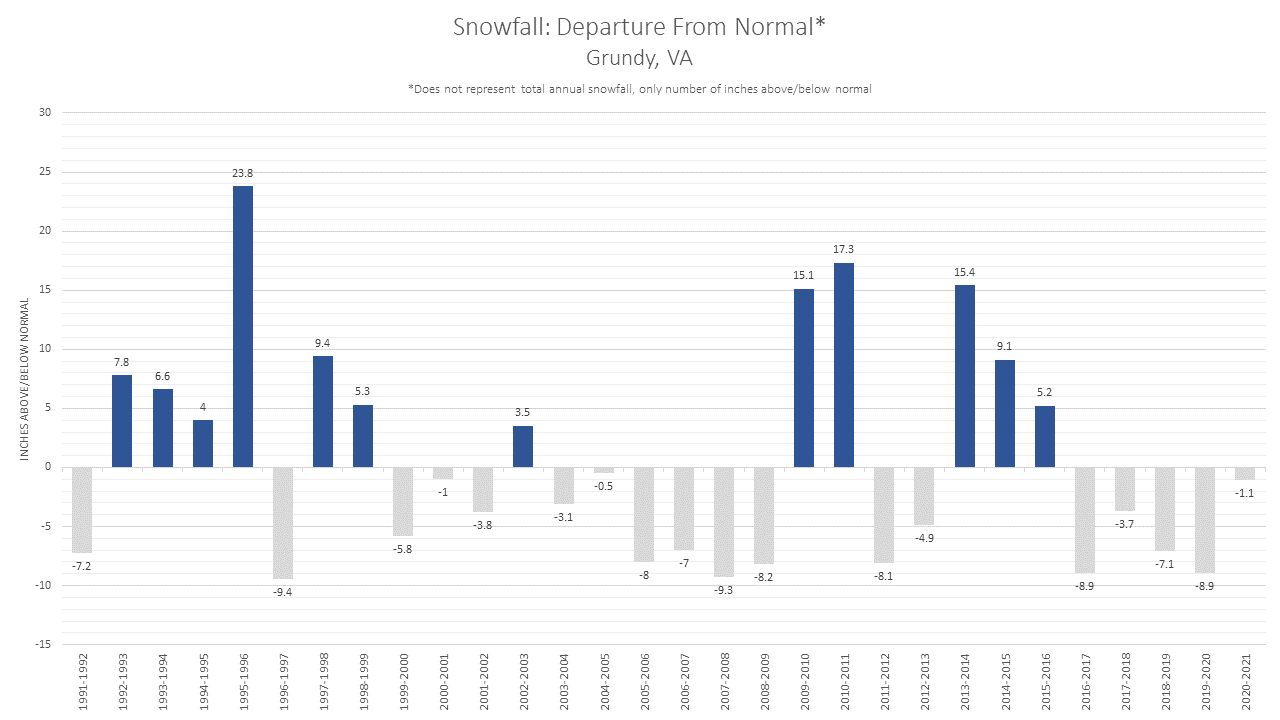
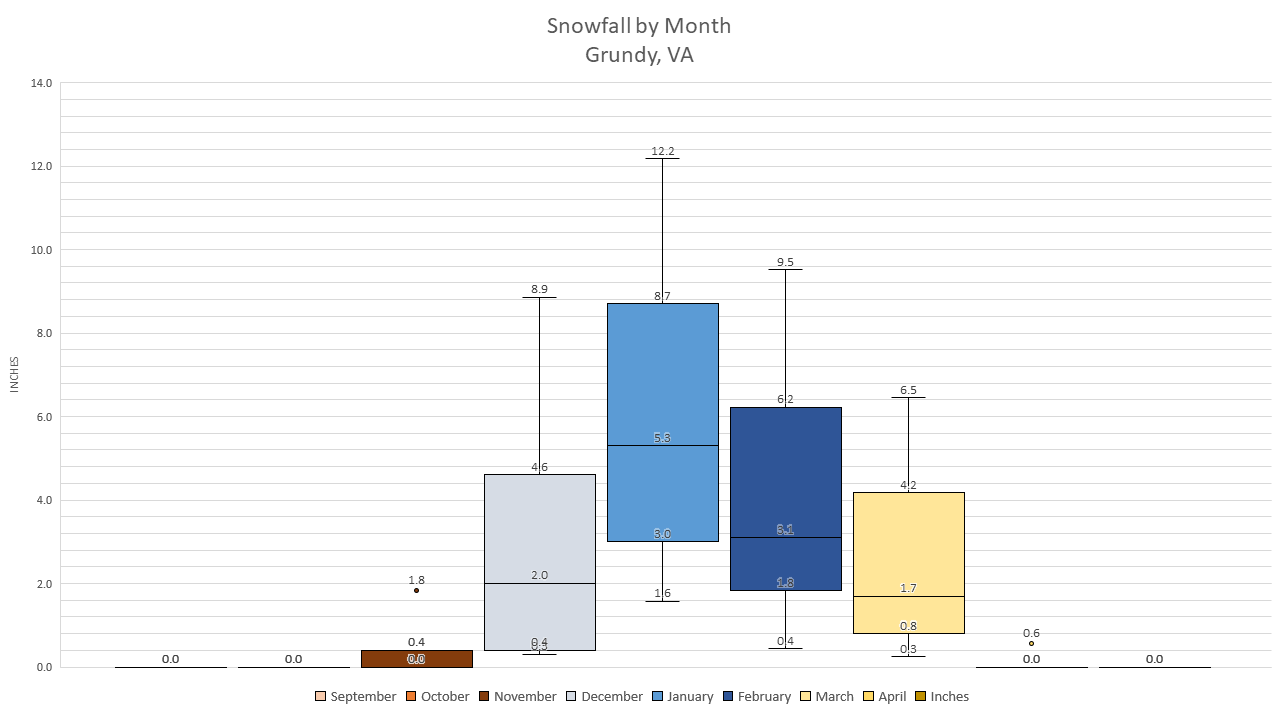
Grundy, VA |
|
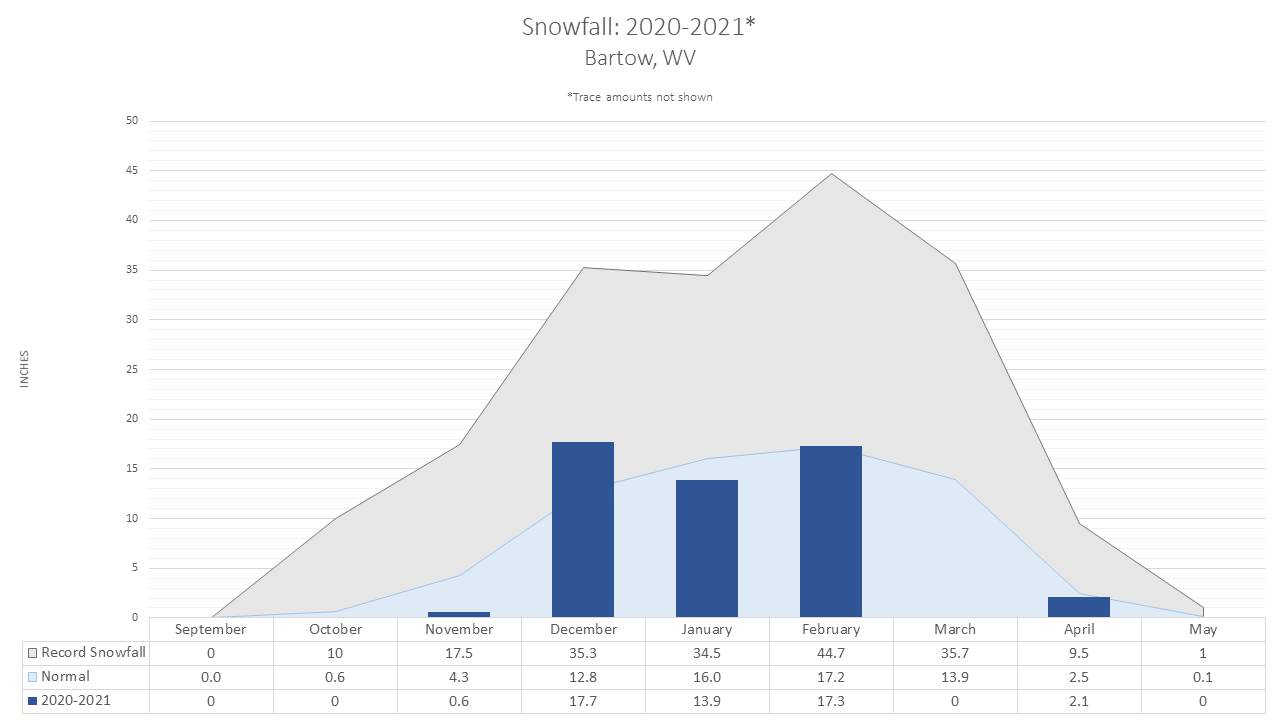
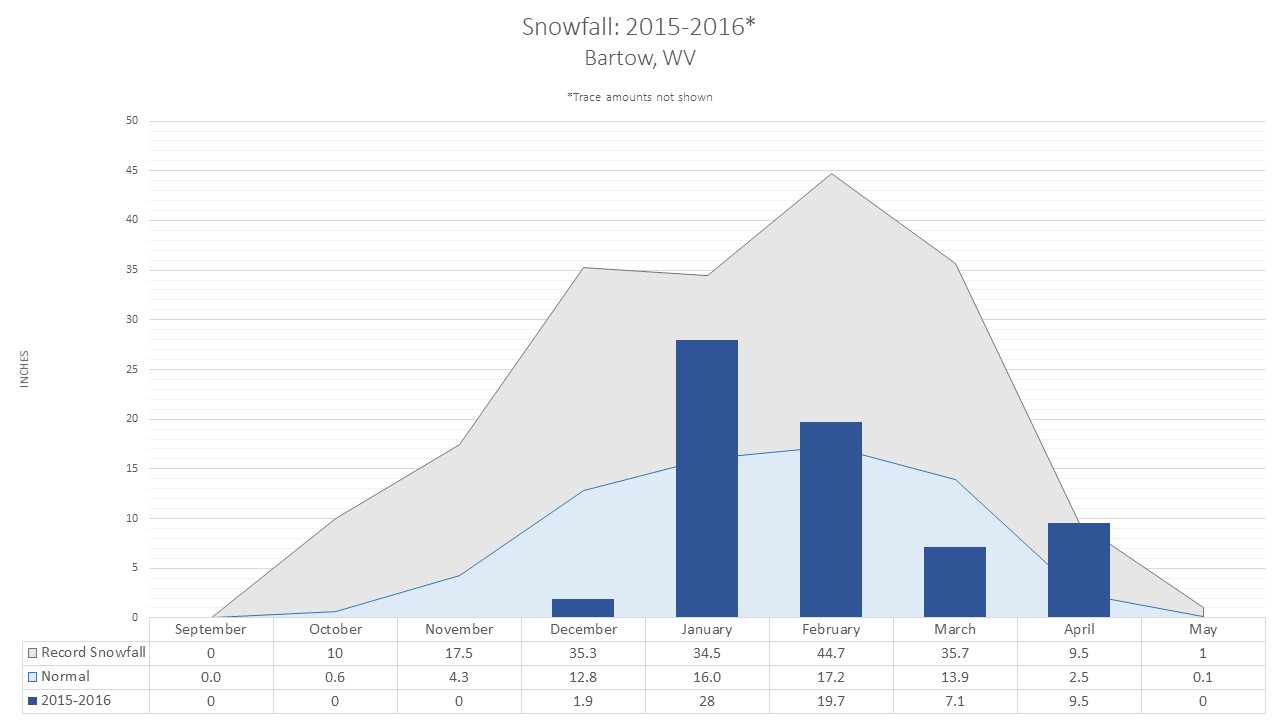
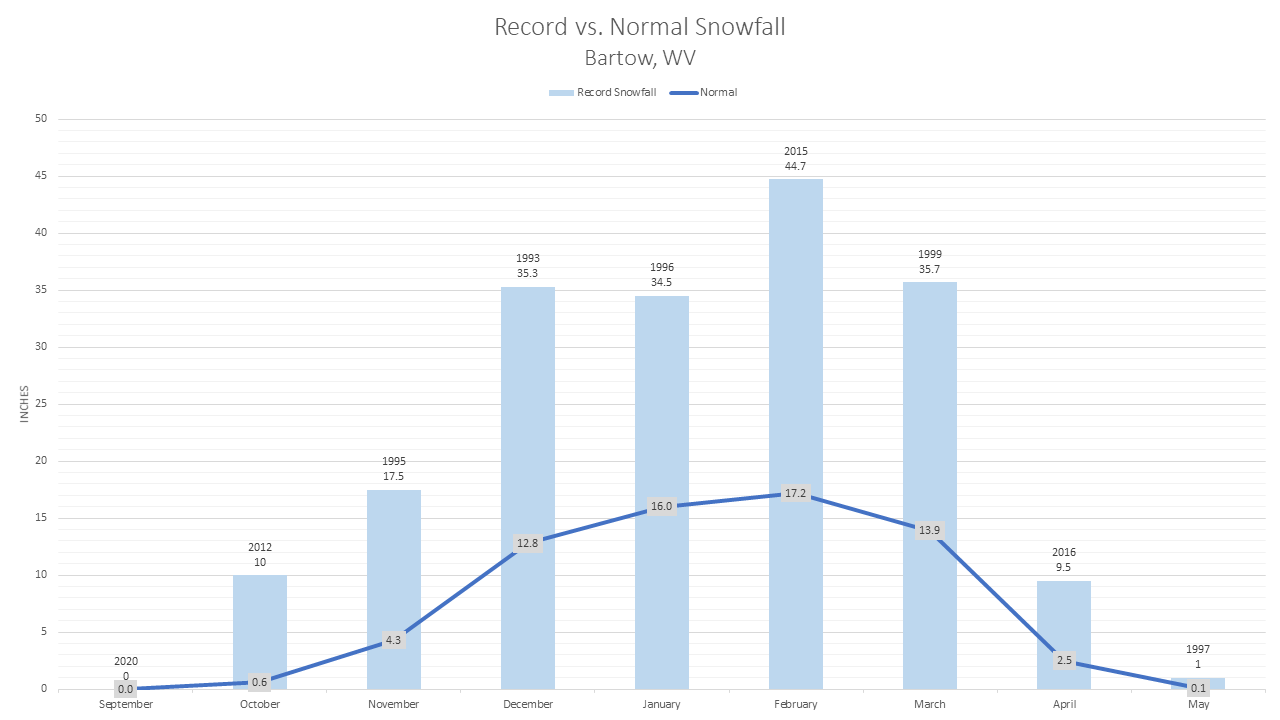
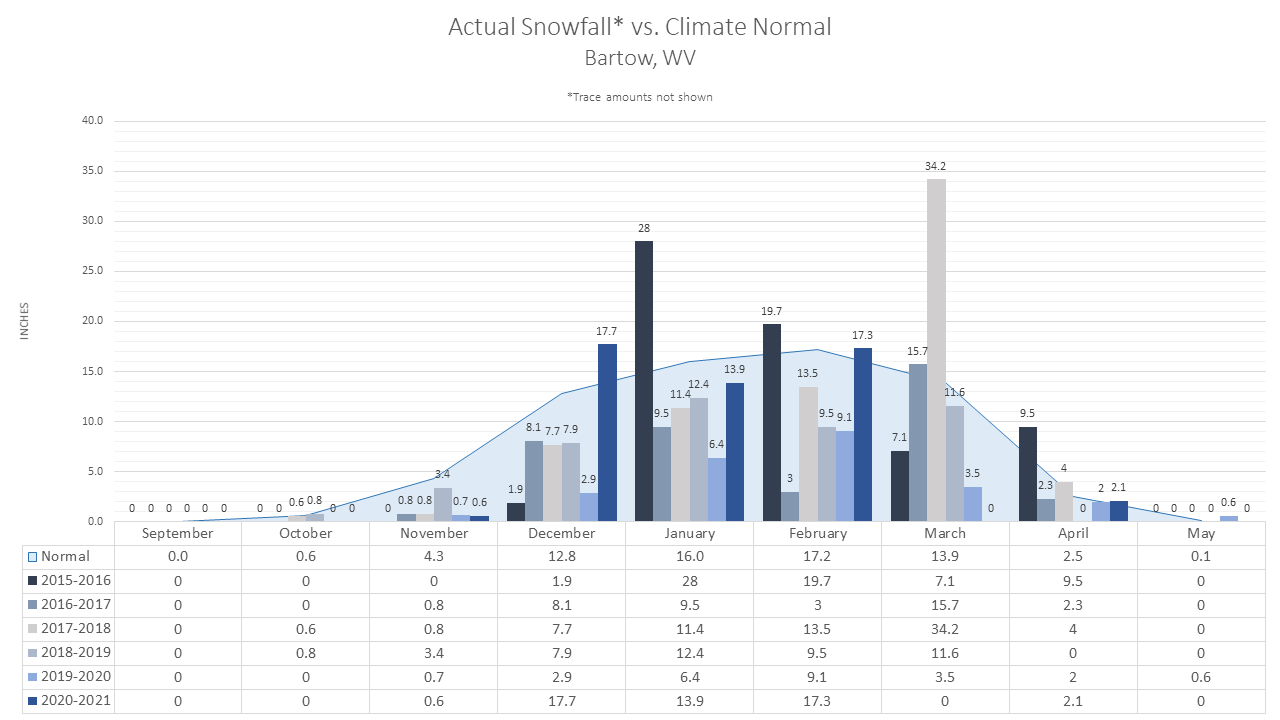
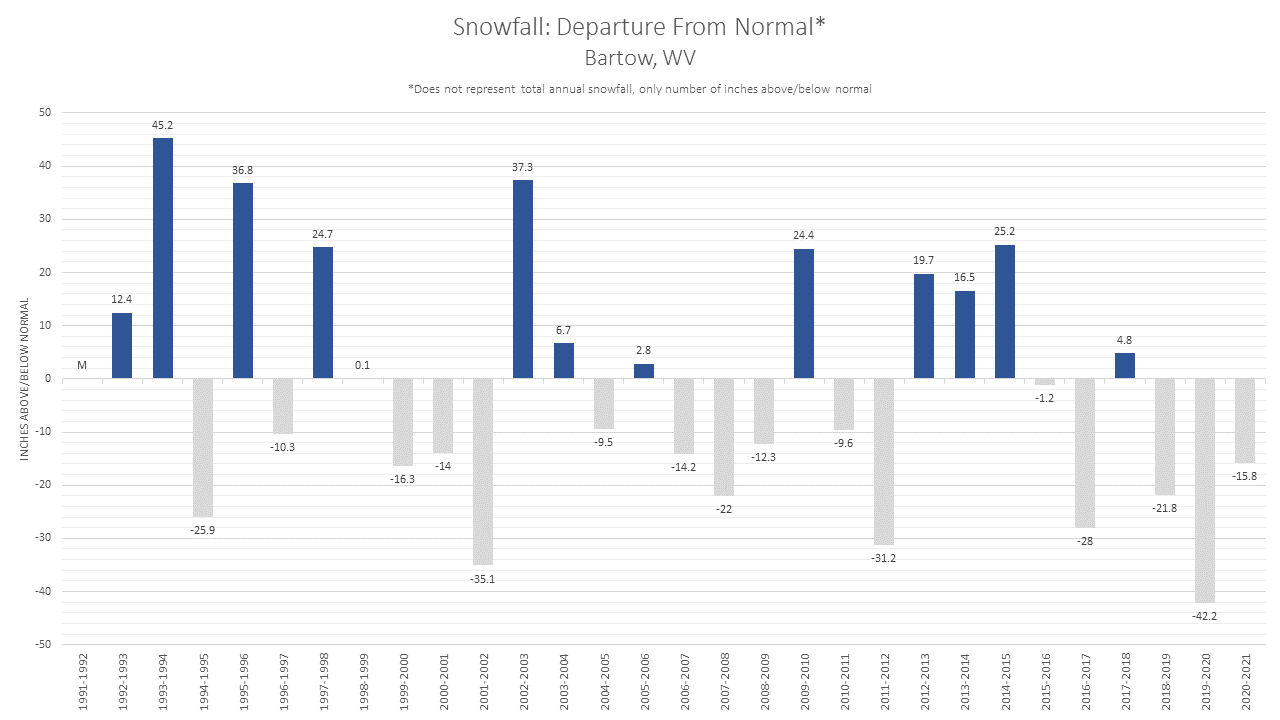
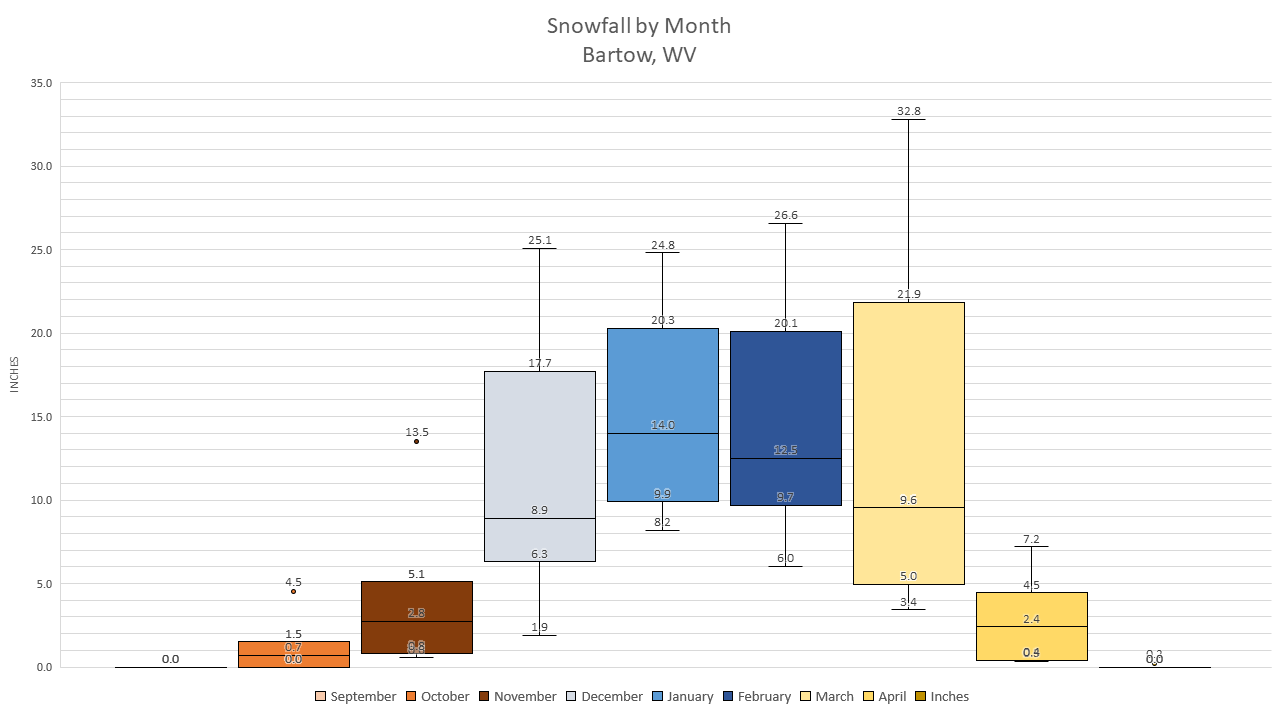
Bartow, WV |
||||||
|
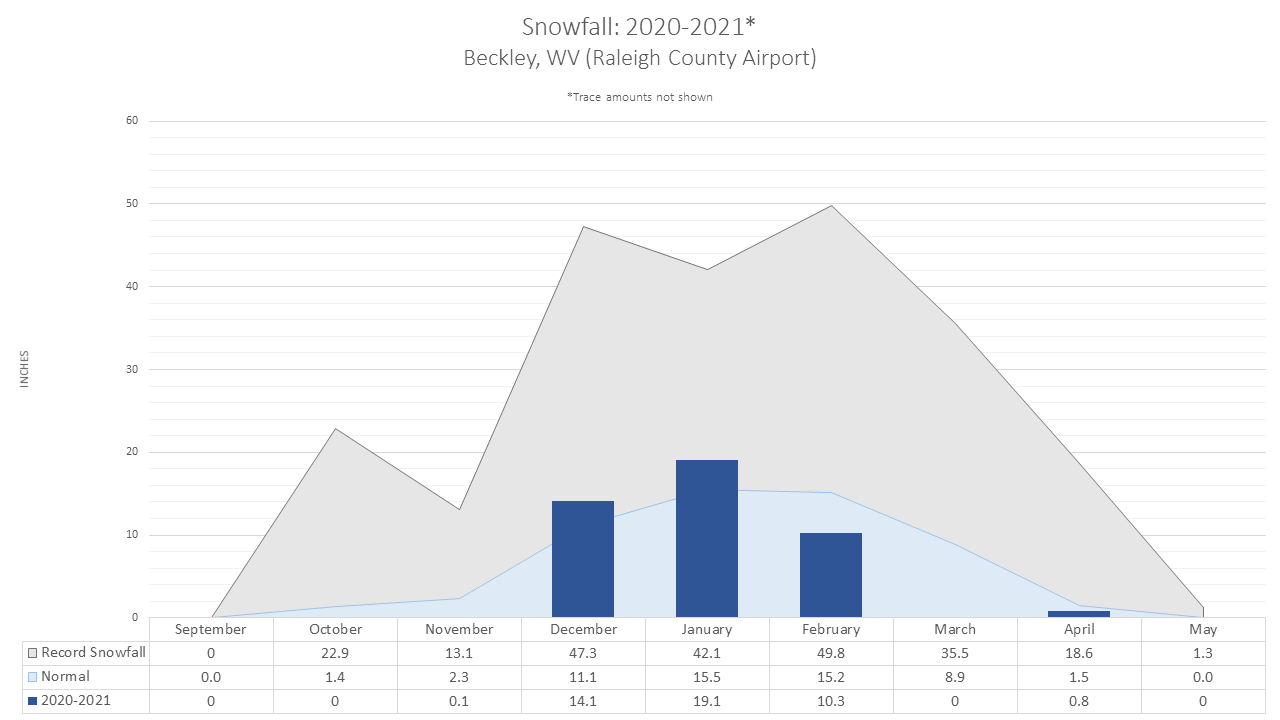
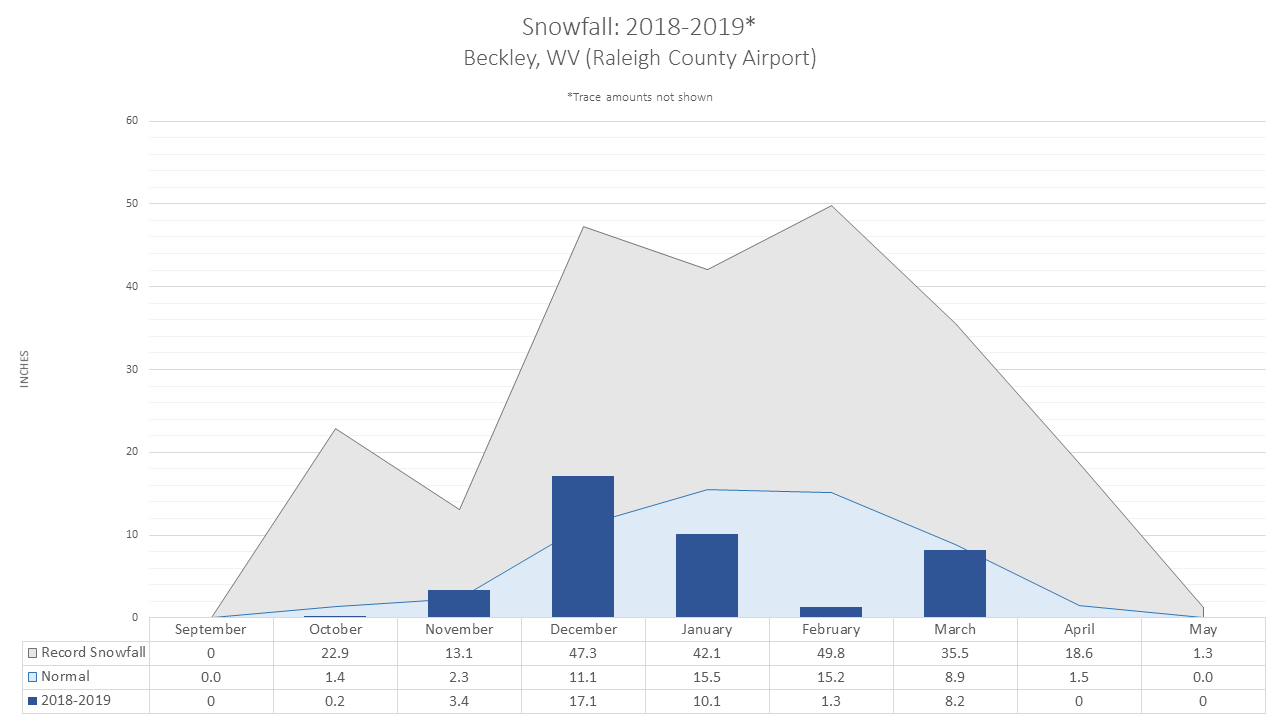
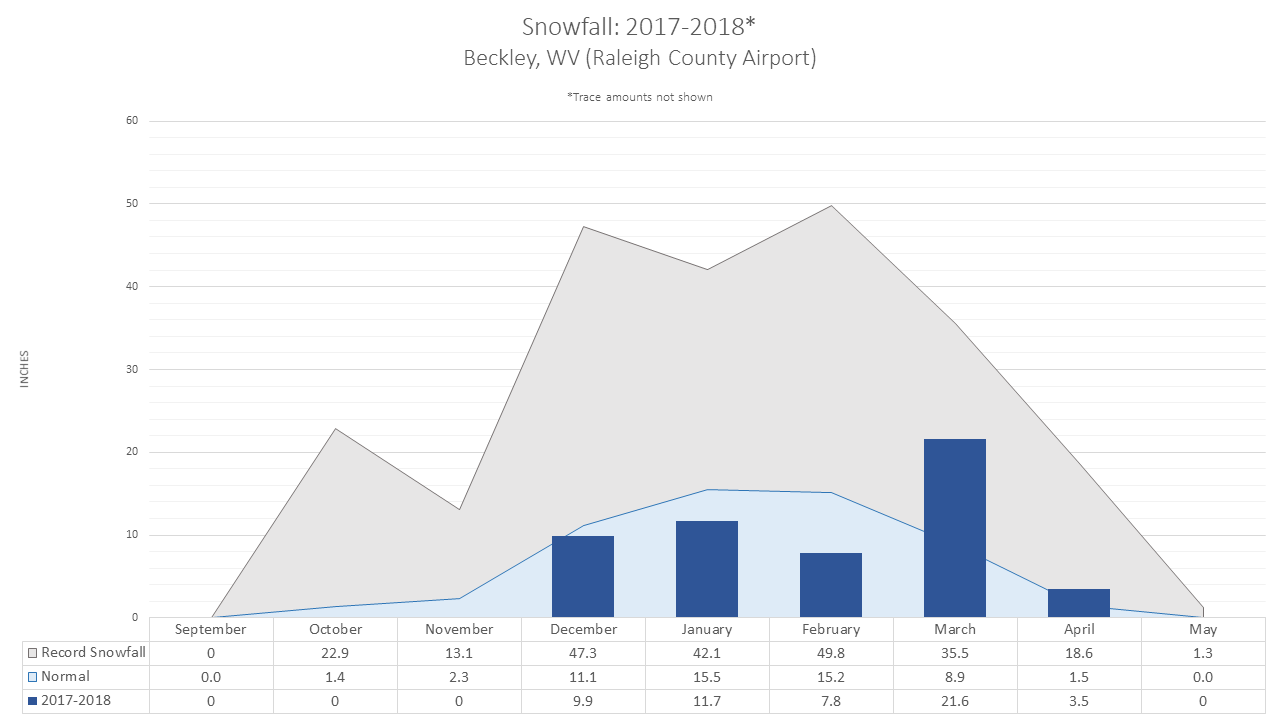
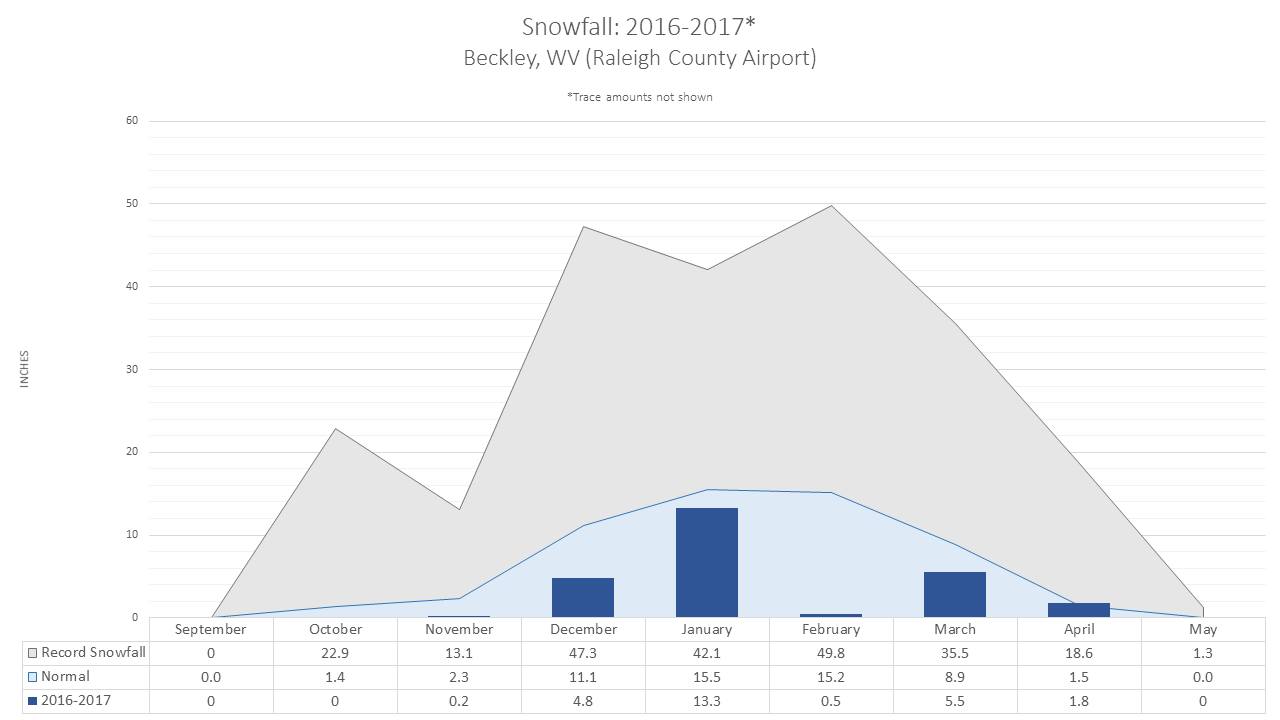
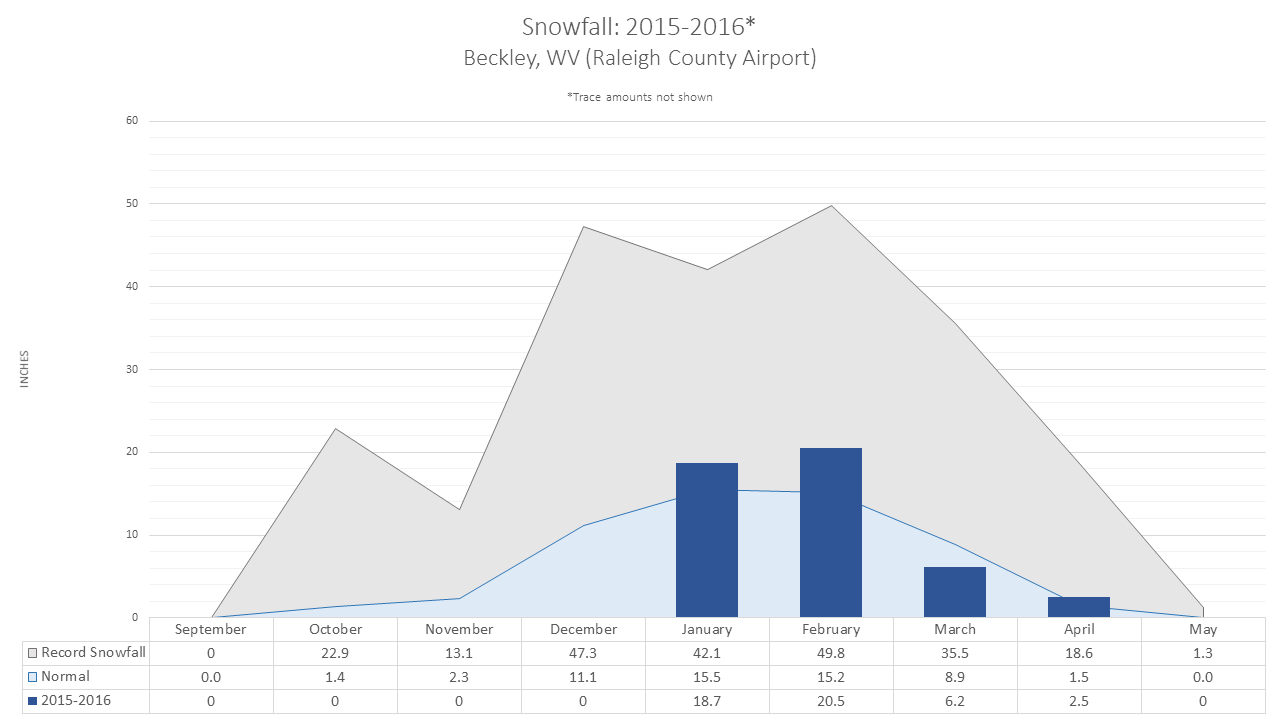
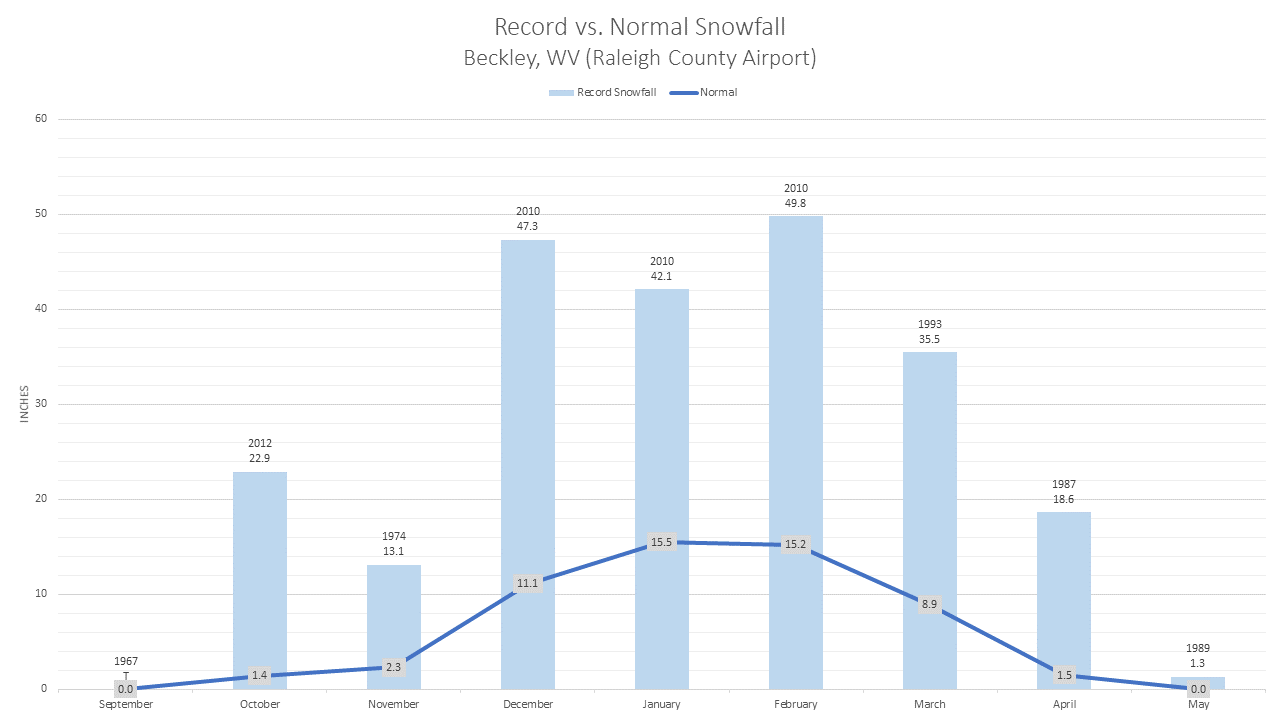
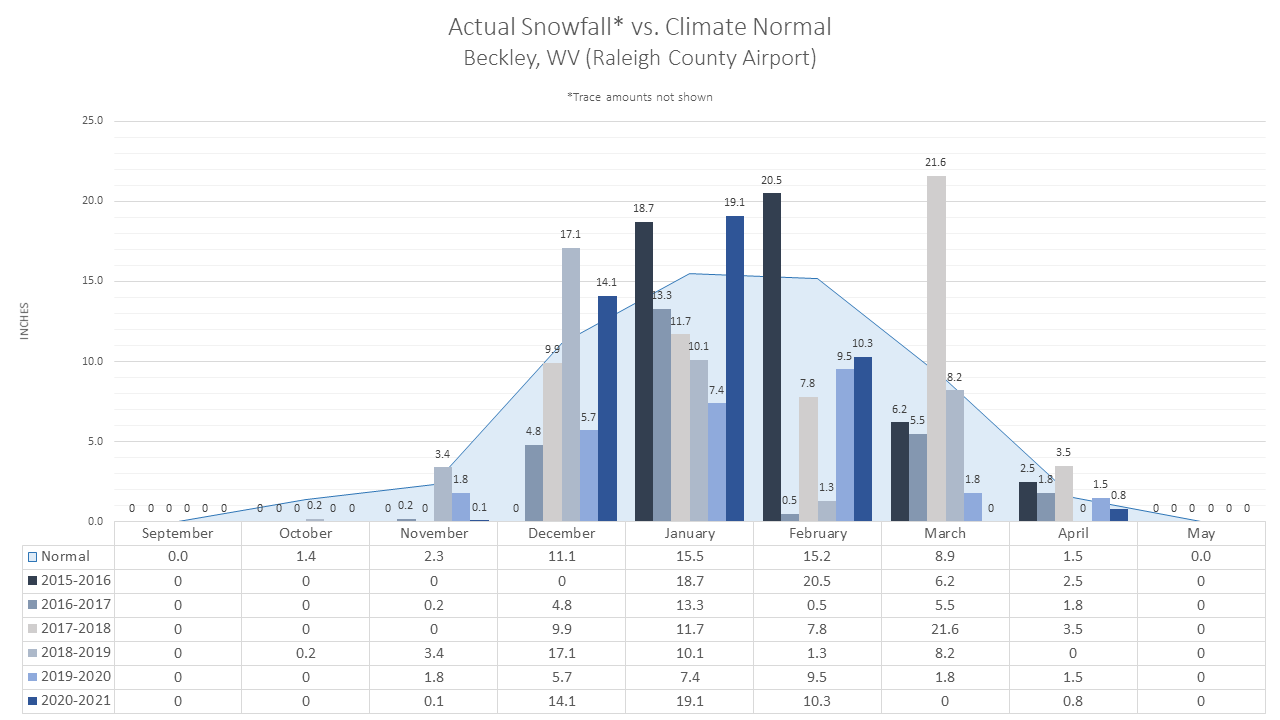
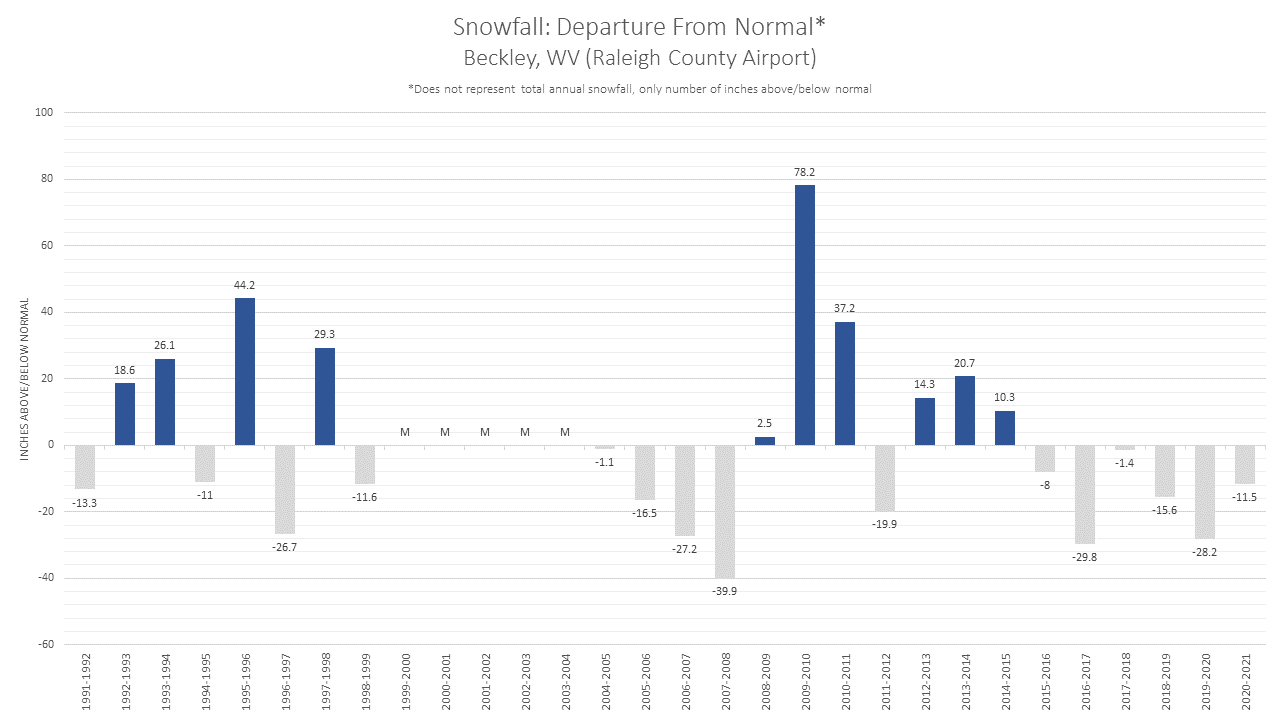
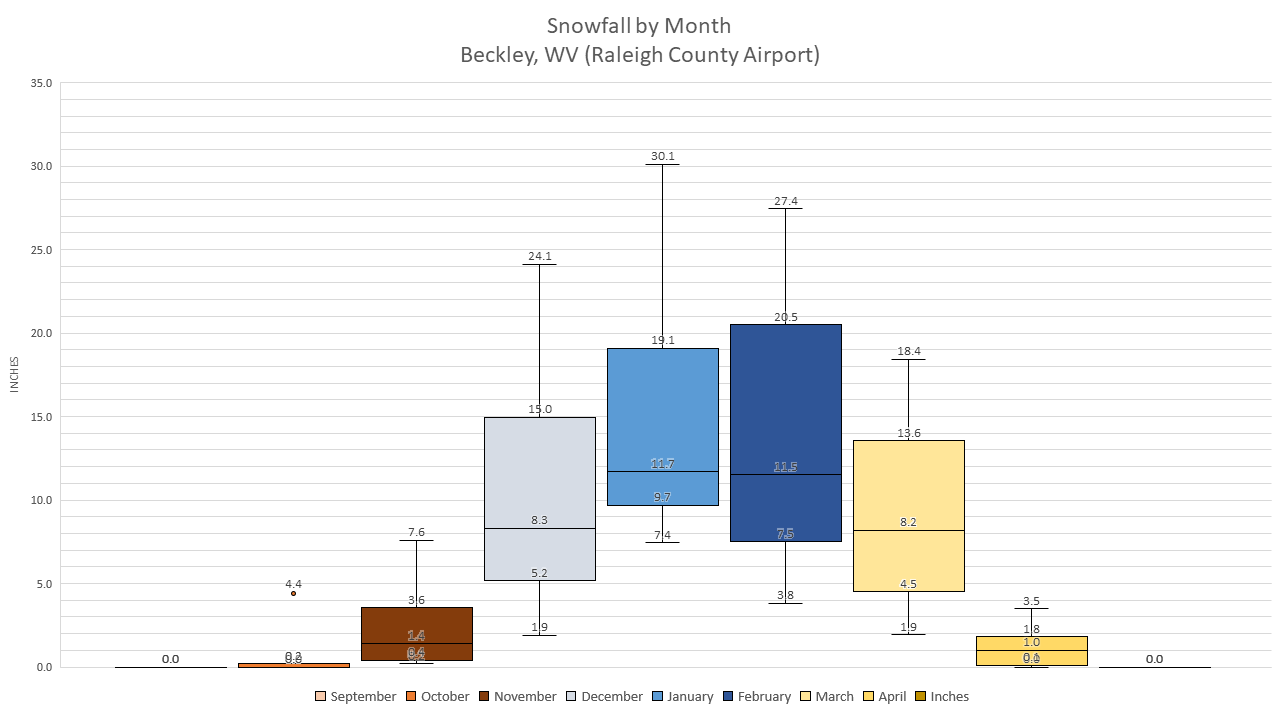
Beckley, WV (Raleigh County Memorial Airport) |
||||||
|
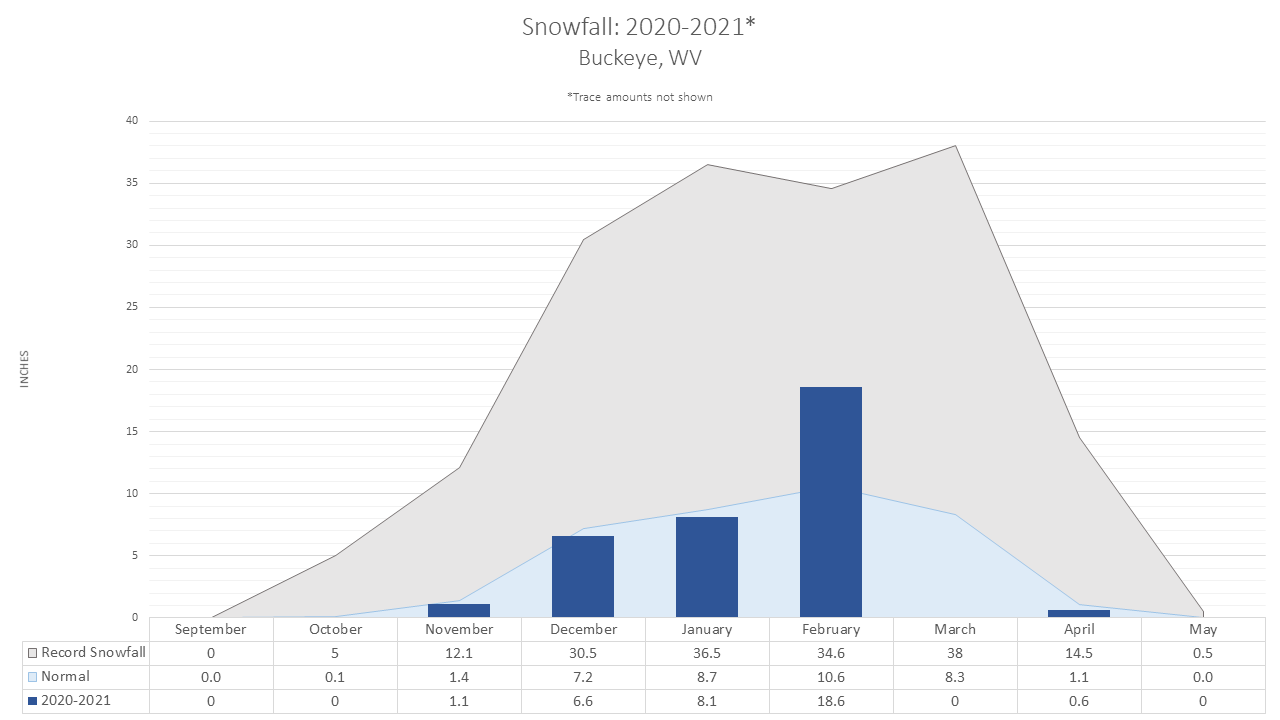
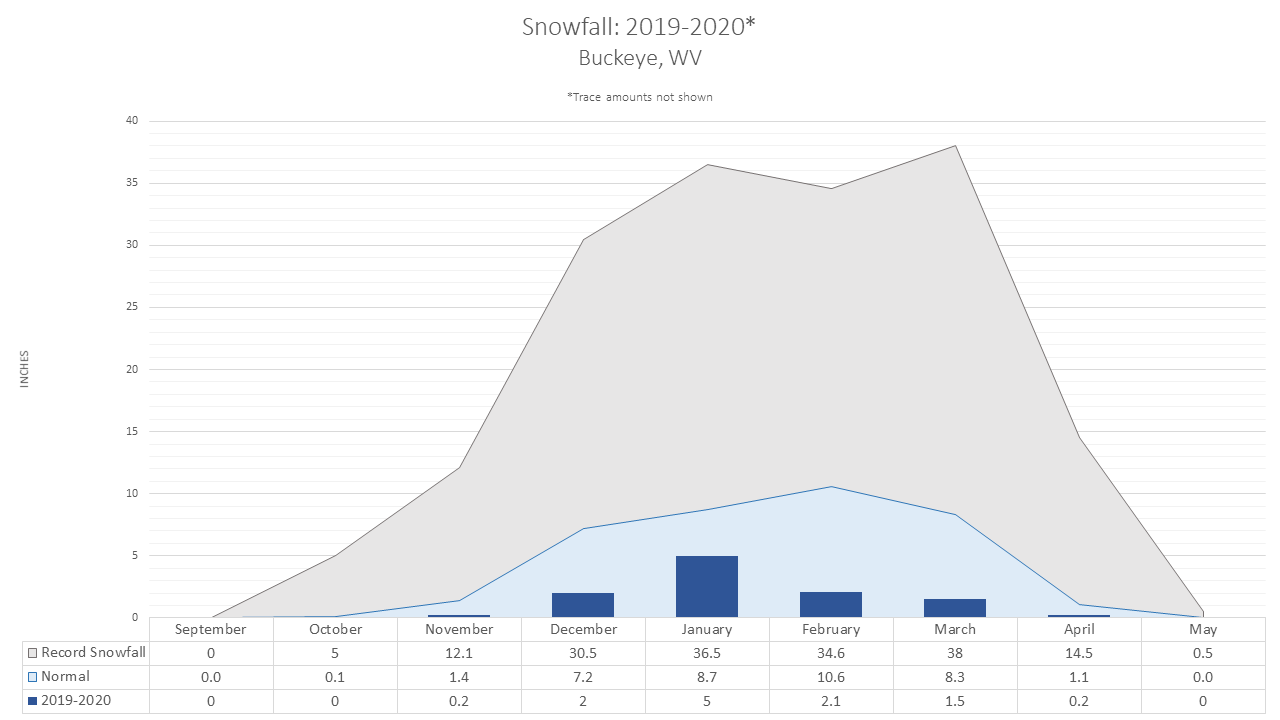
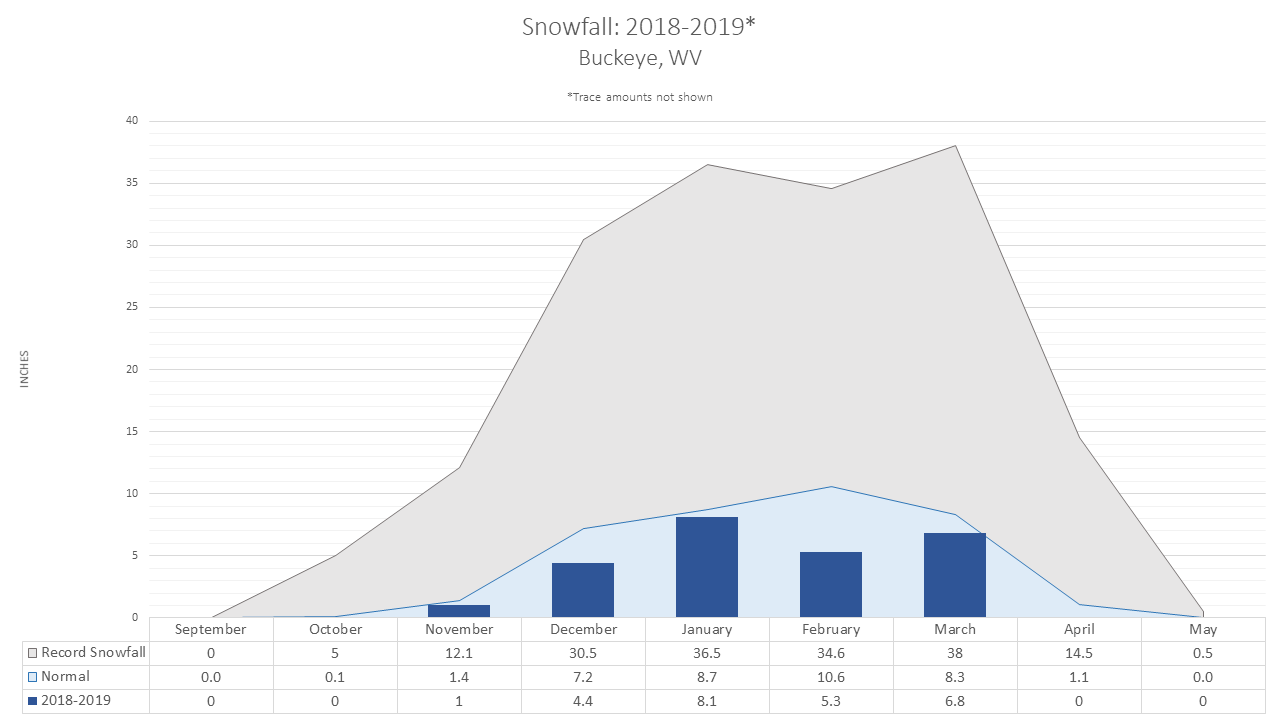
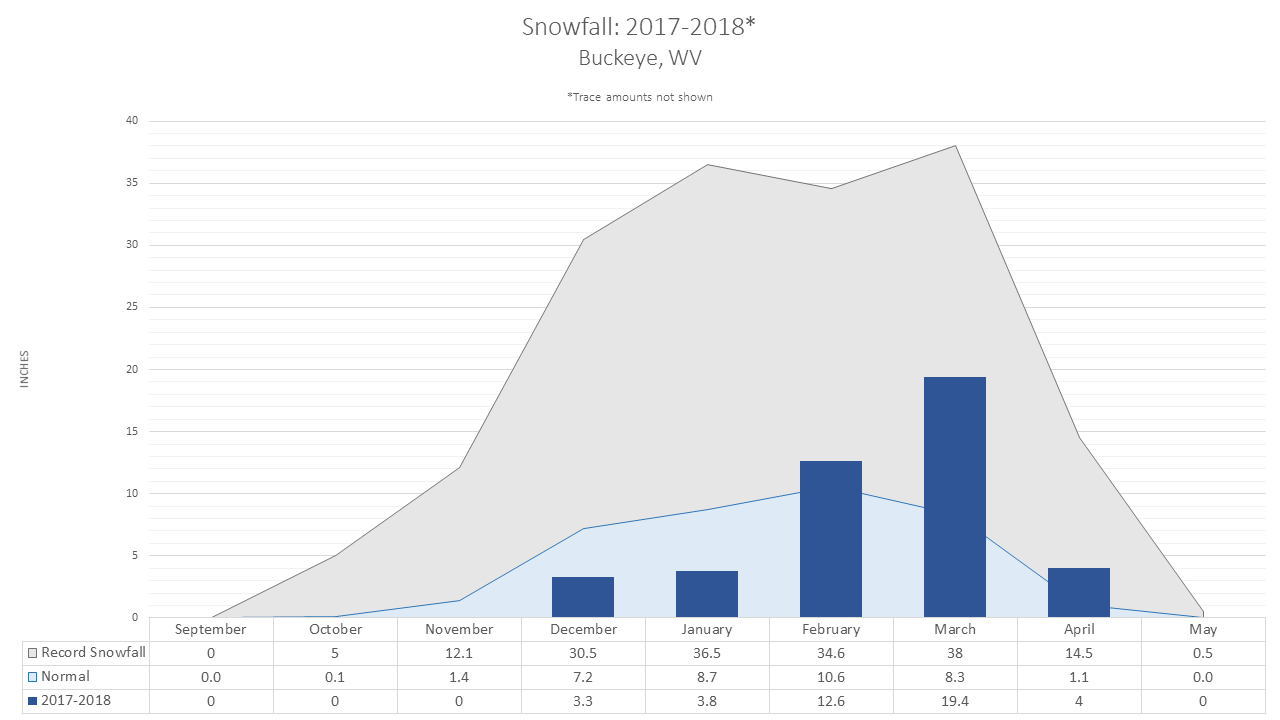
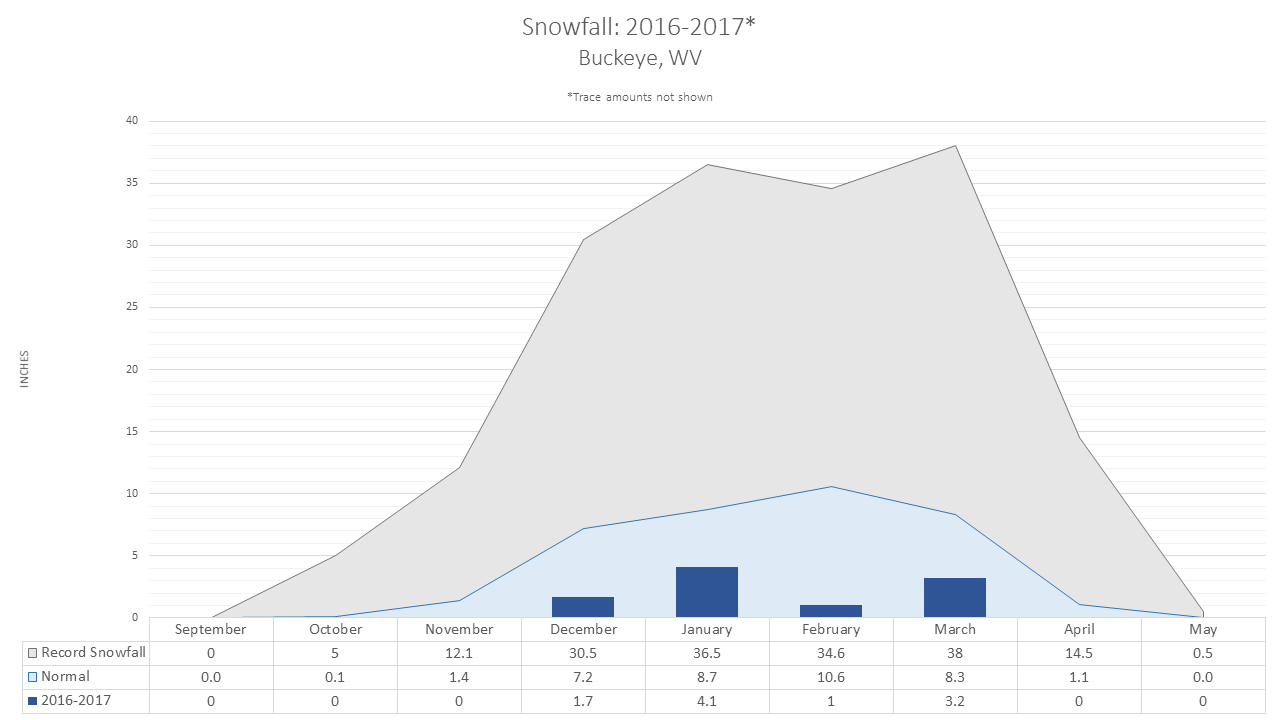
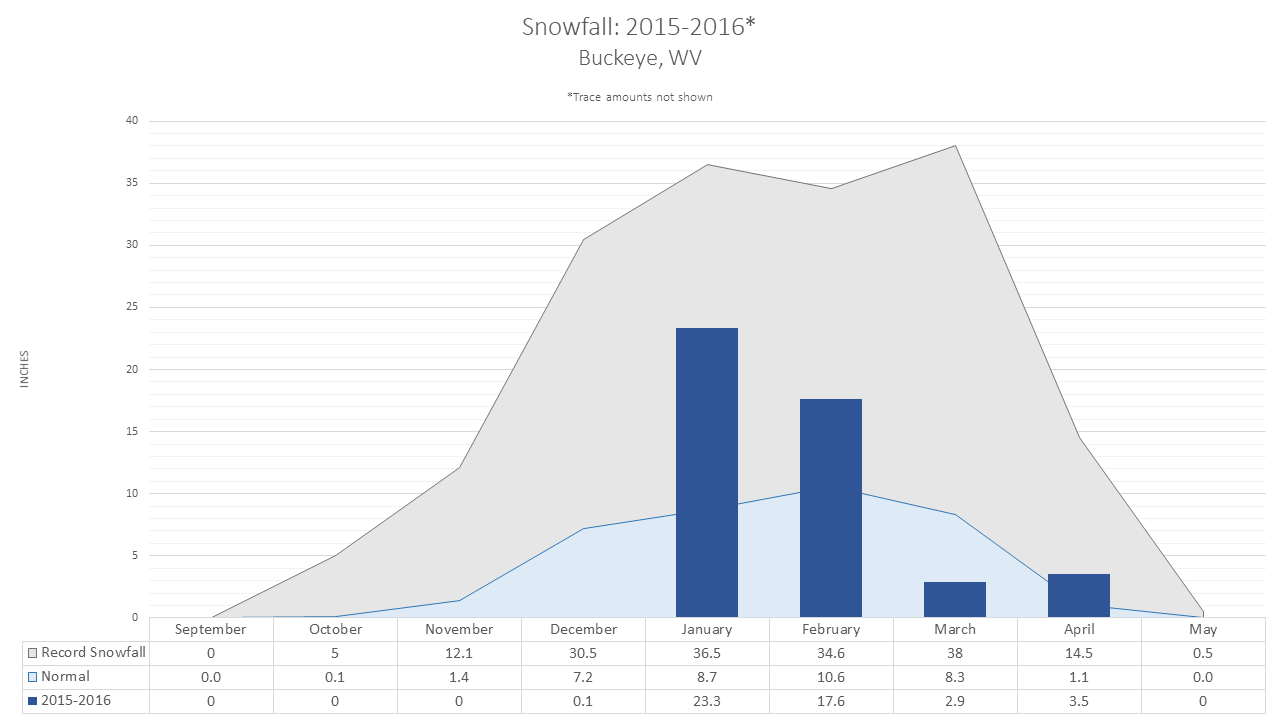
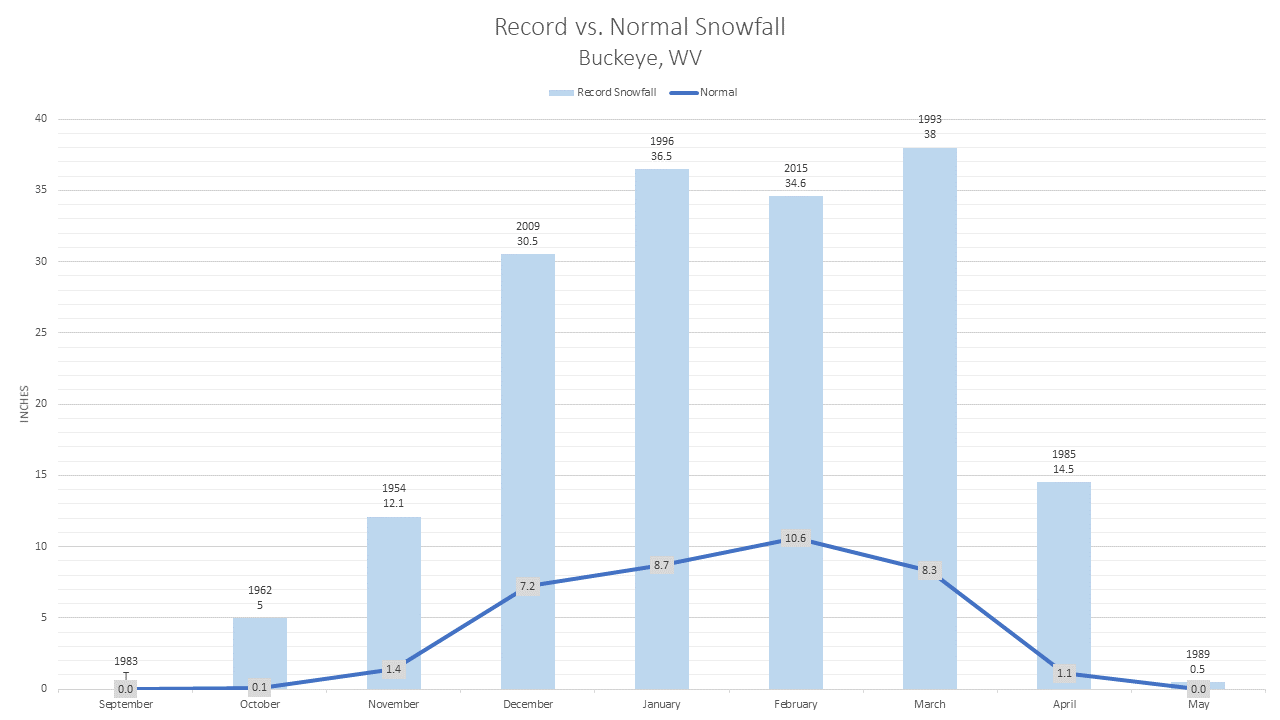
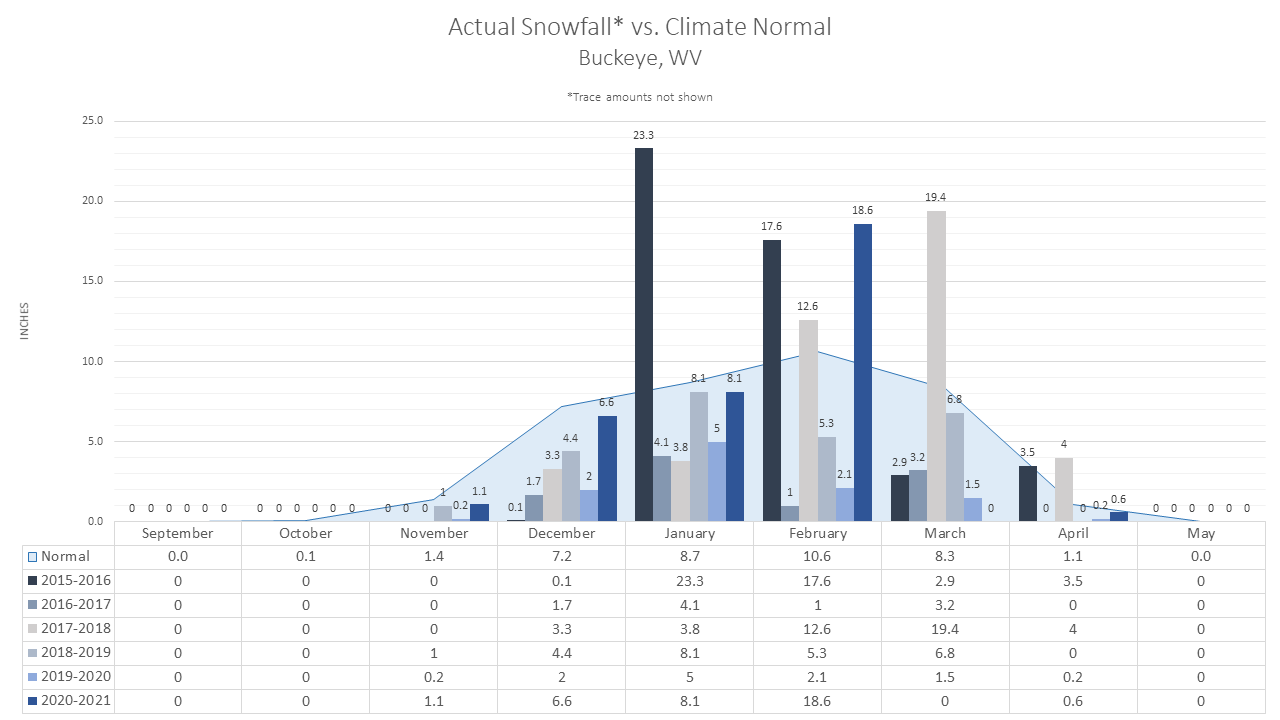
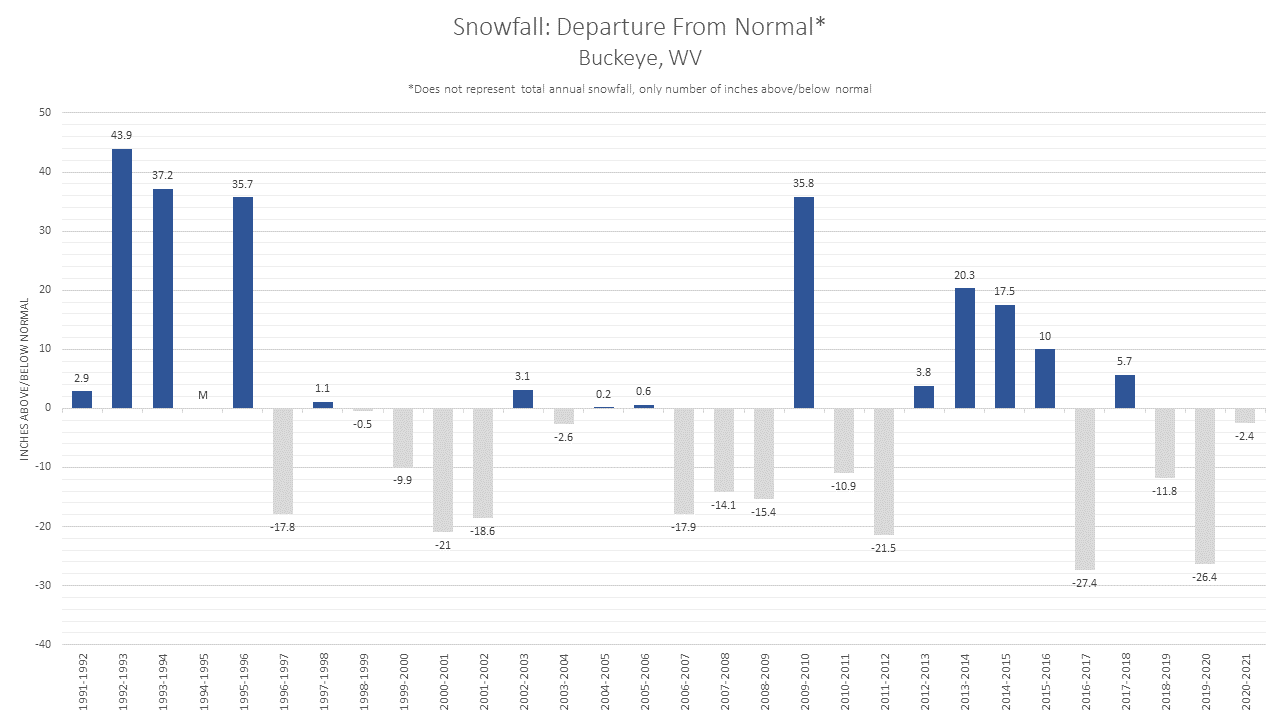
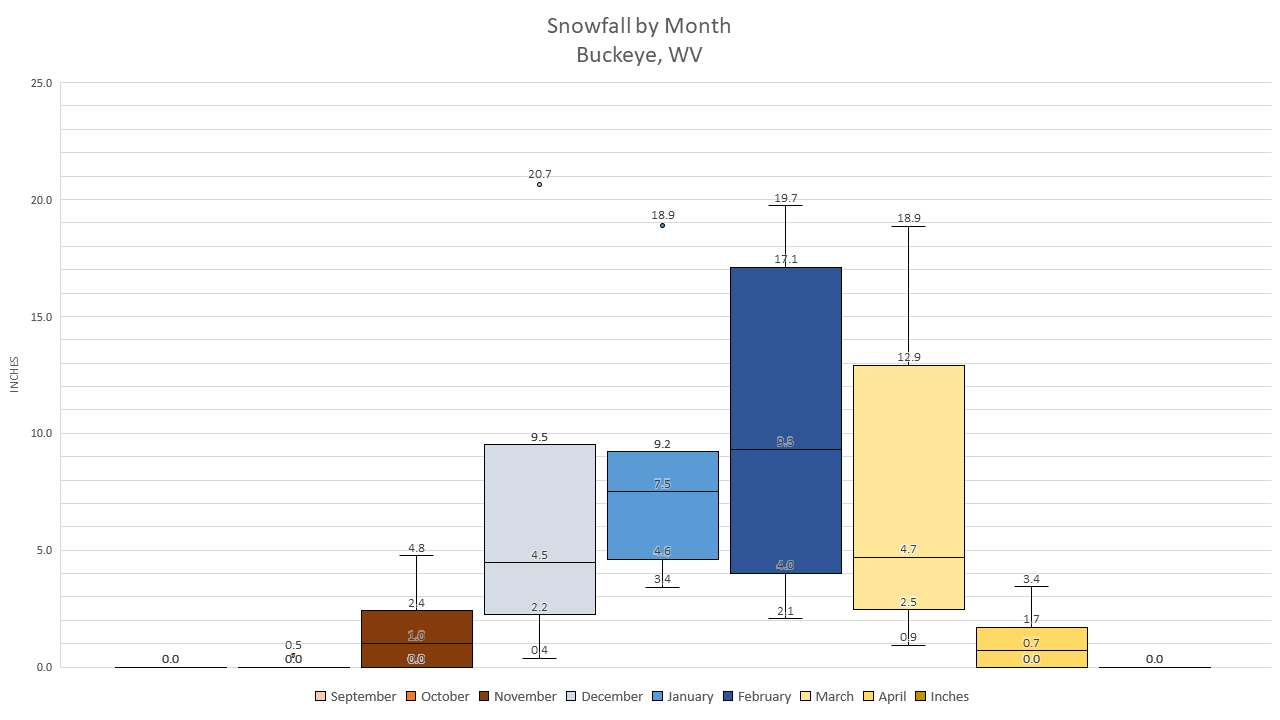
Buckeye, WV |
||||||
|
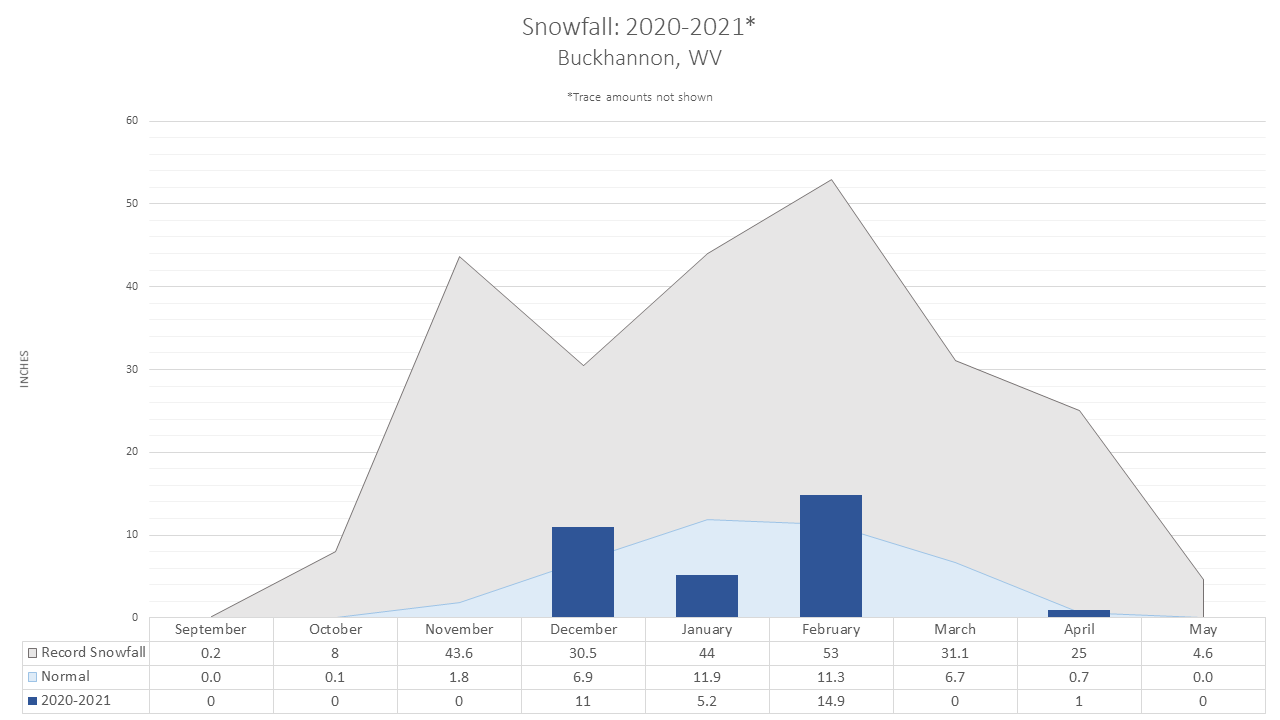
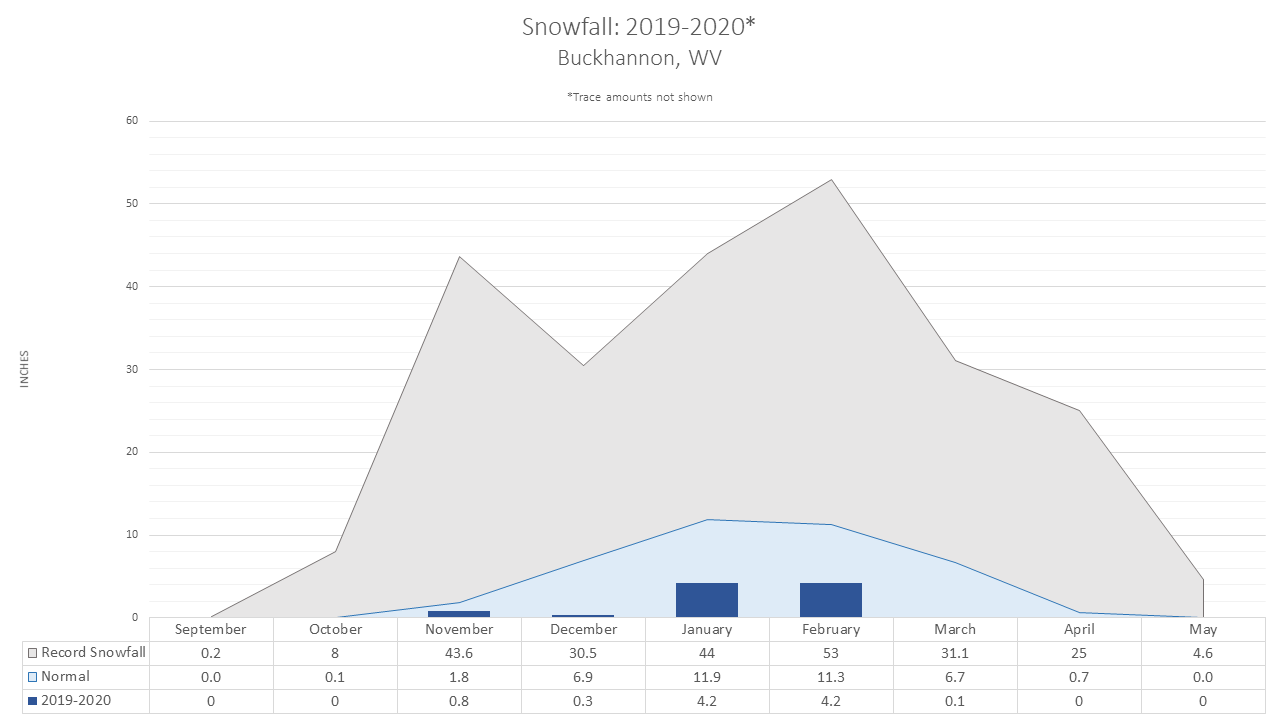
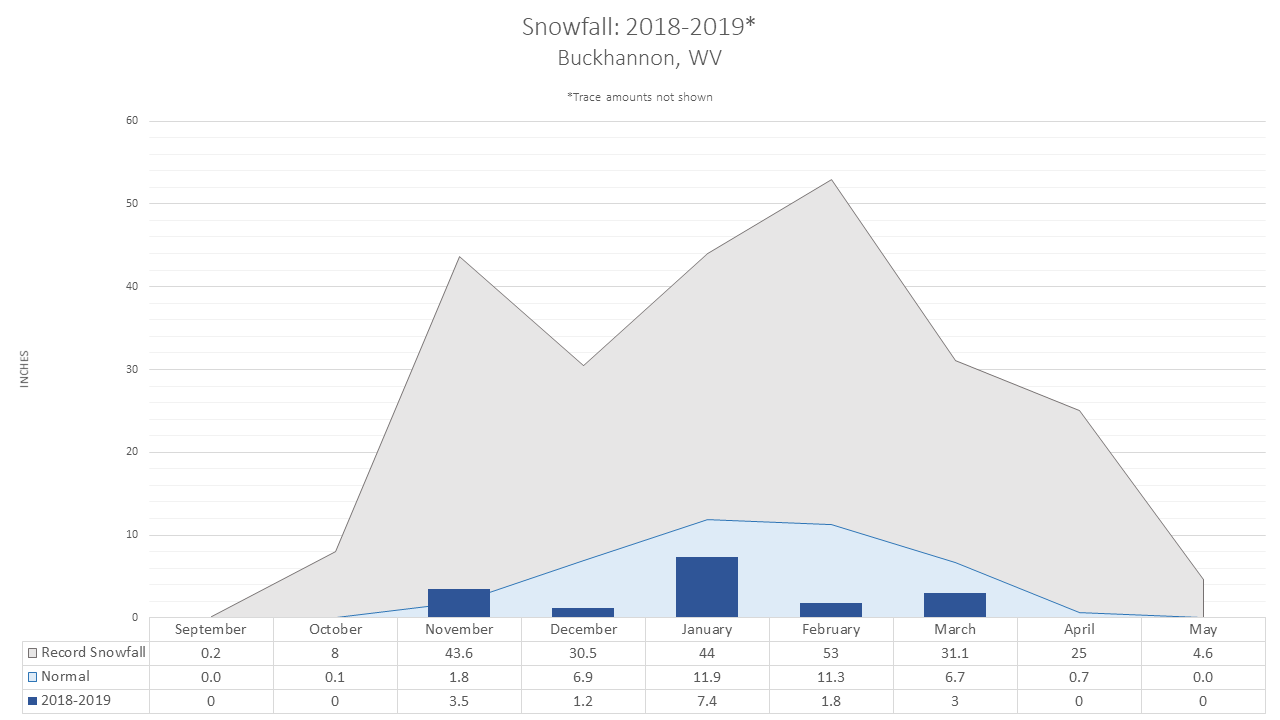
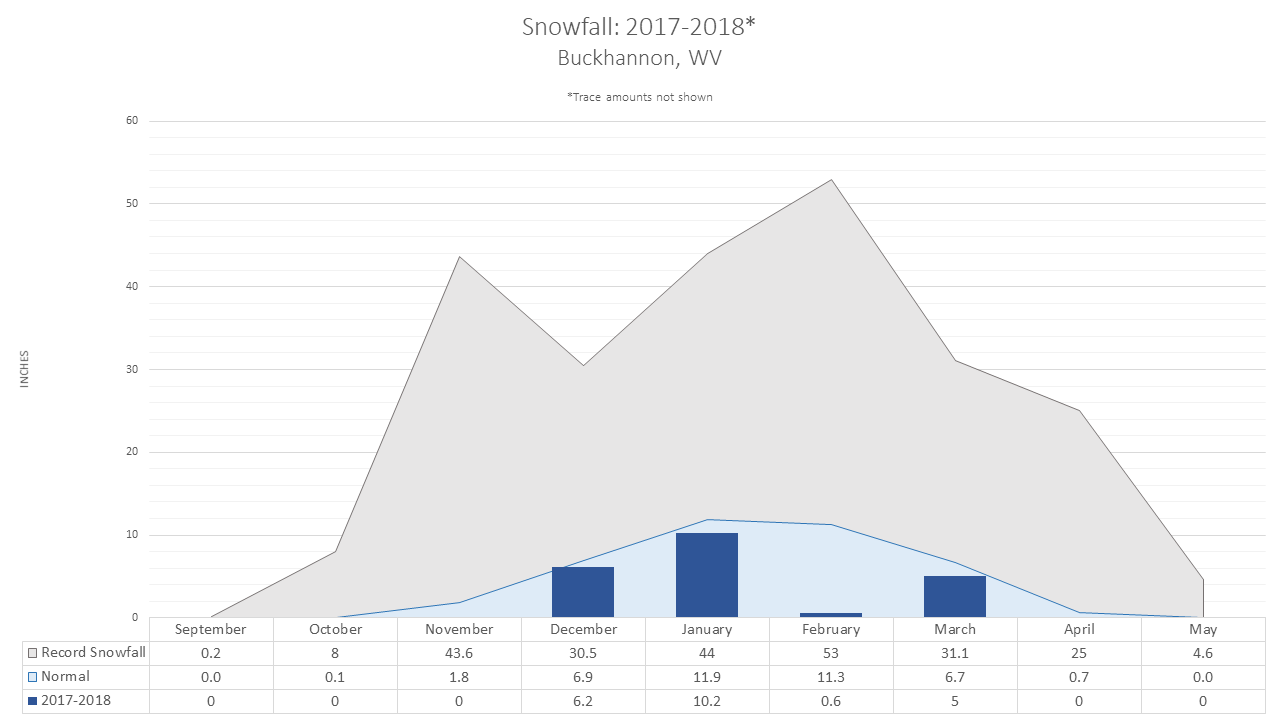
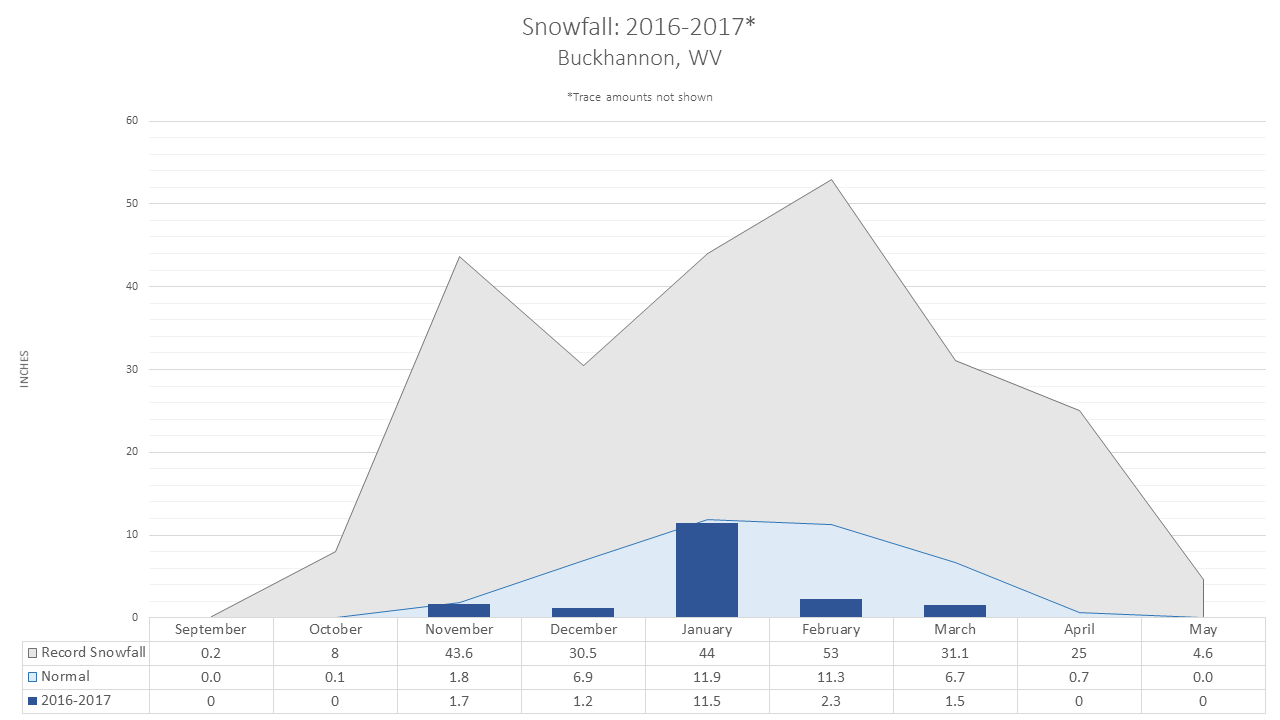
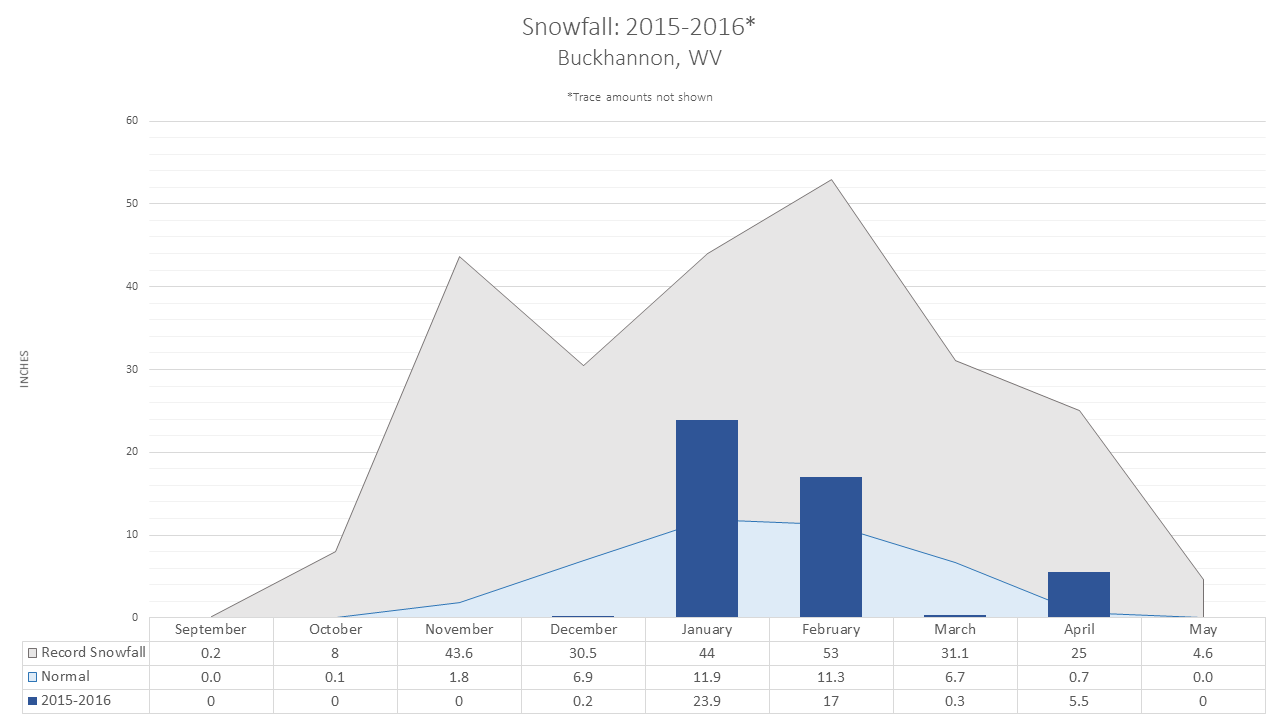
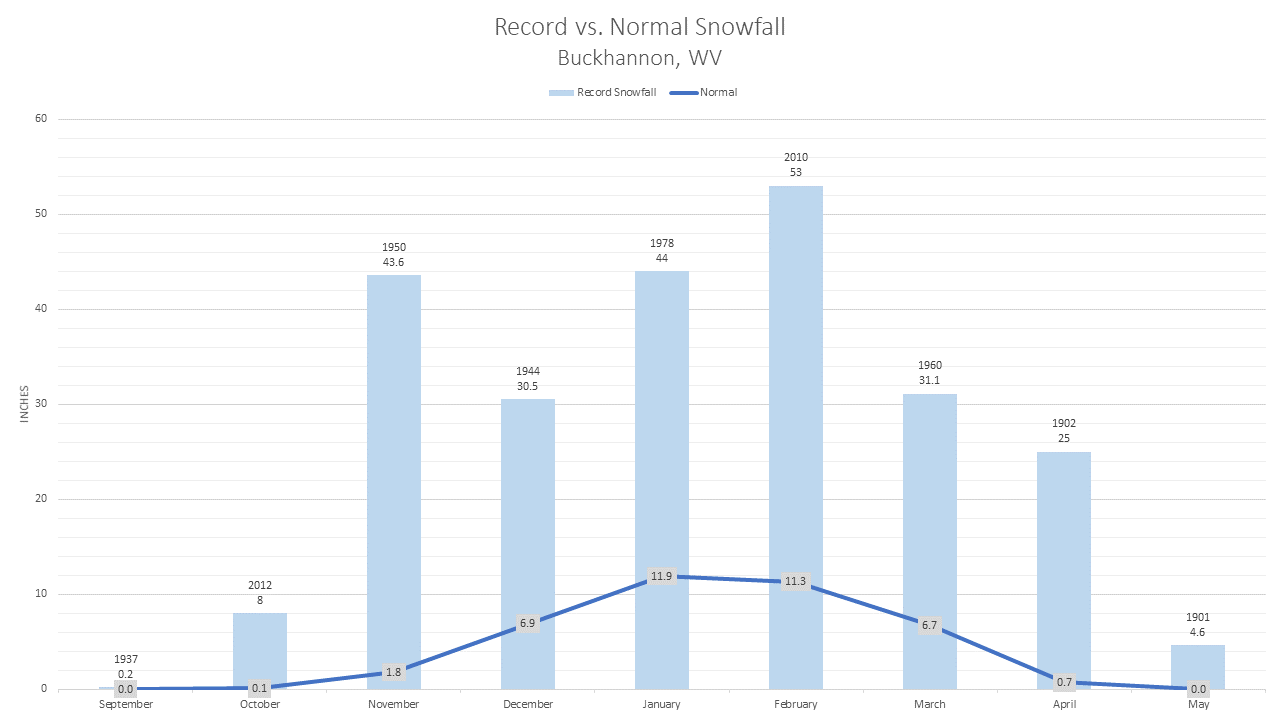
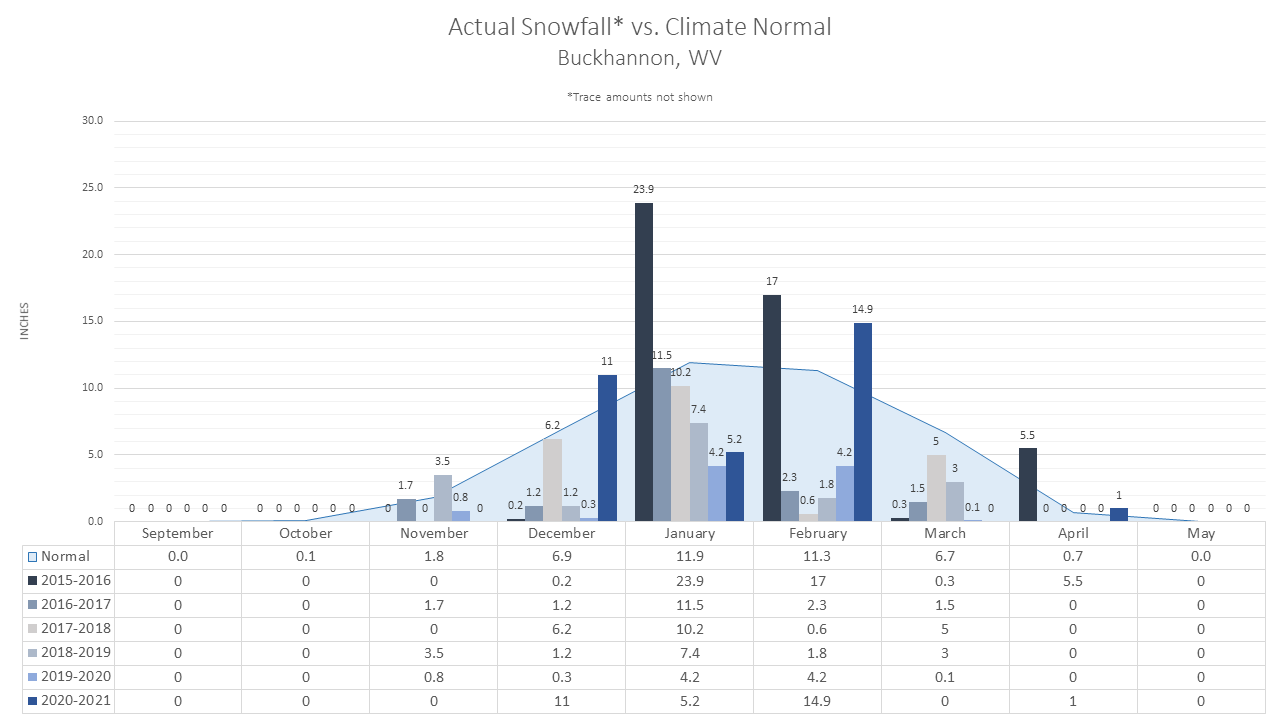
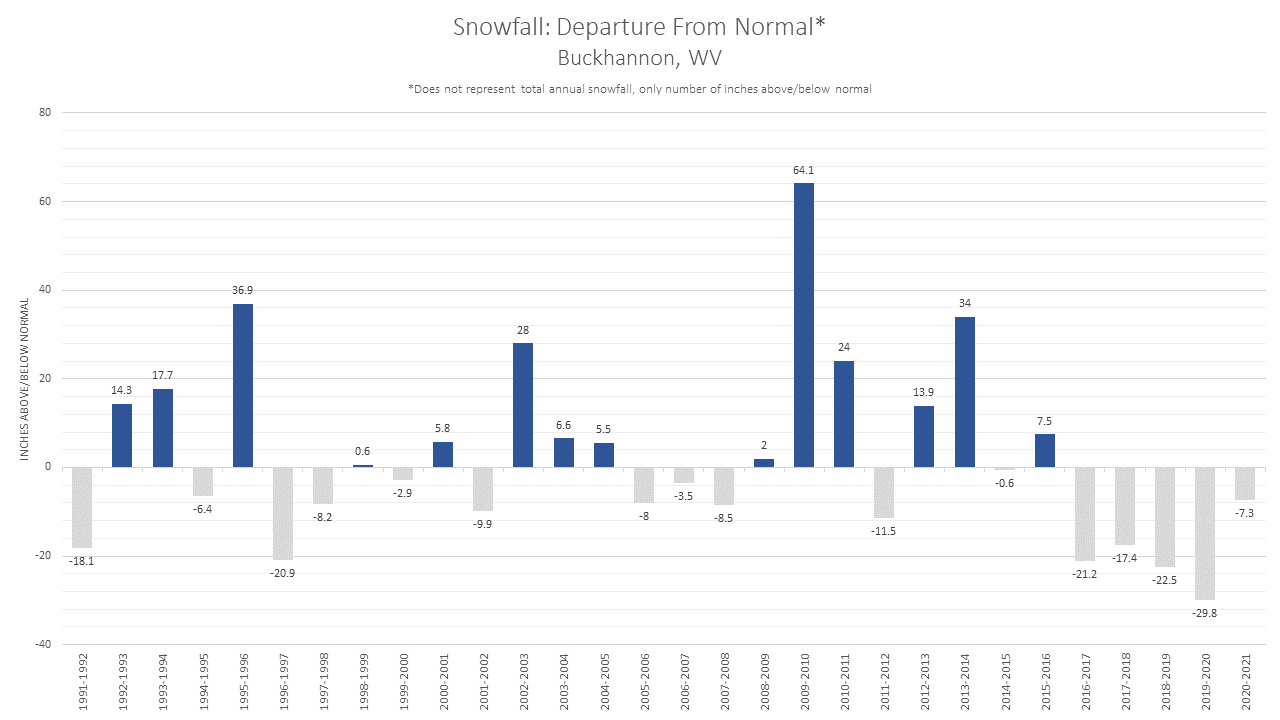
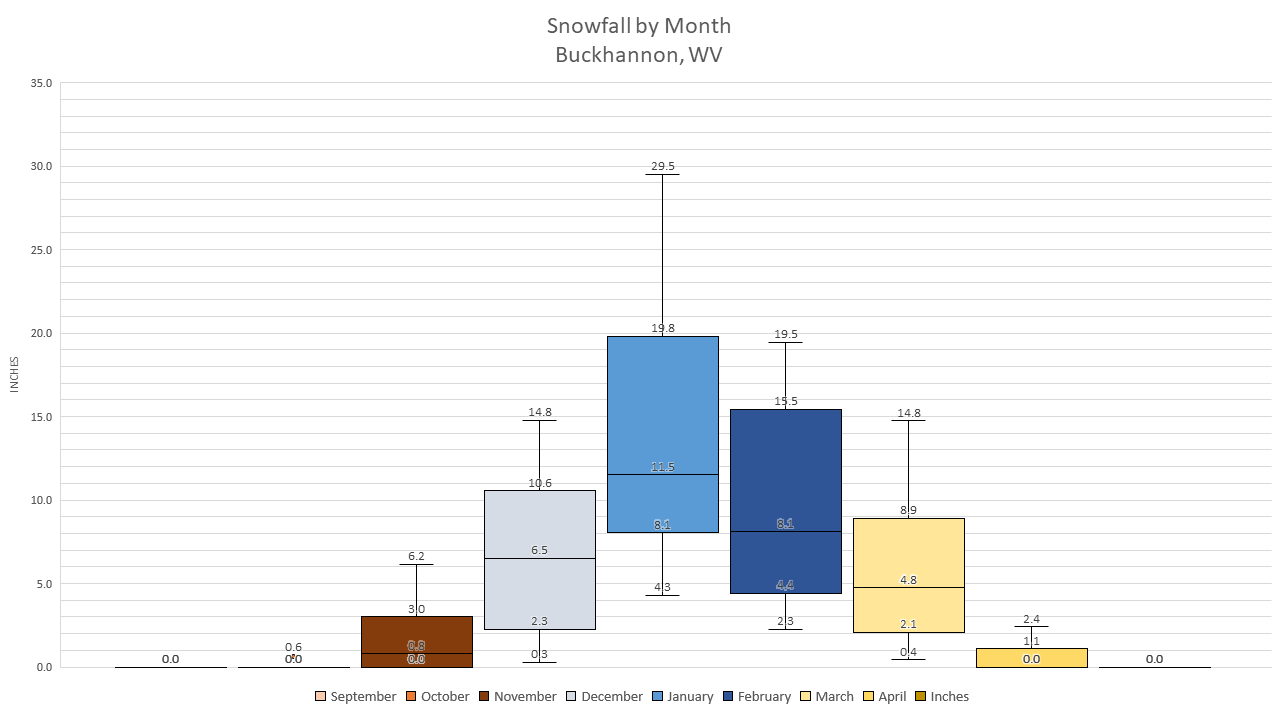
Buckhannon, WV |
||||||
|
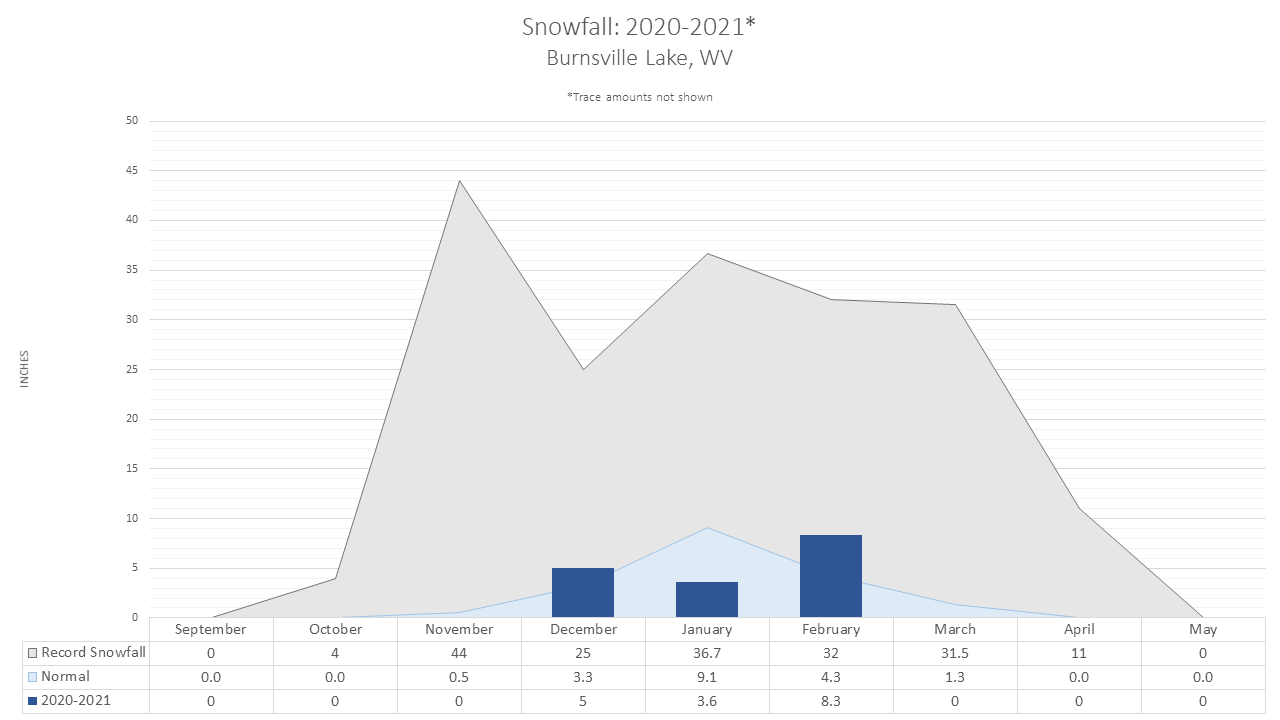
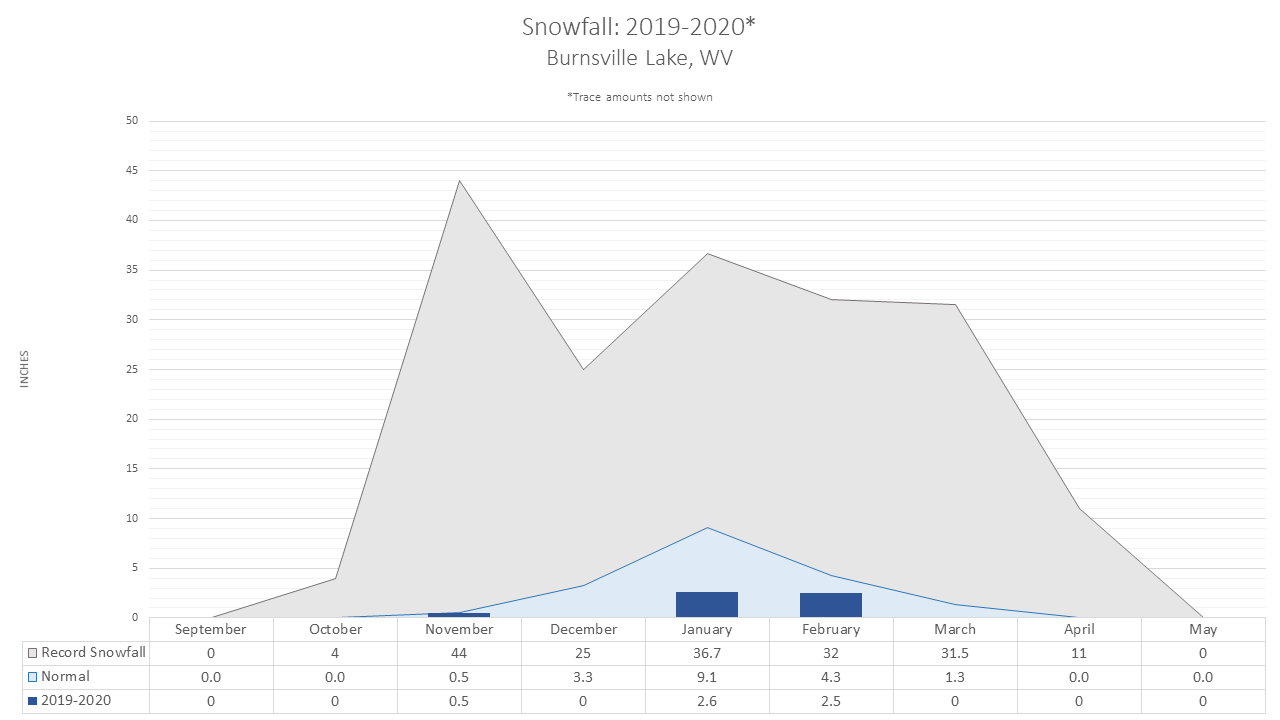
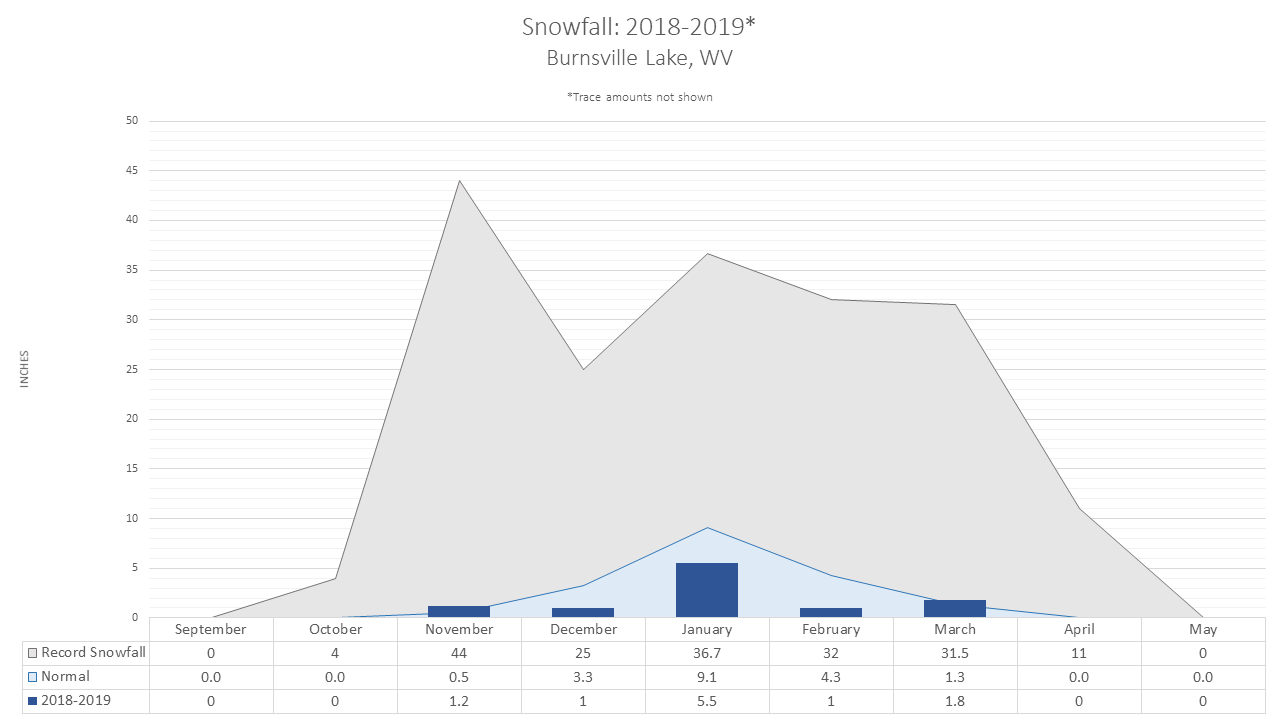
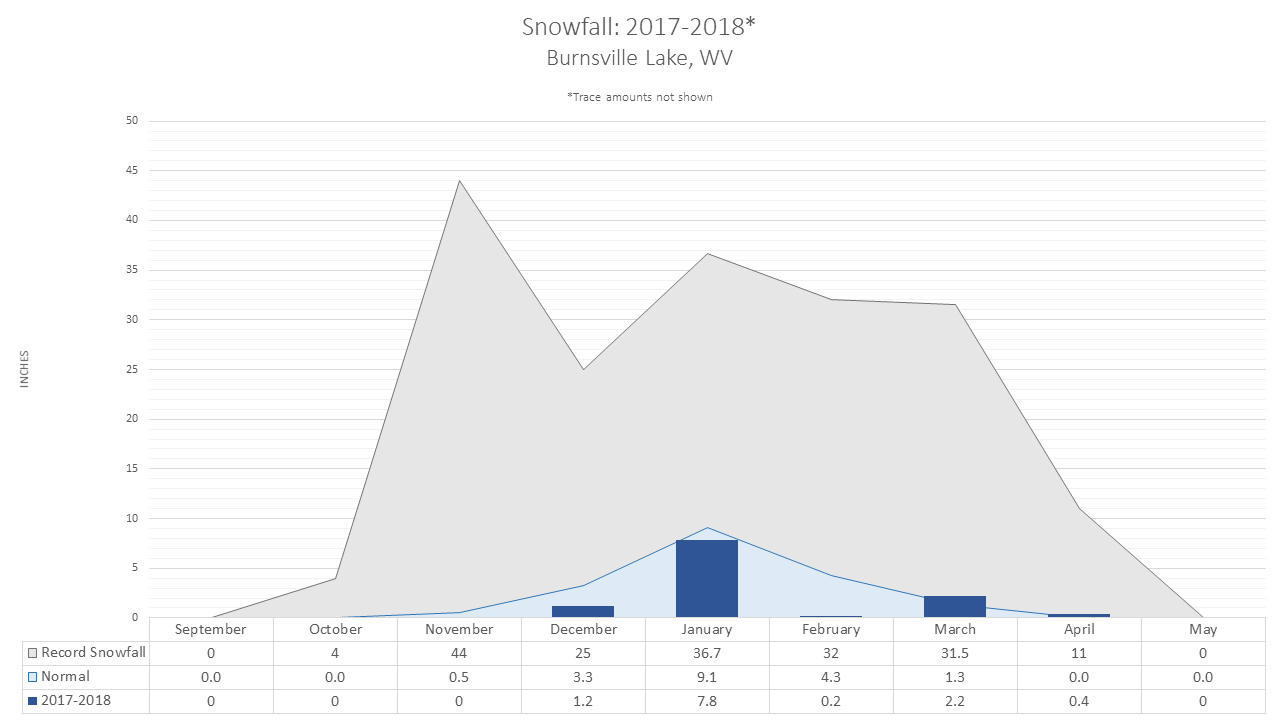
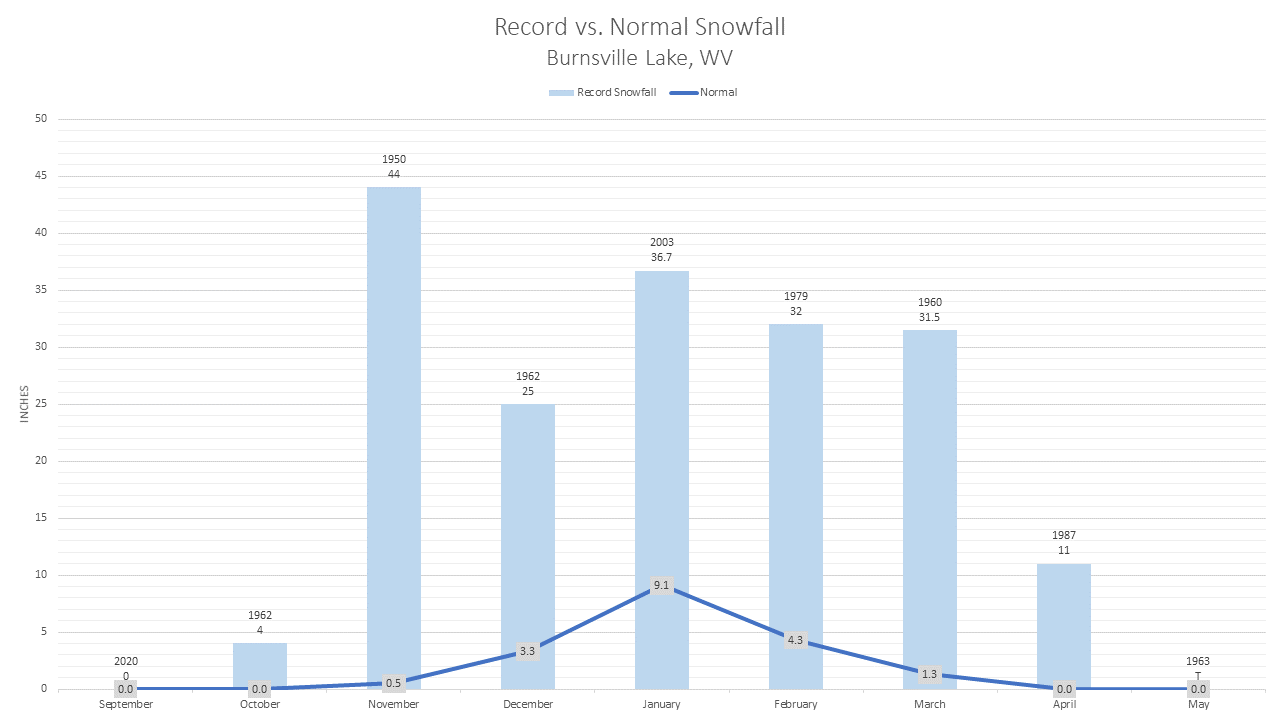
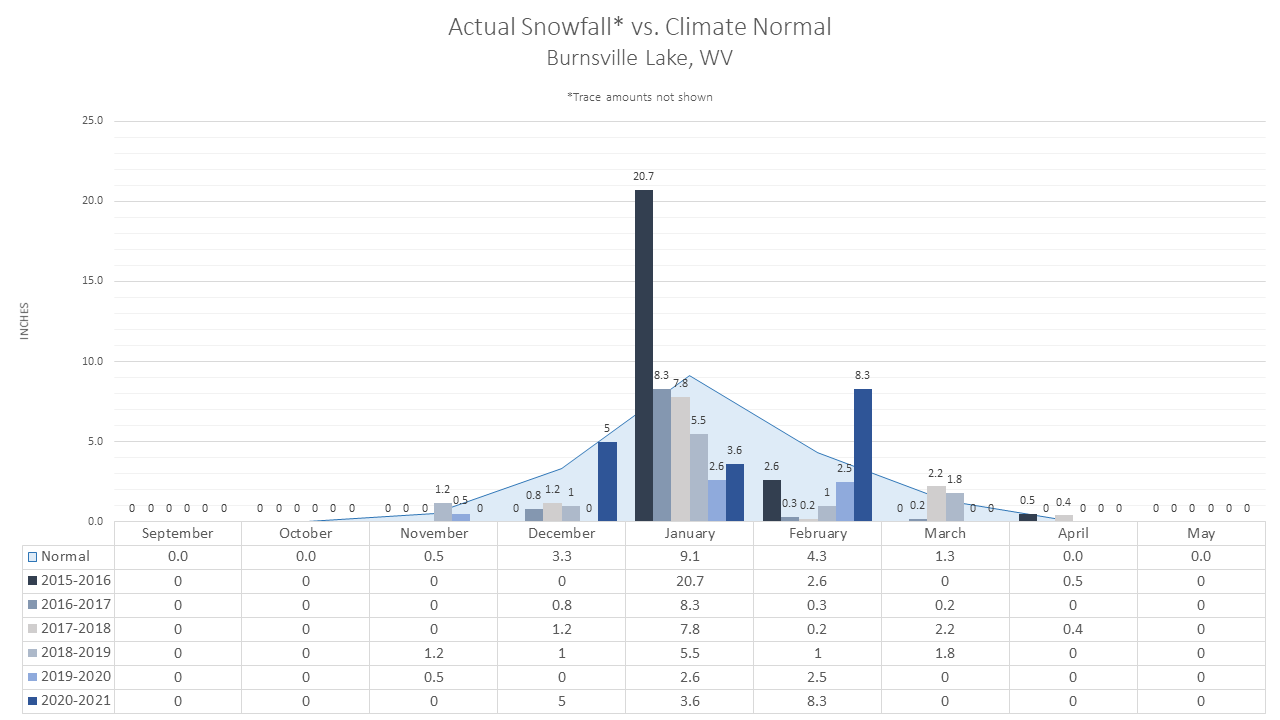
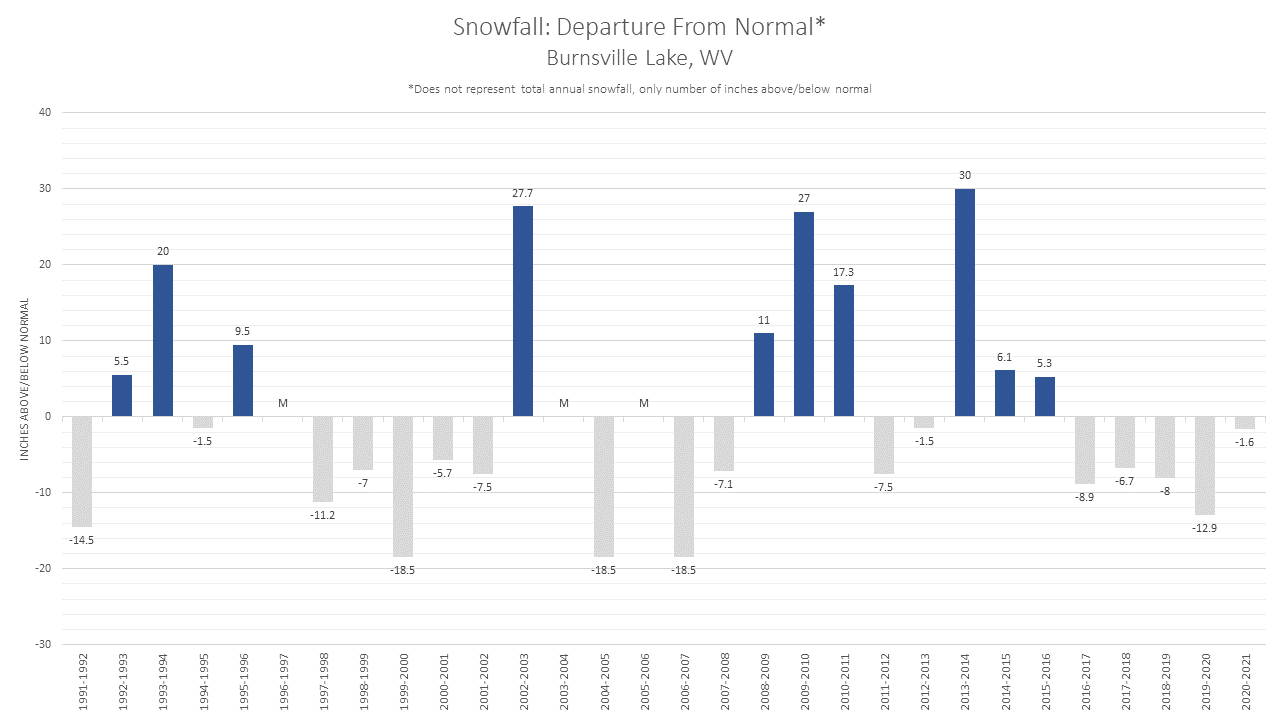
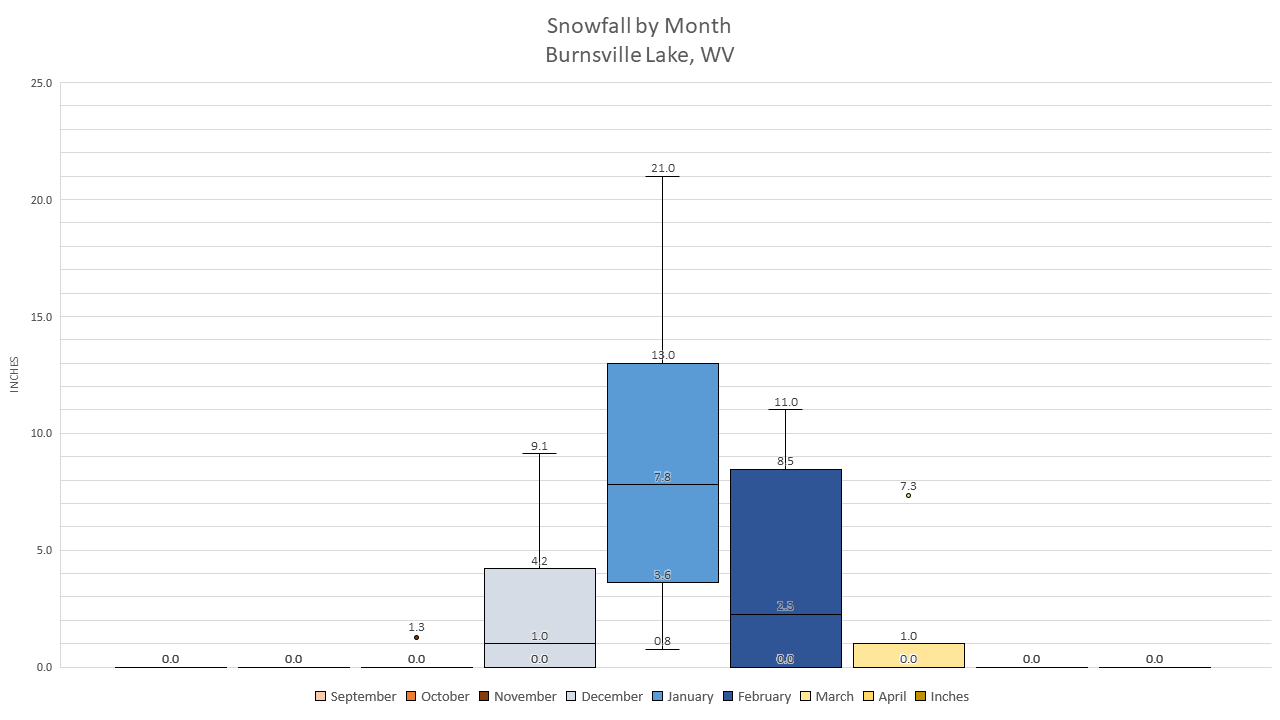
Burnsville Lake, WV |
||||||
|
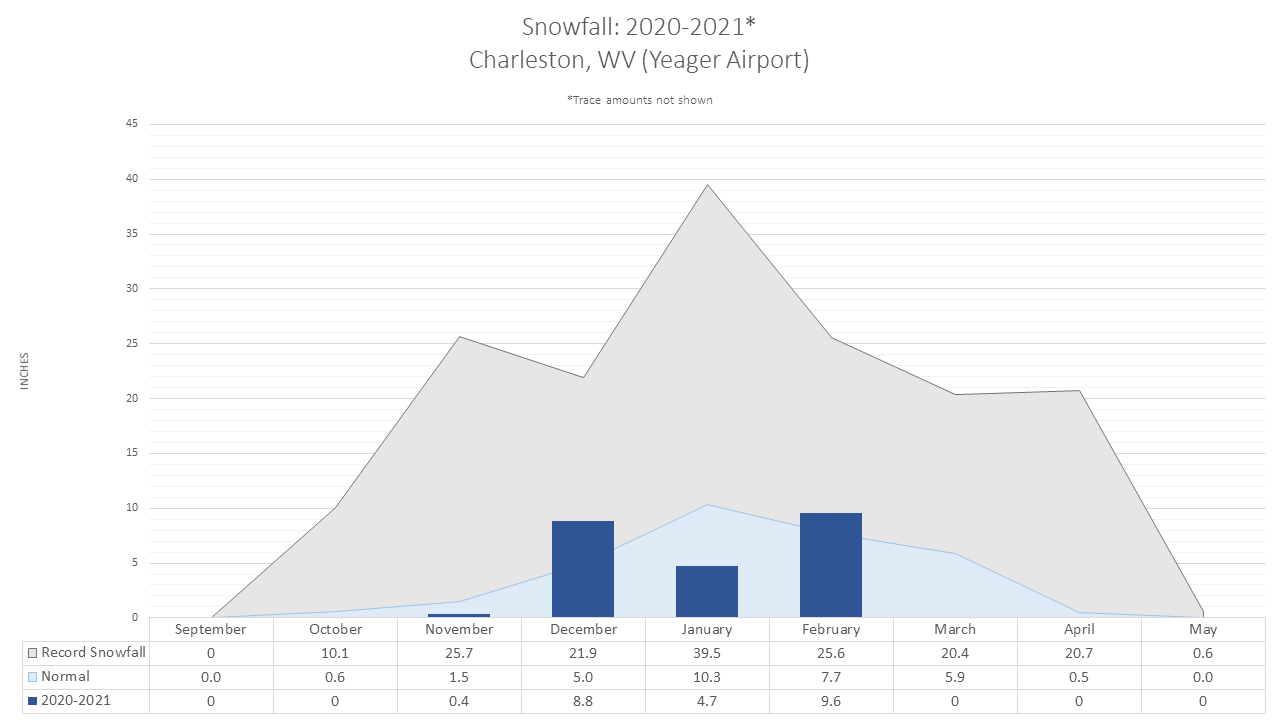
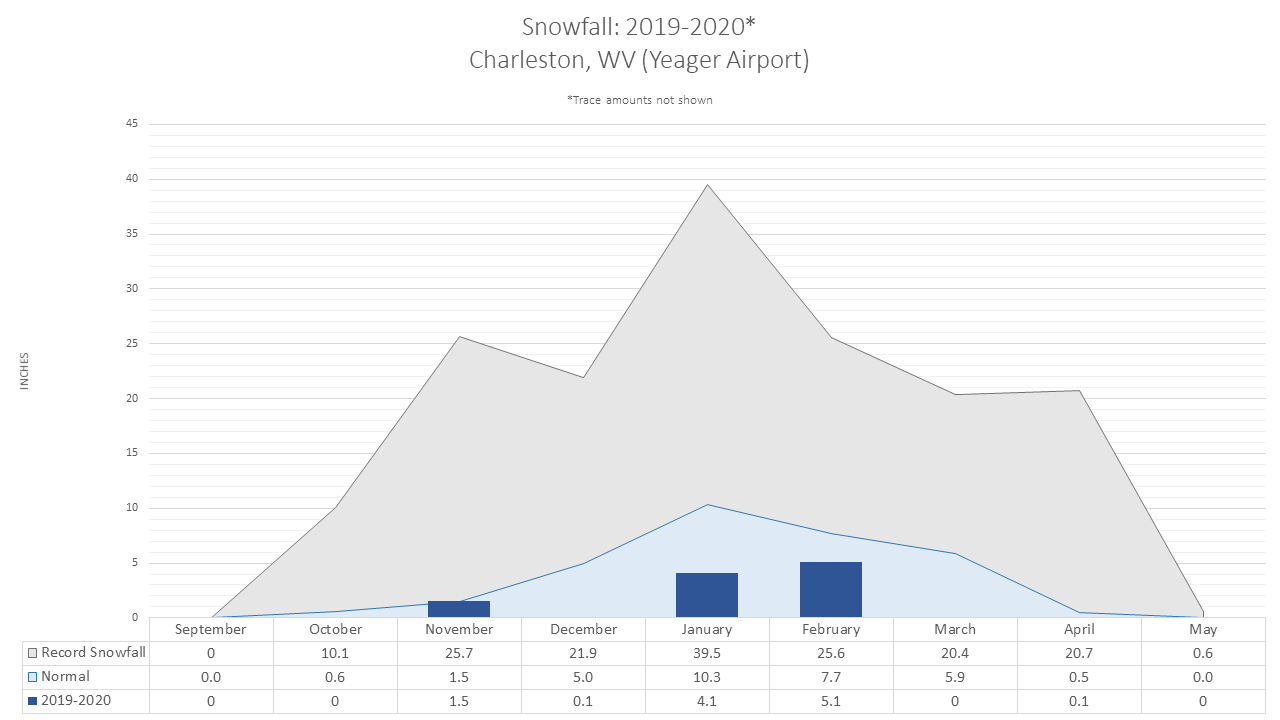
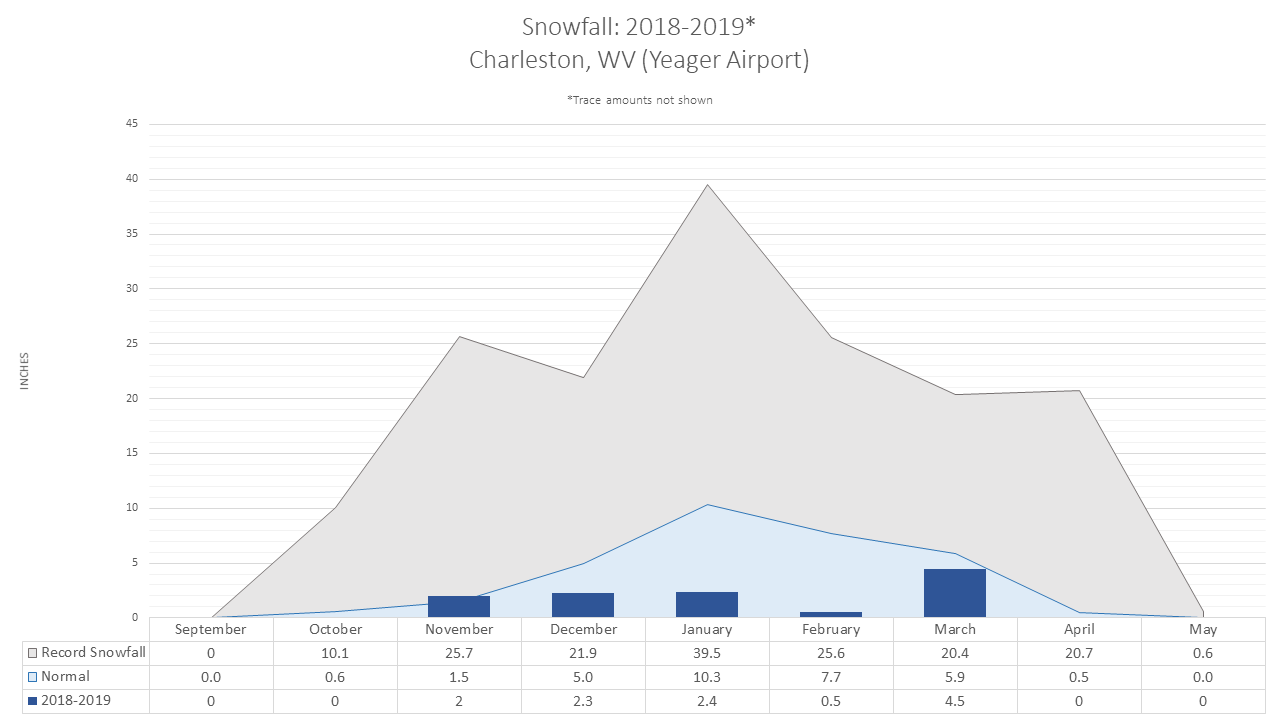
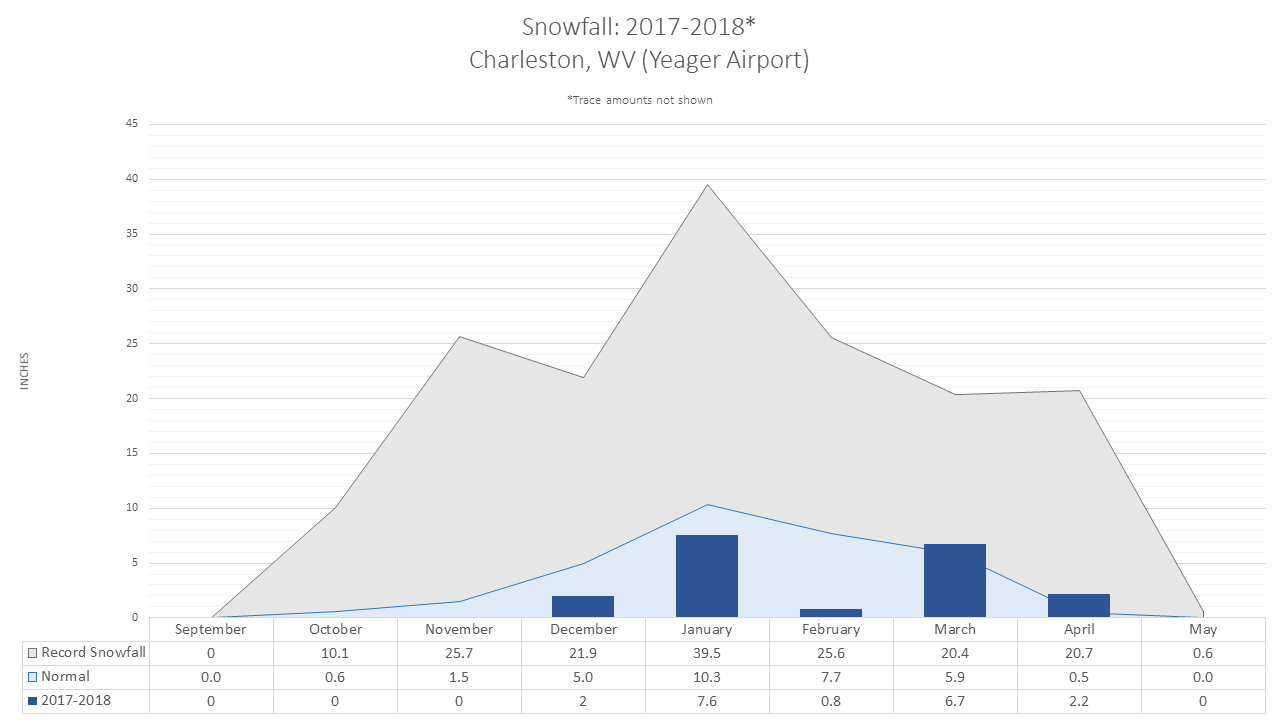
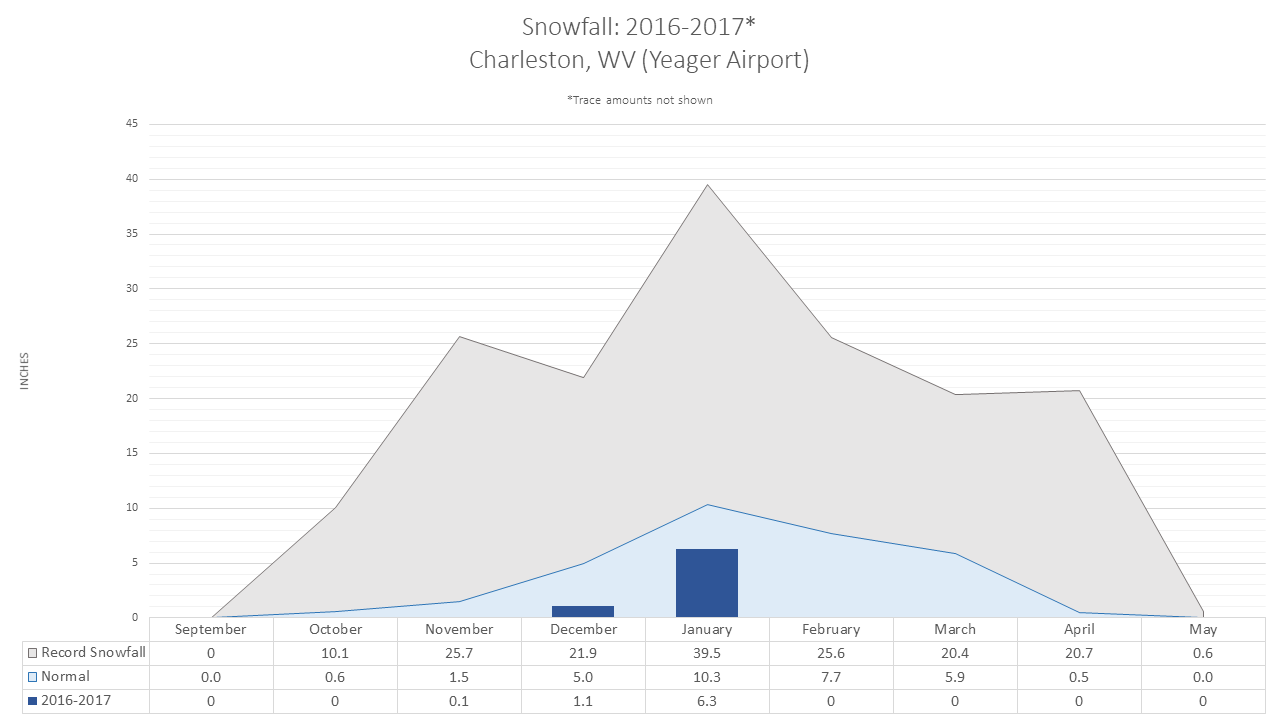
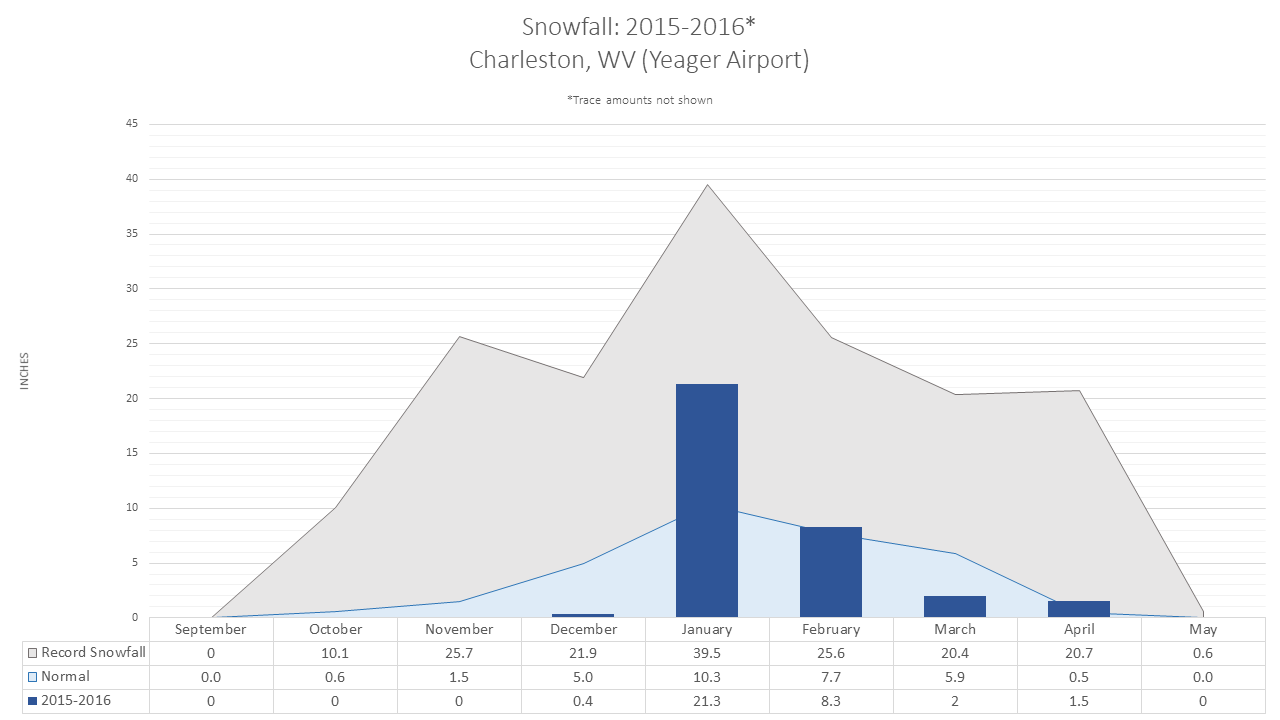
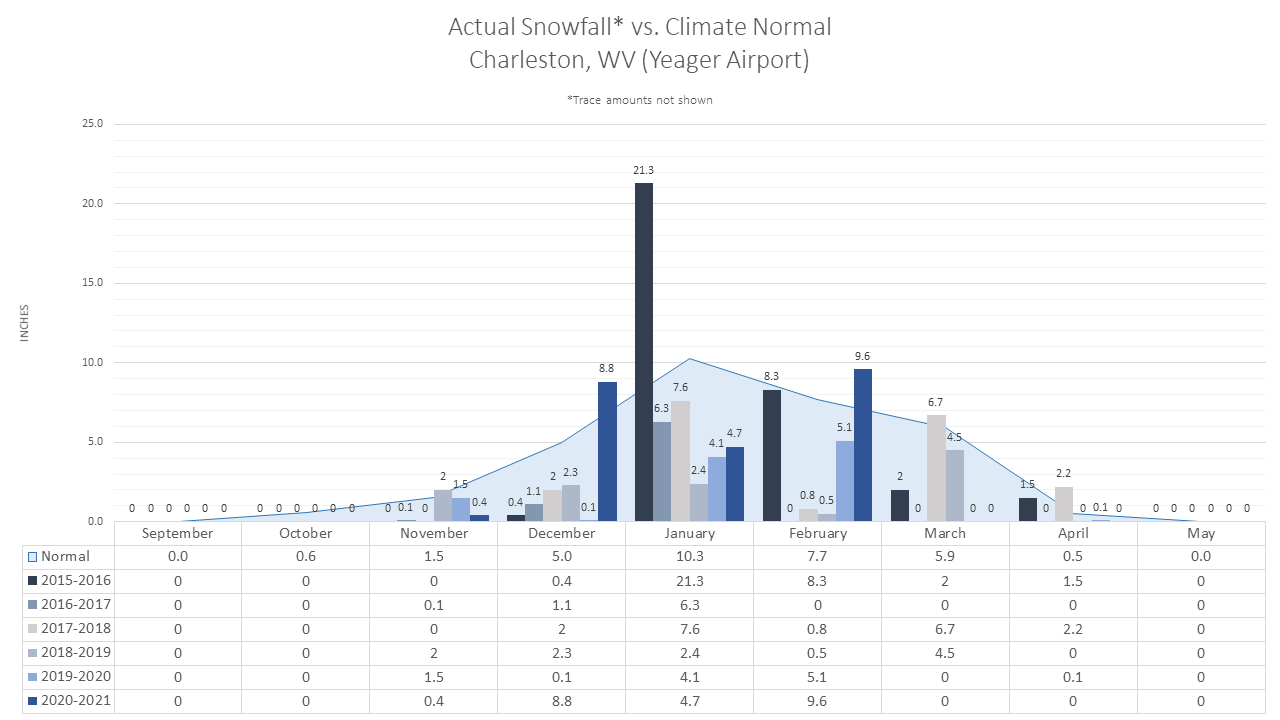
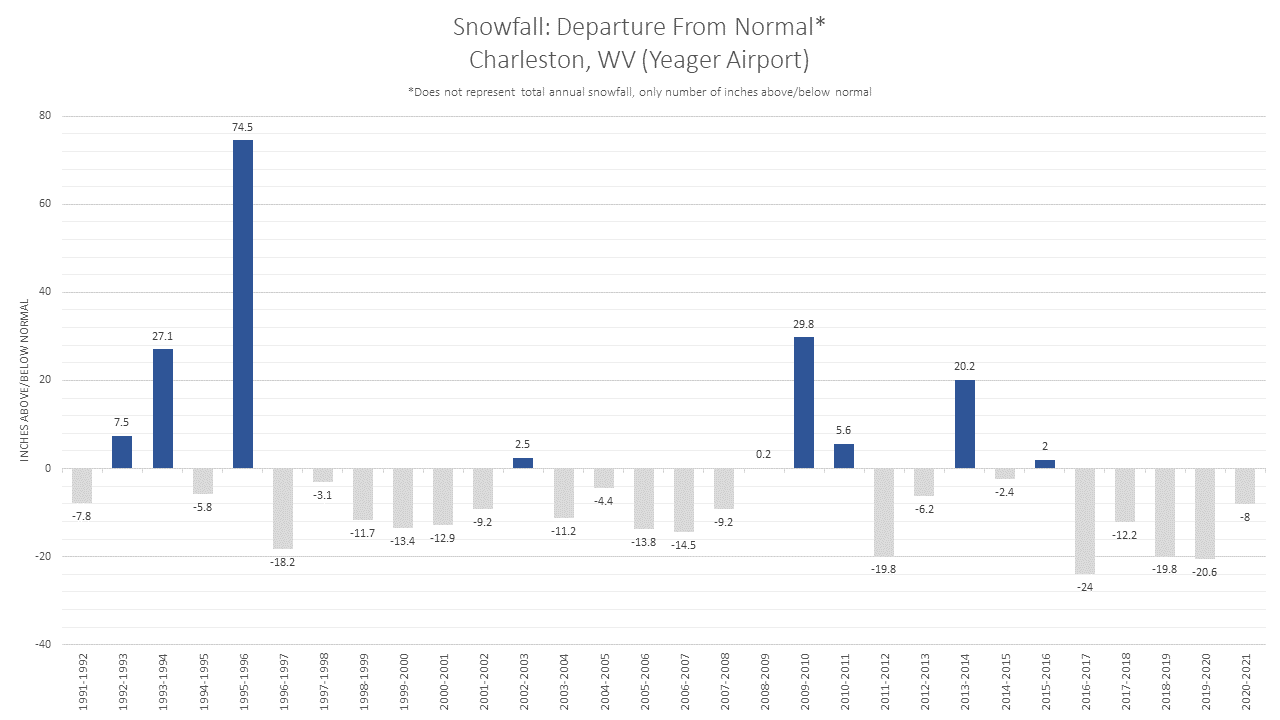
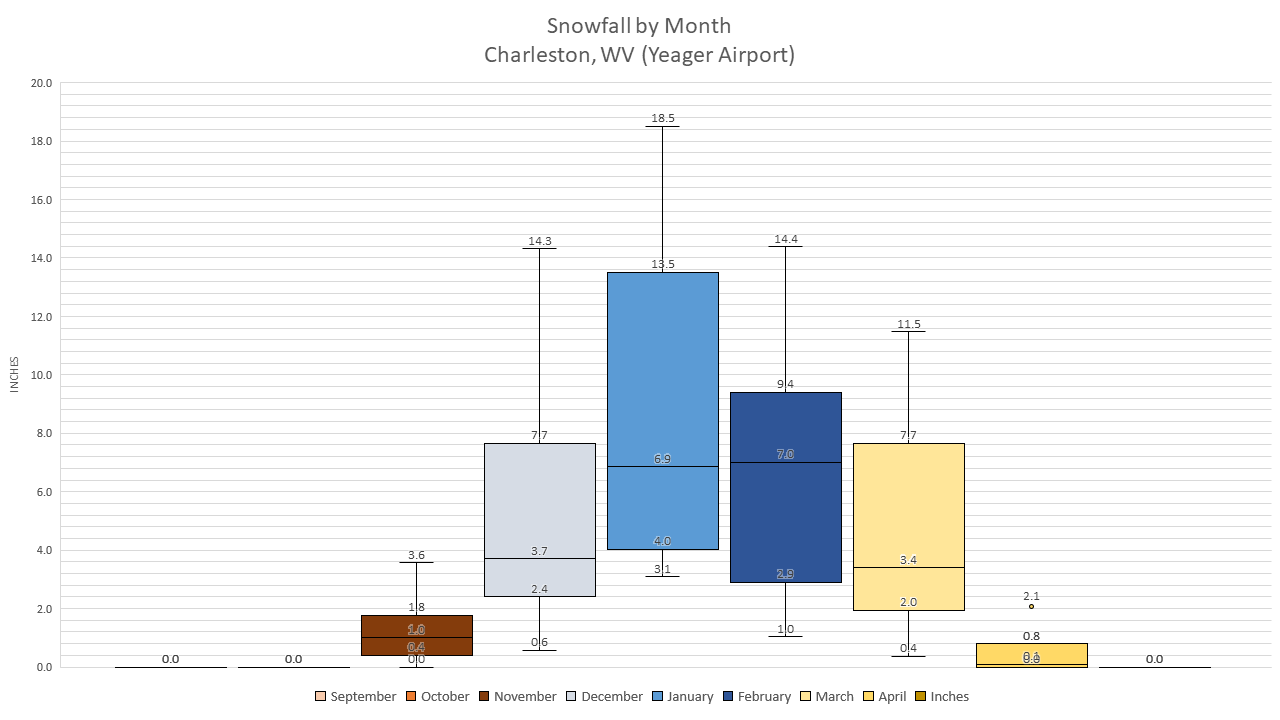
Charleston, WV (Yeager Airport) |
||||||
|
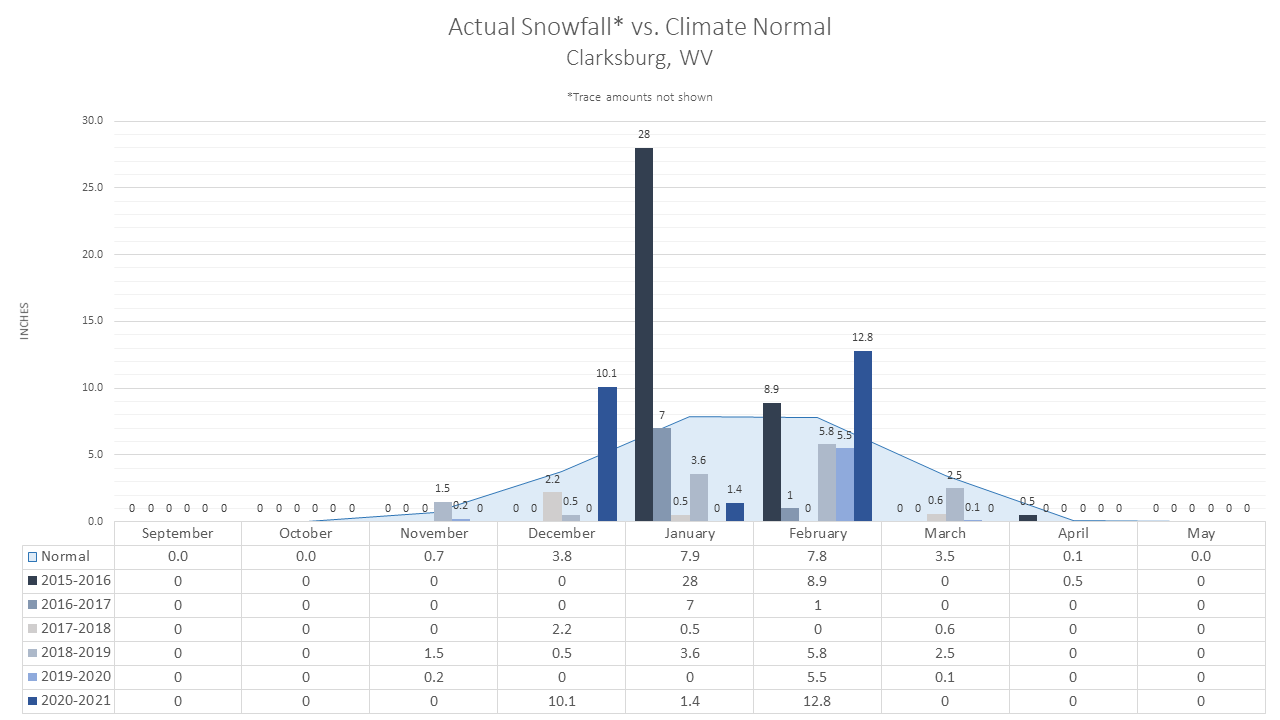
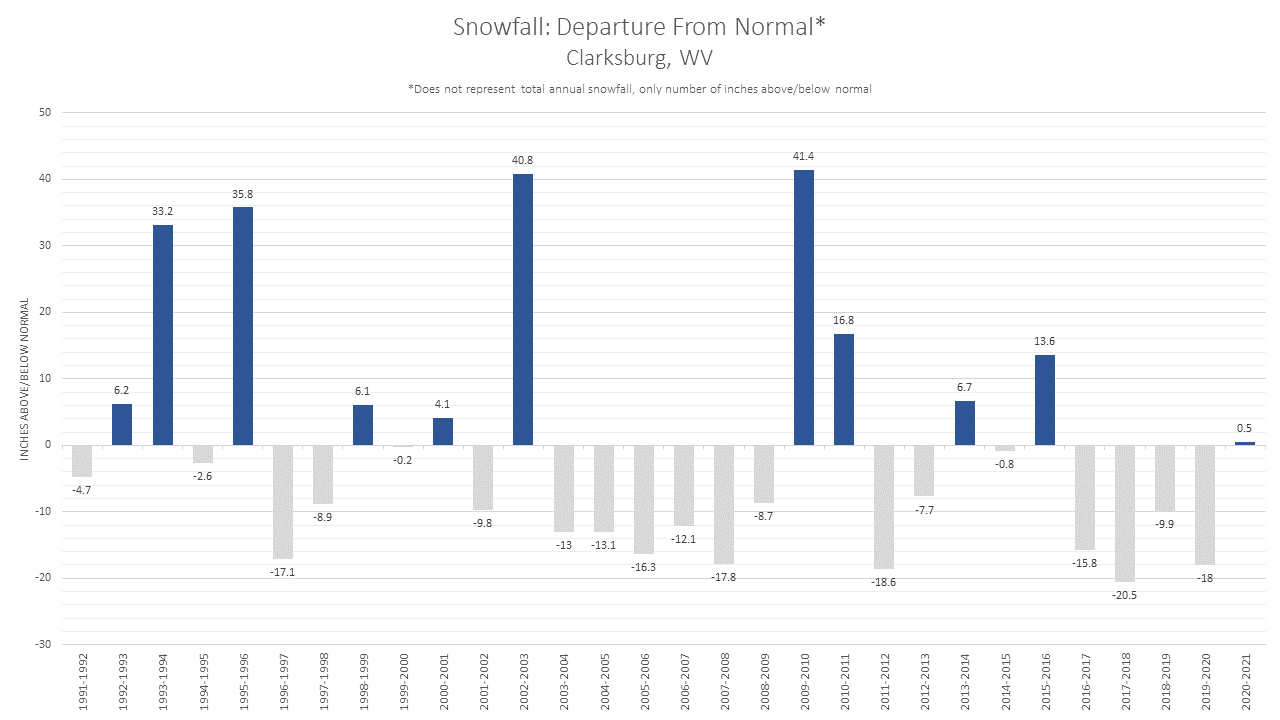
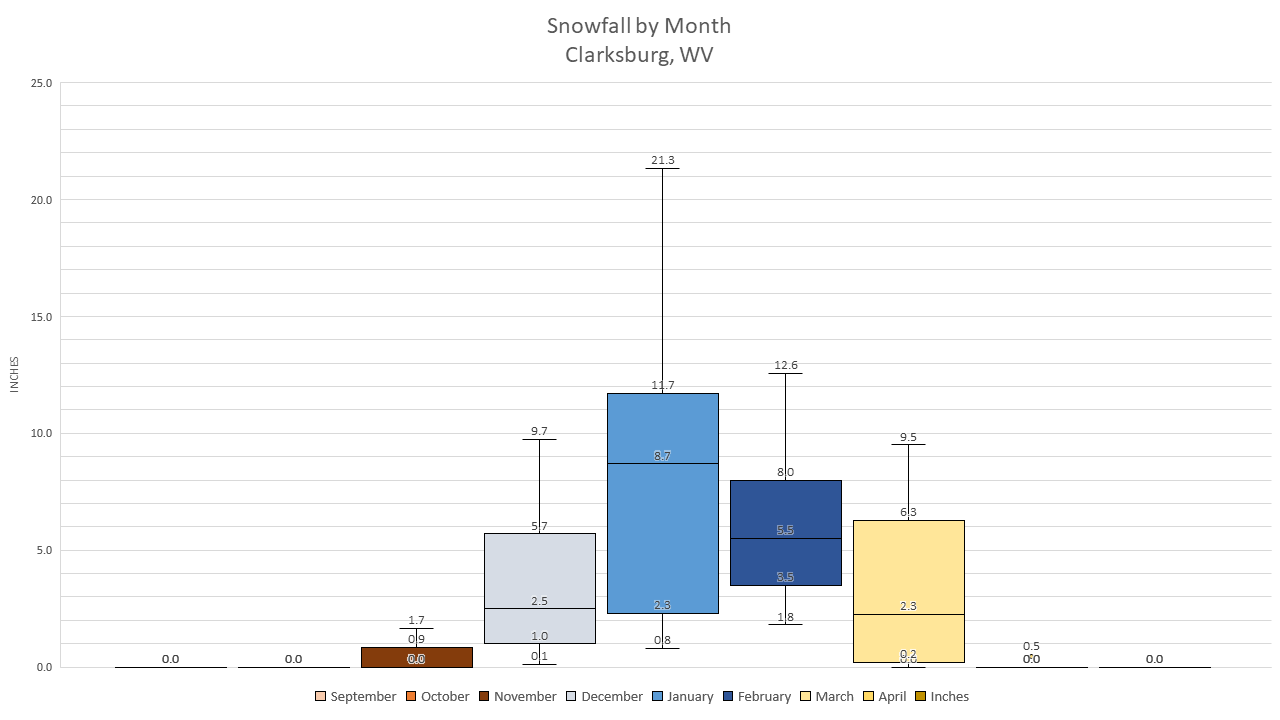
Clarksburg, WV |
||||||
|
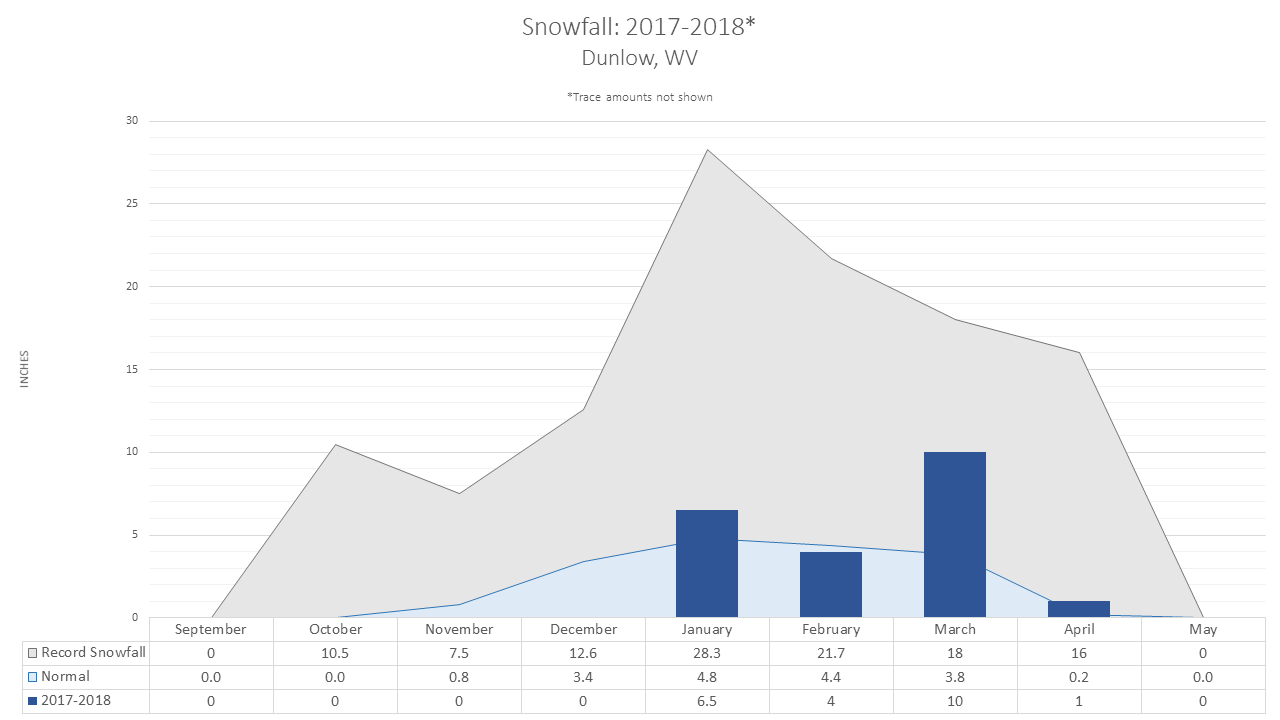
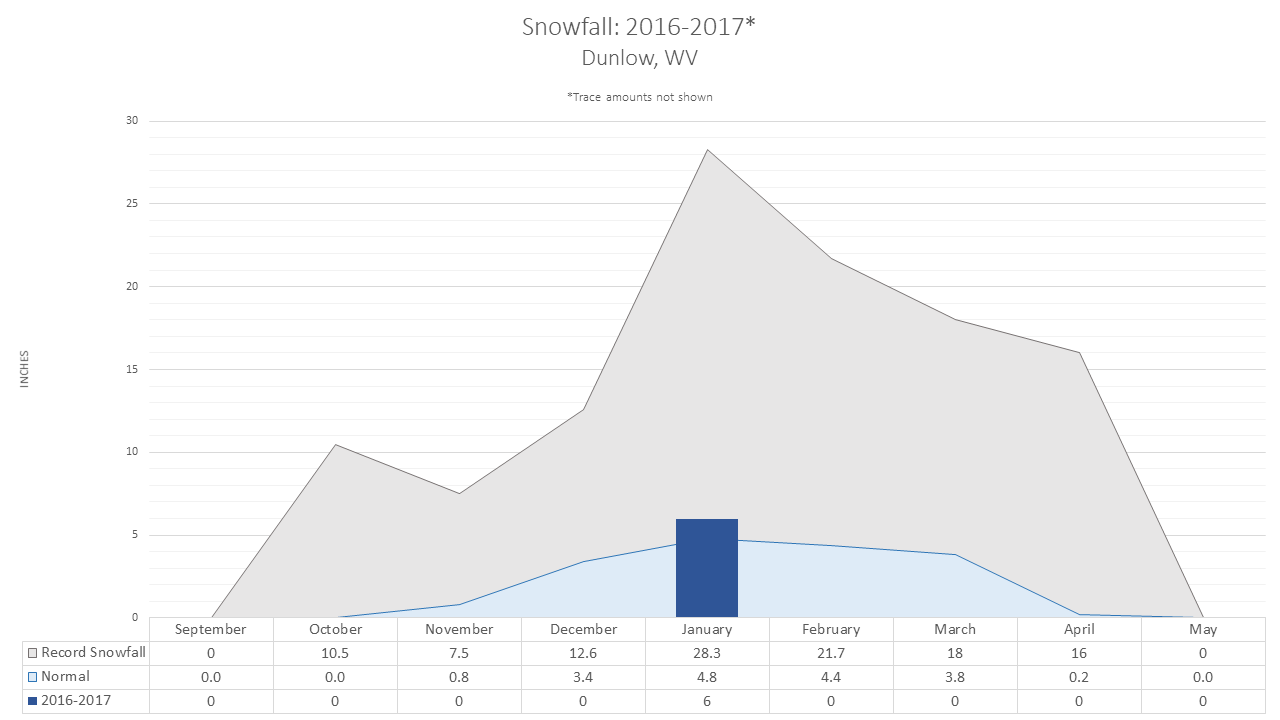
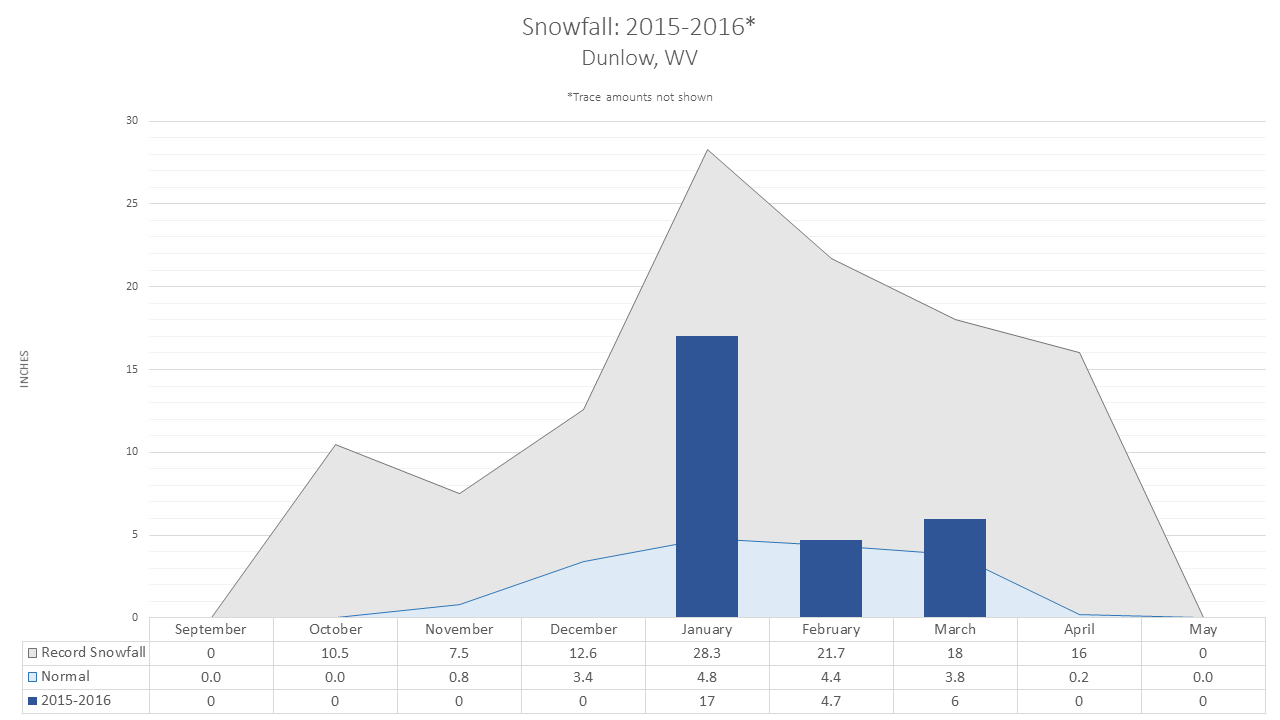
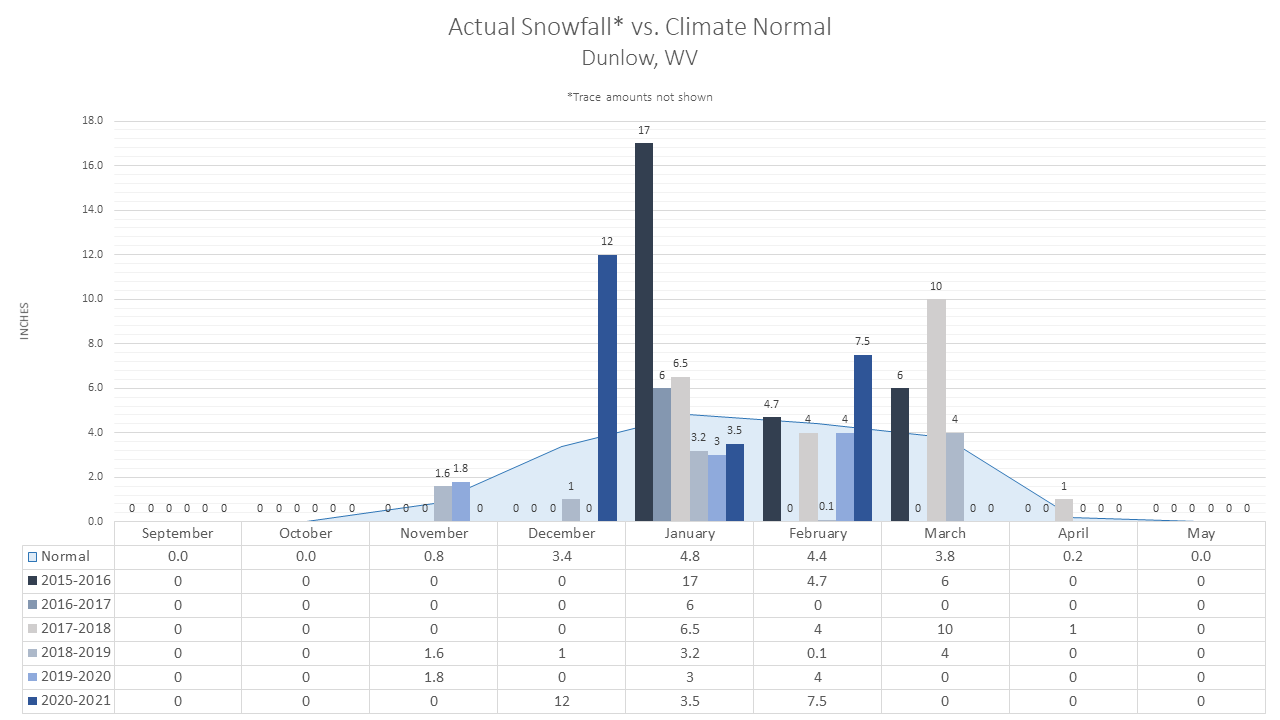
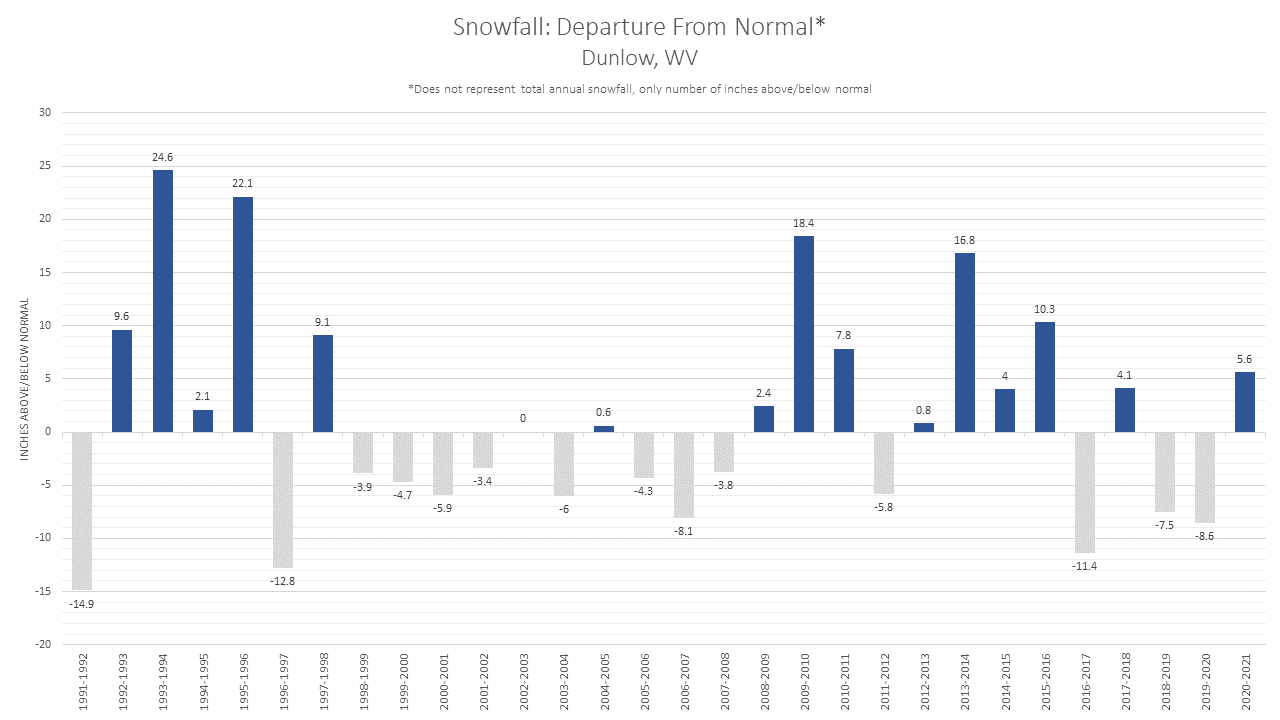
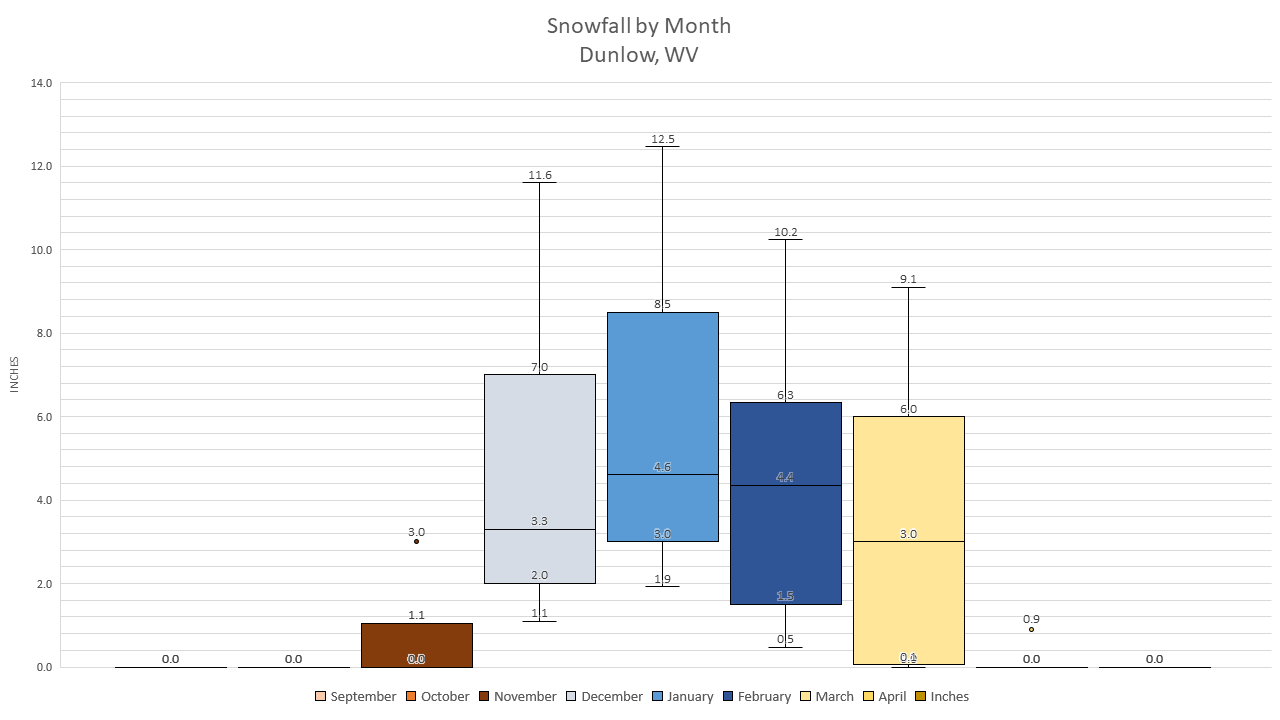
Dunlow, WV |
||||||
|
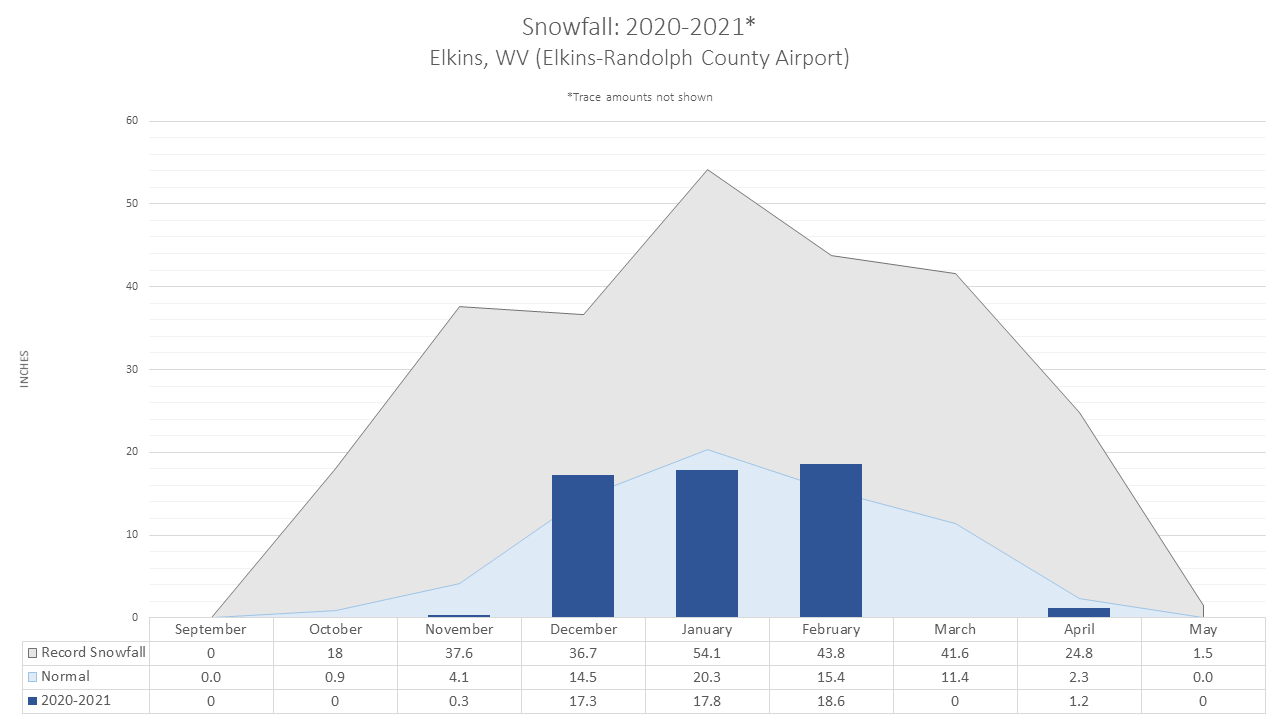
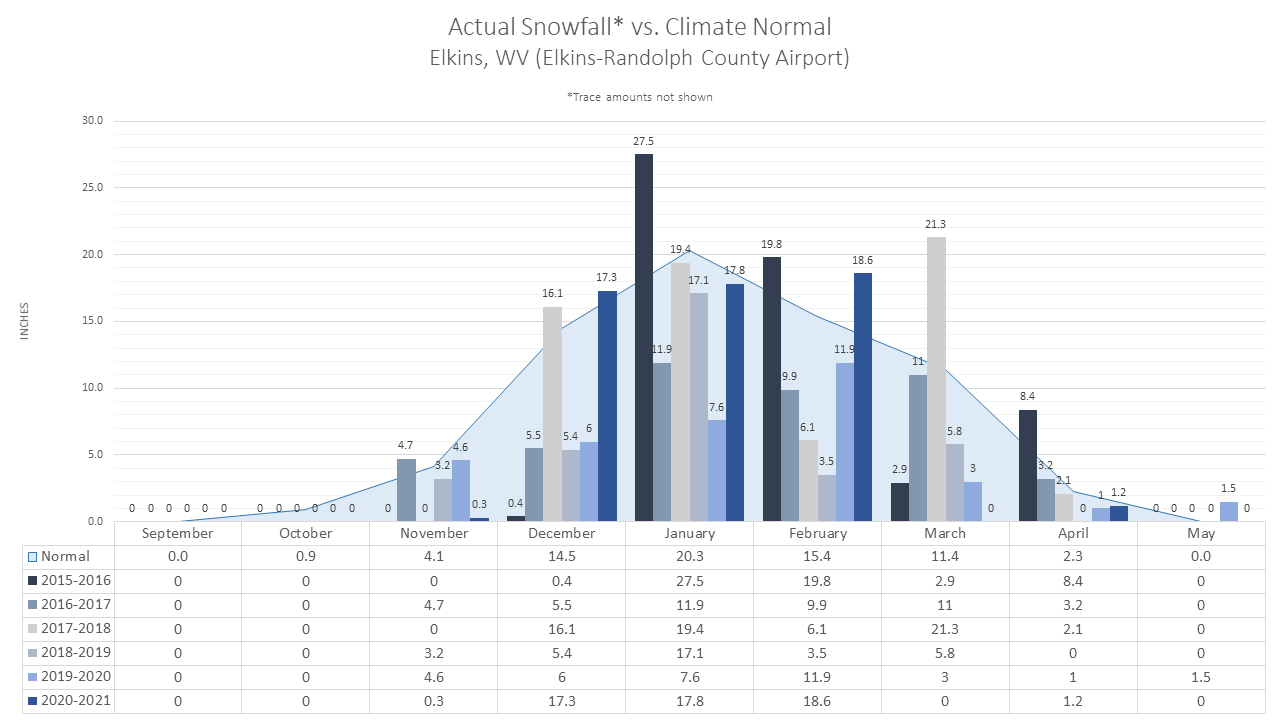
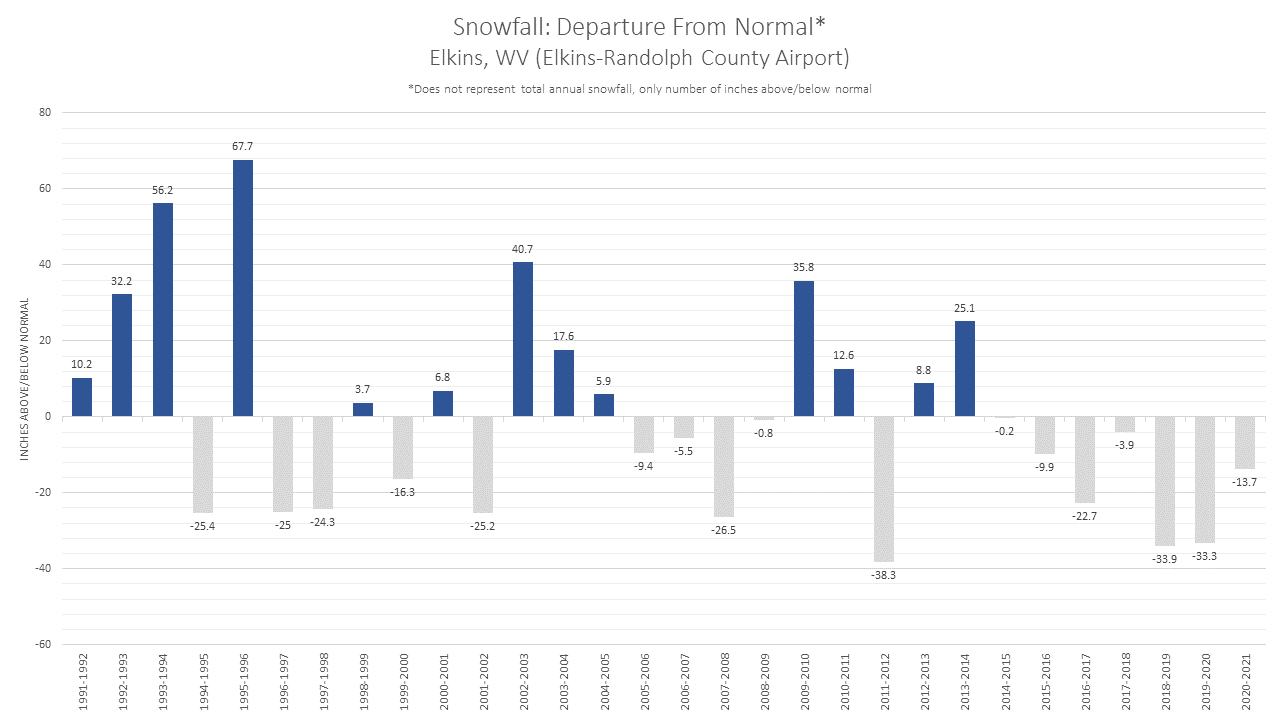
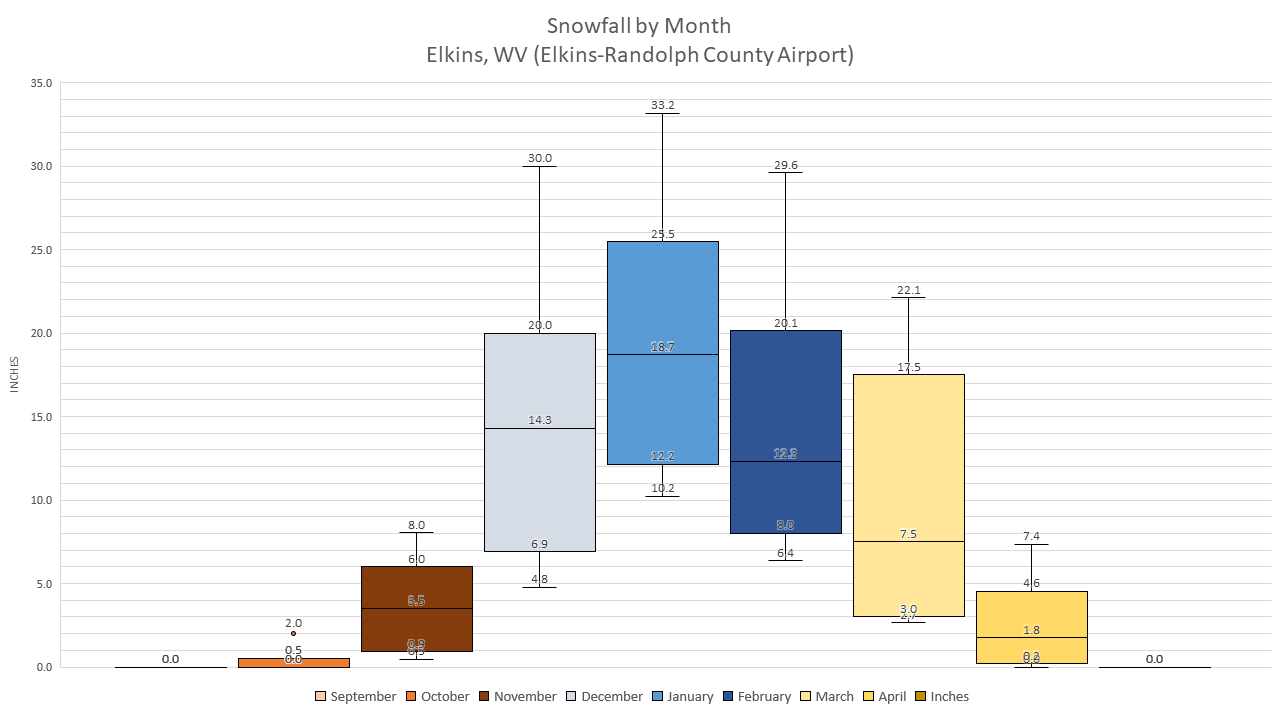
Elkins, WV (Elkins-Randolph County Regional Airport) |
||||||
|
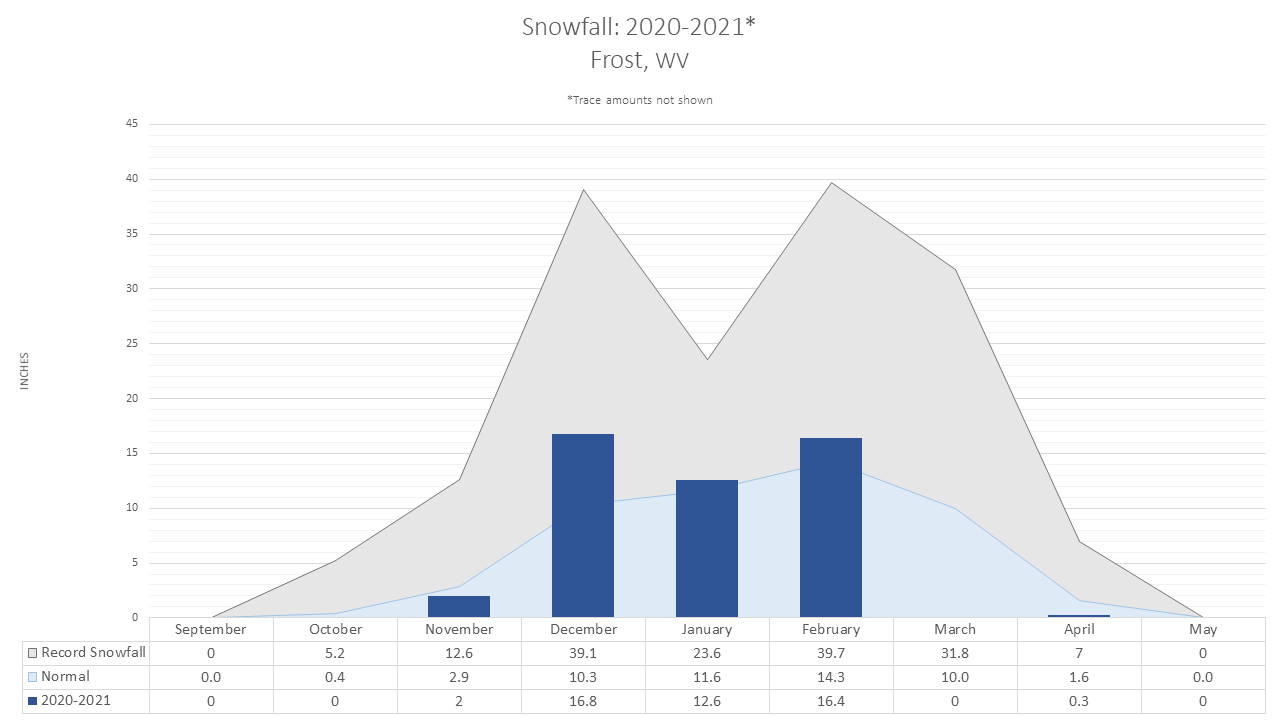
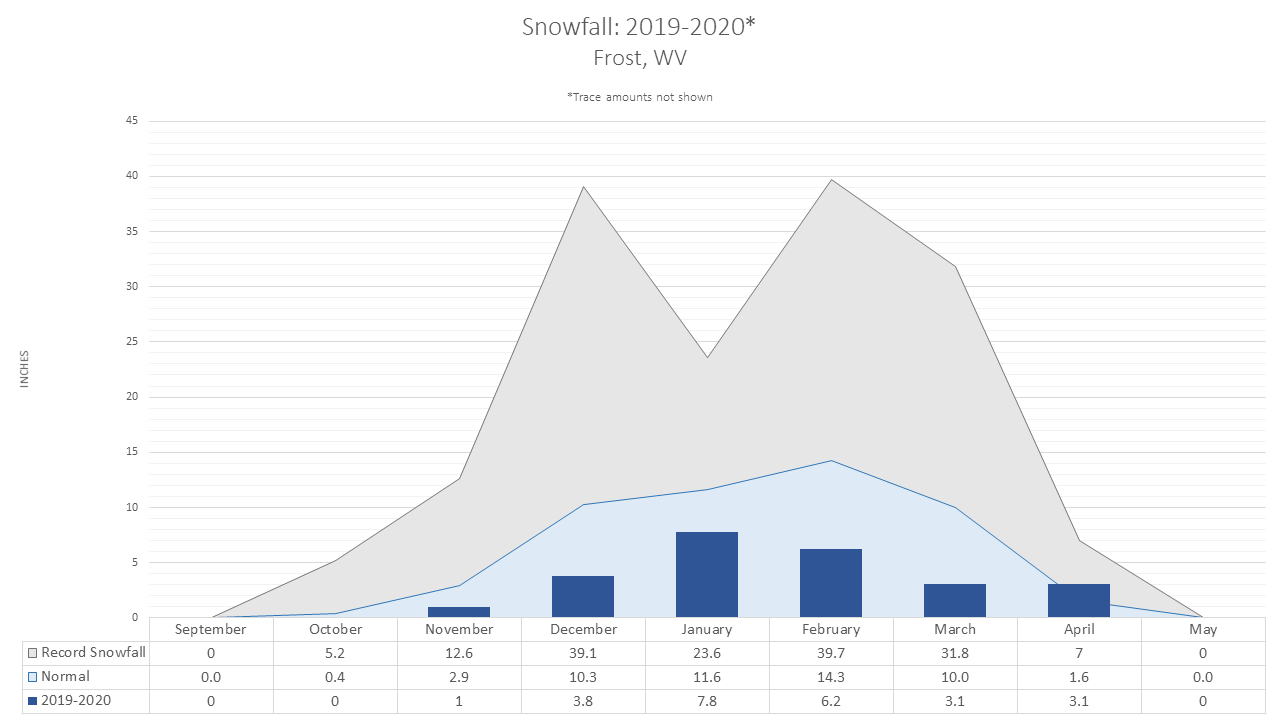
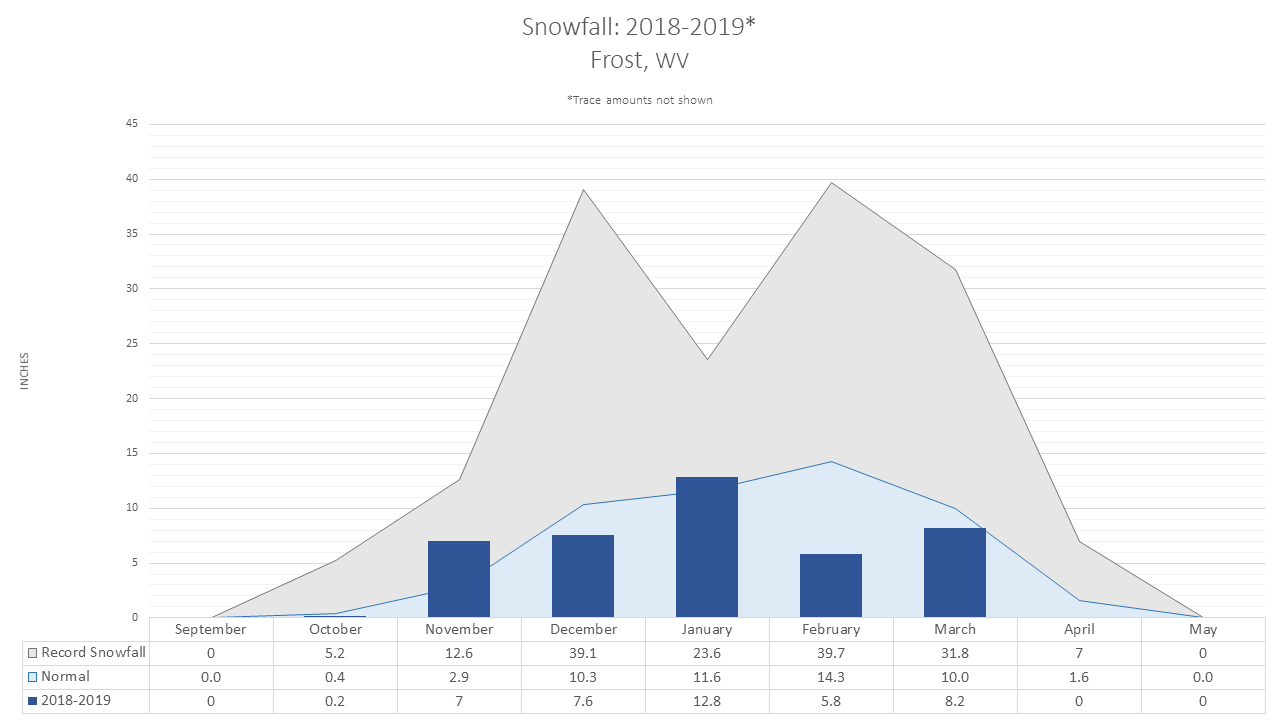
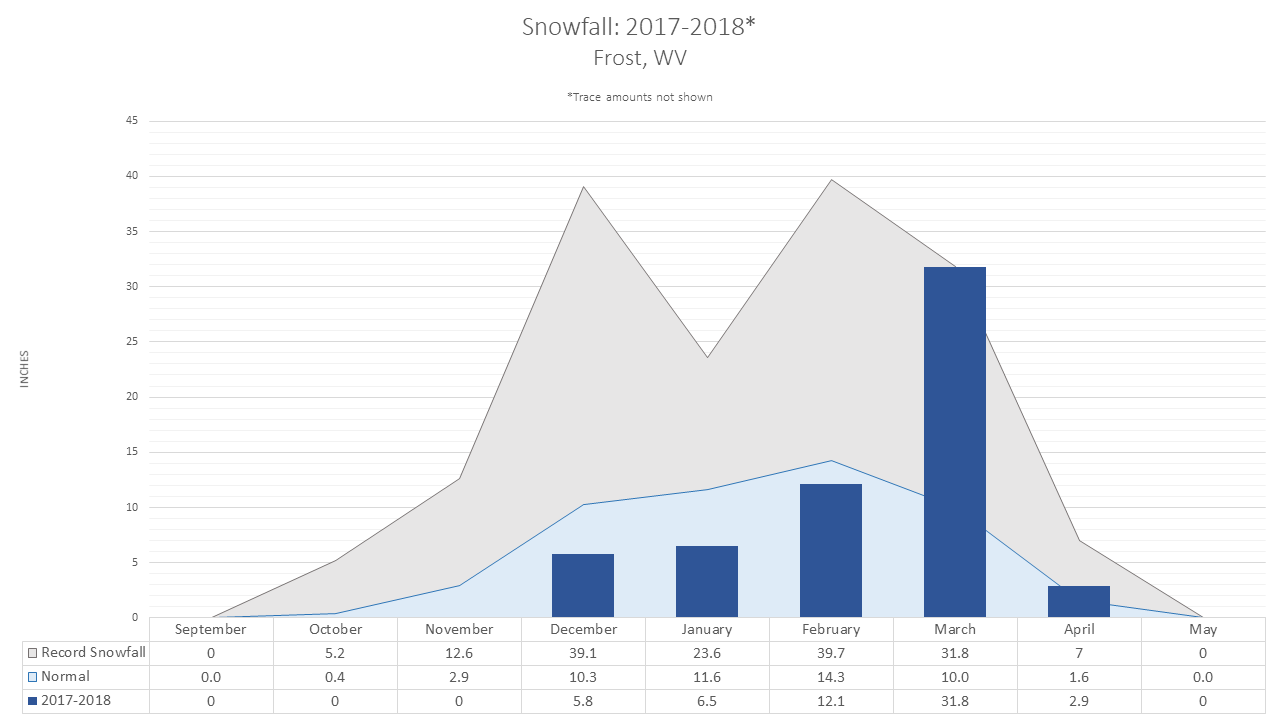
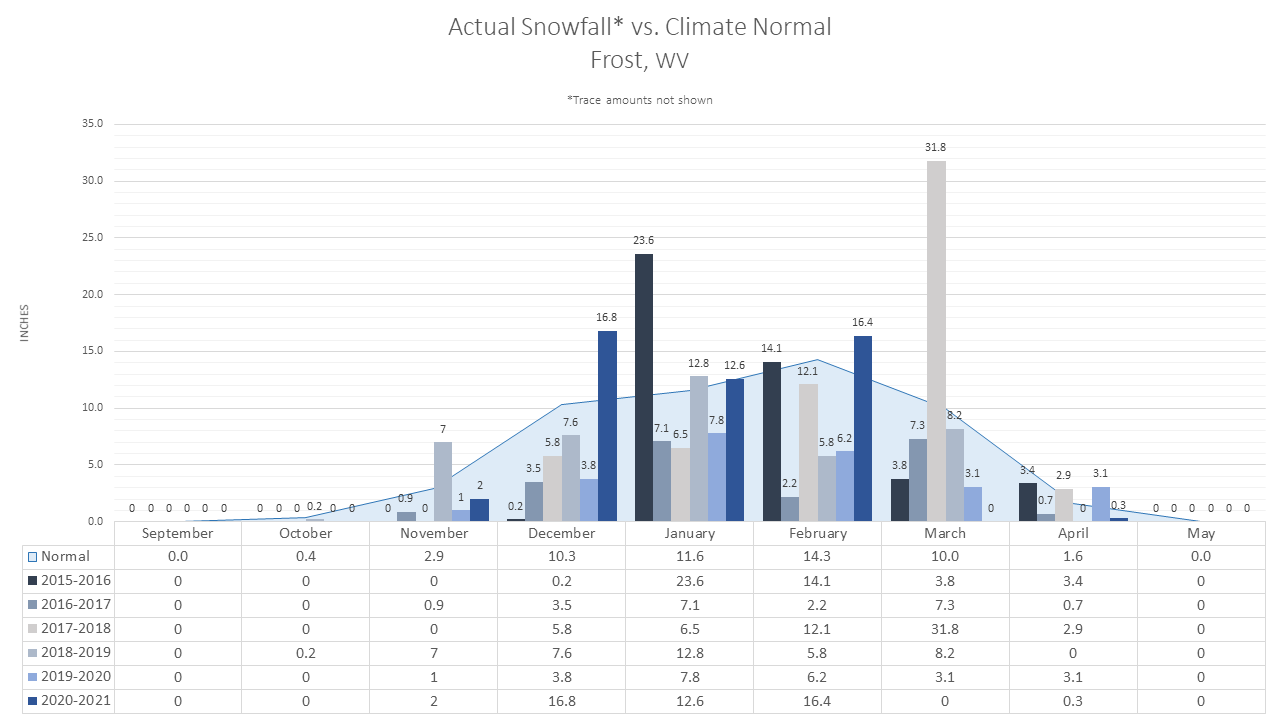
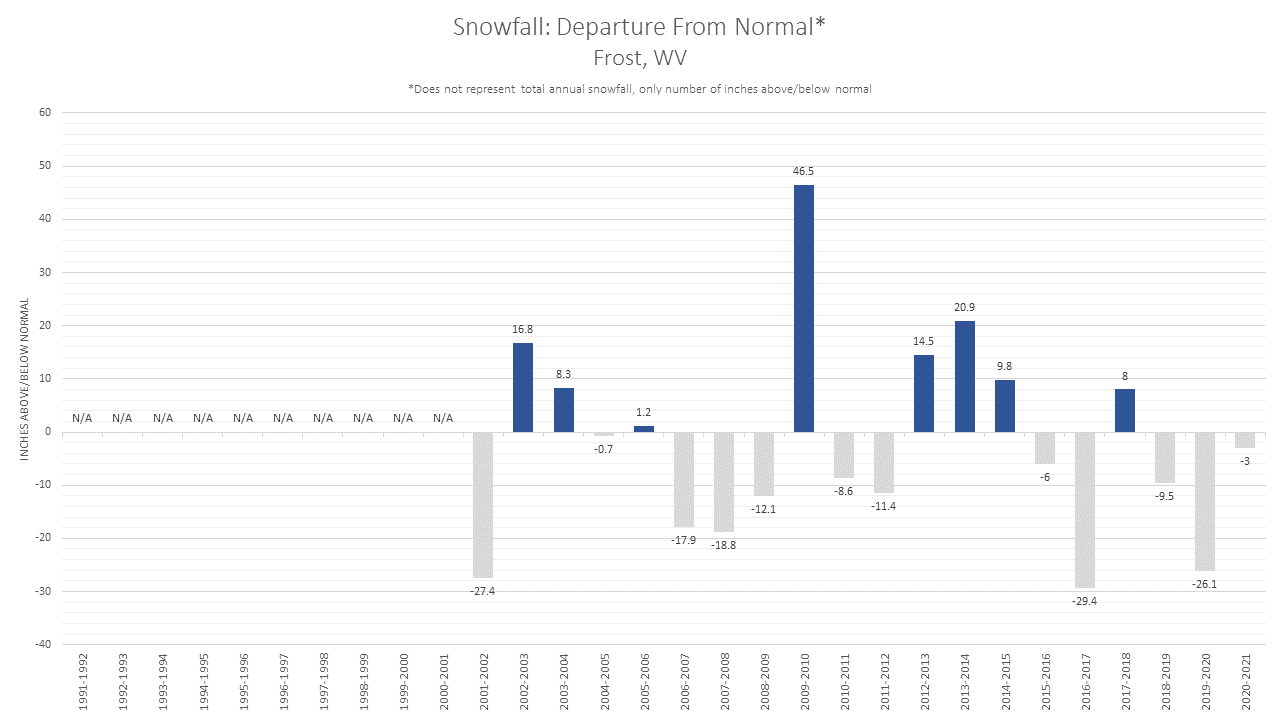
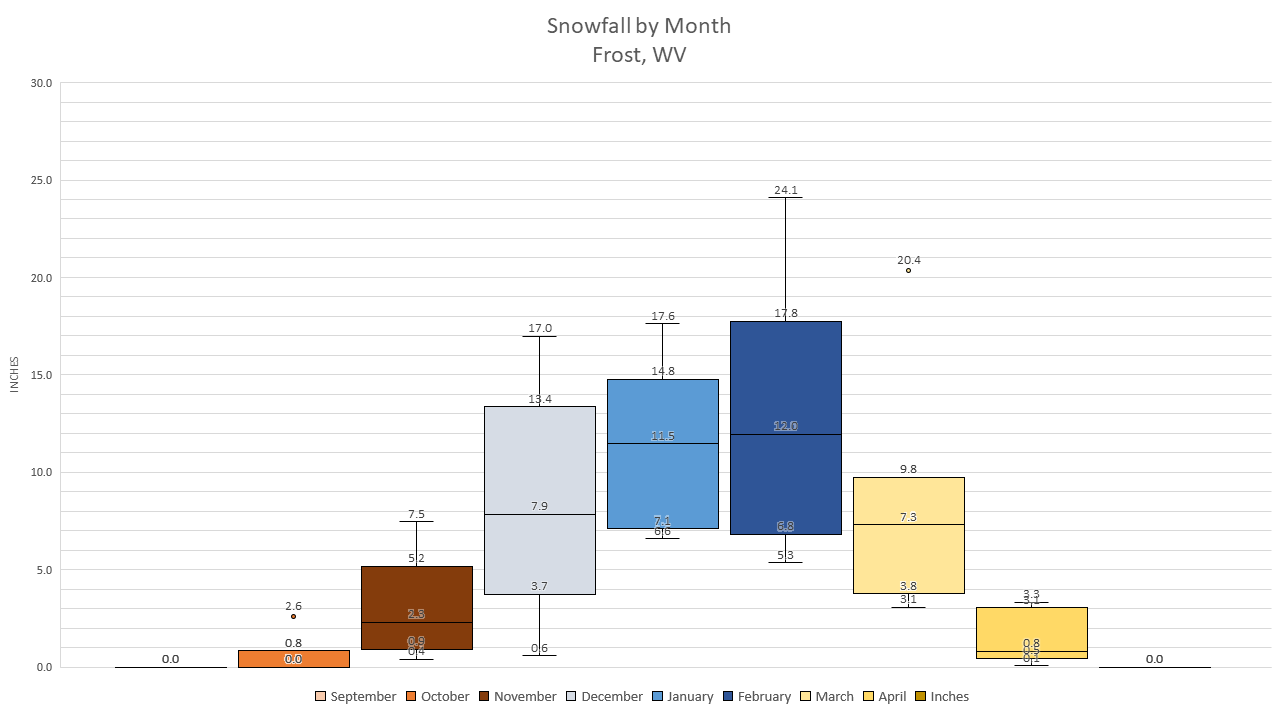
Frost, WV |
||||||
|
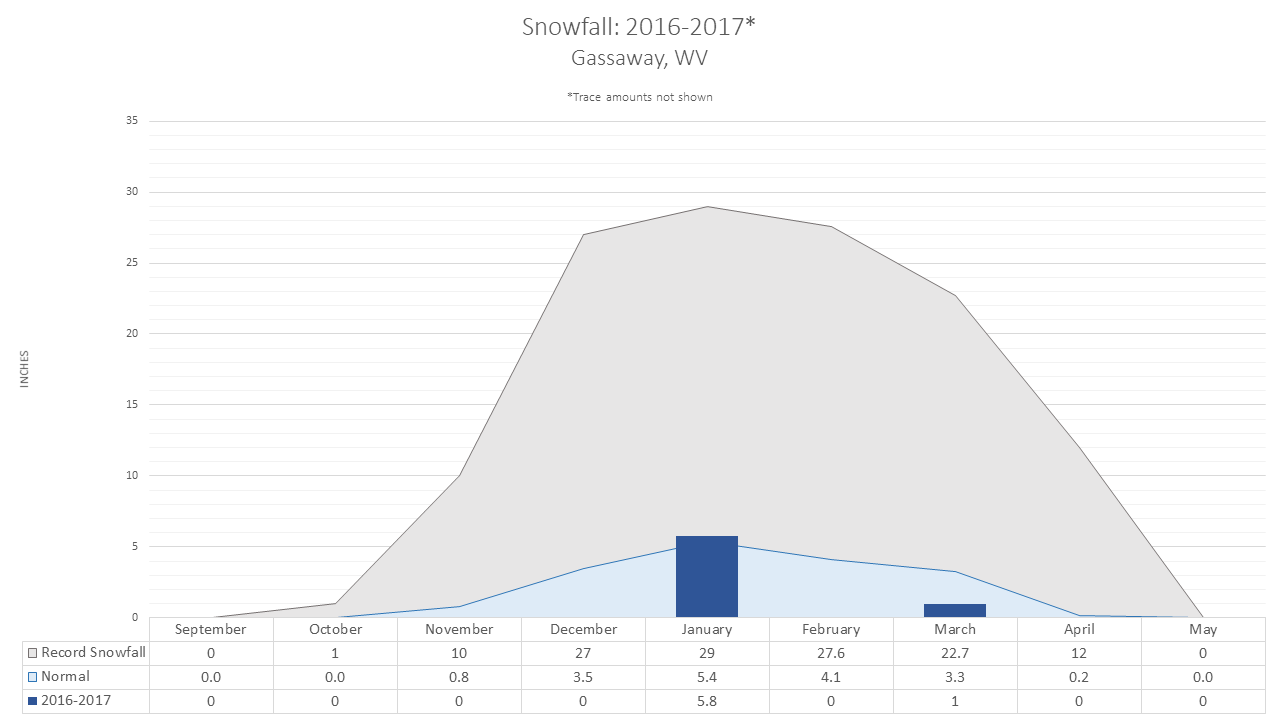
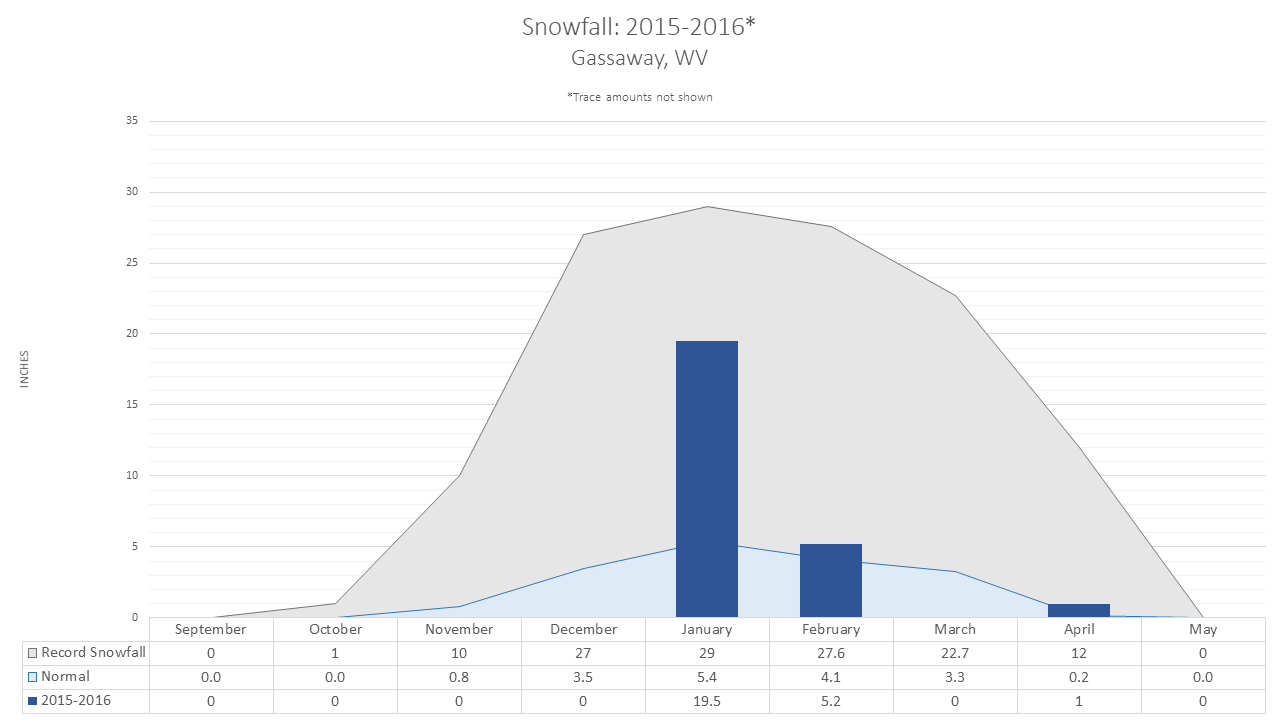
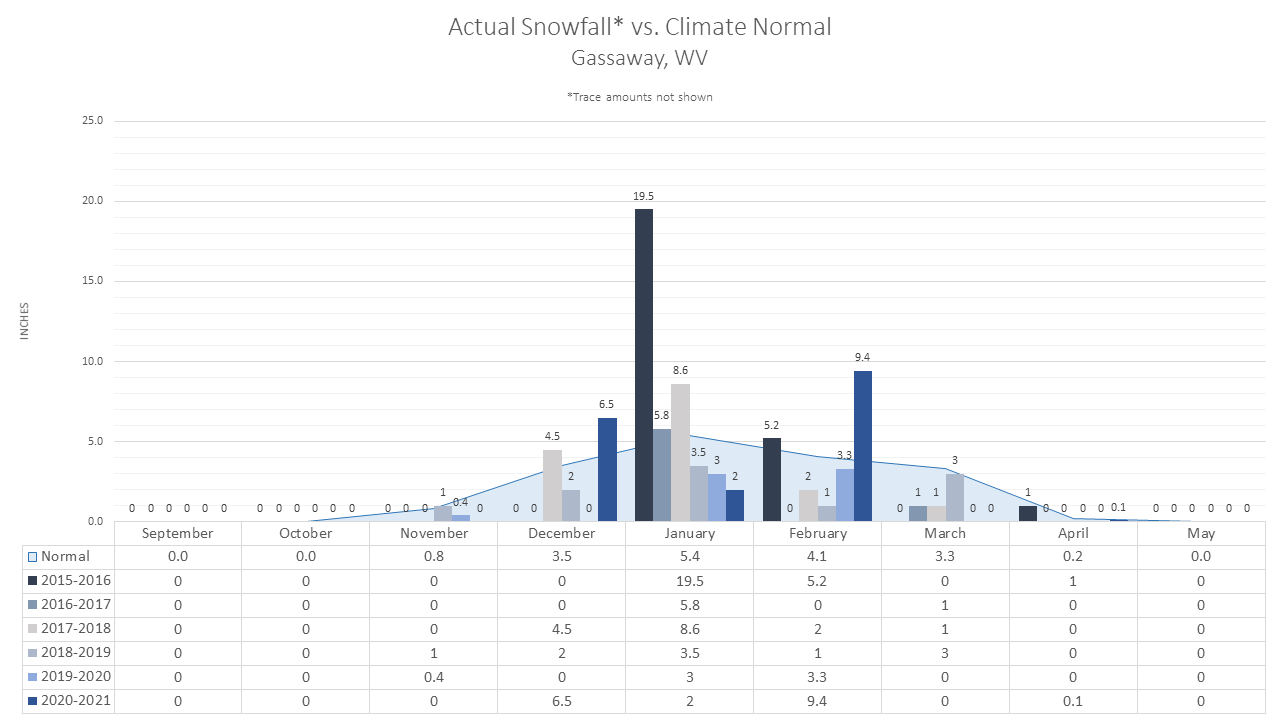
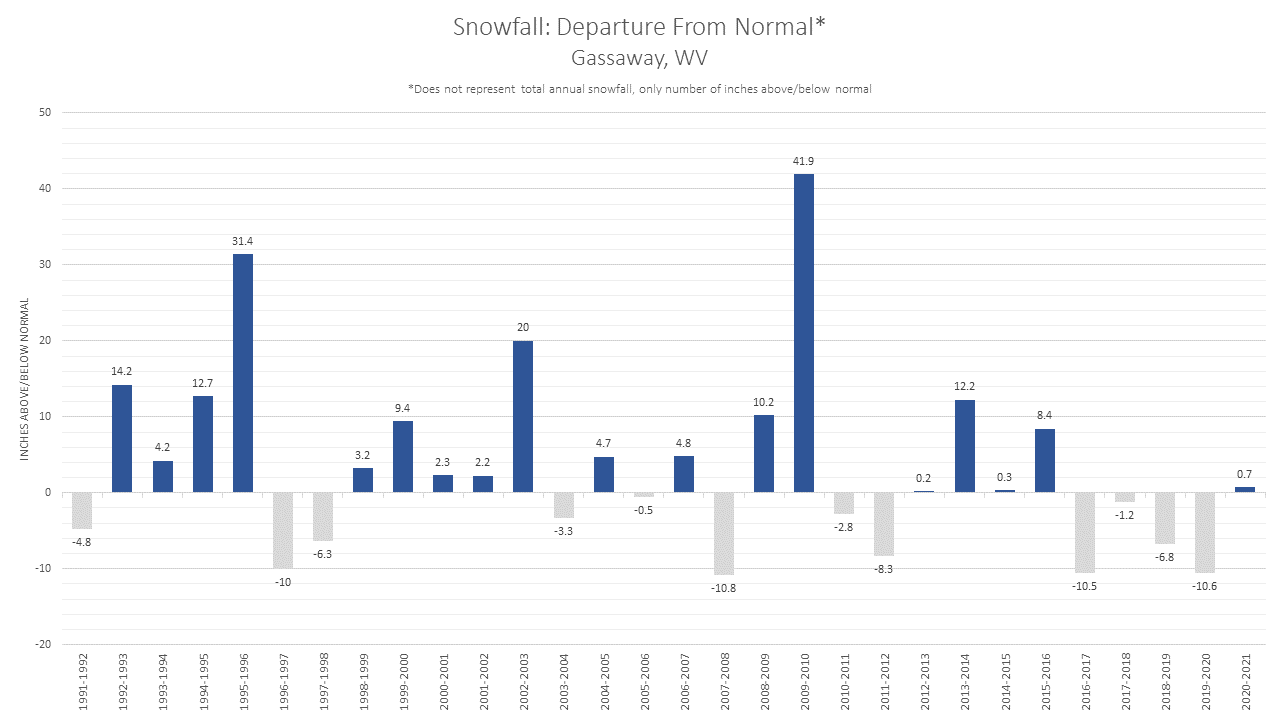
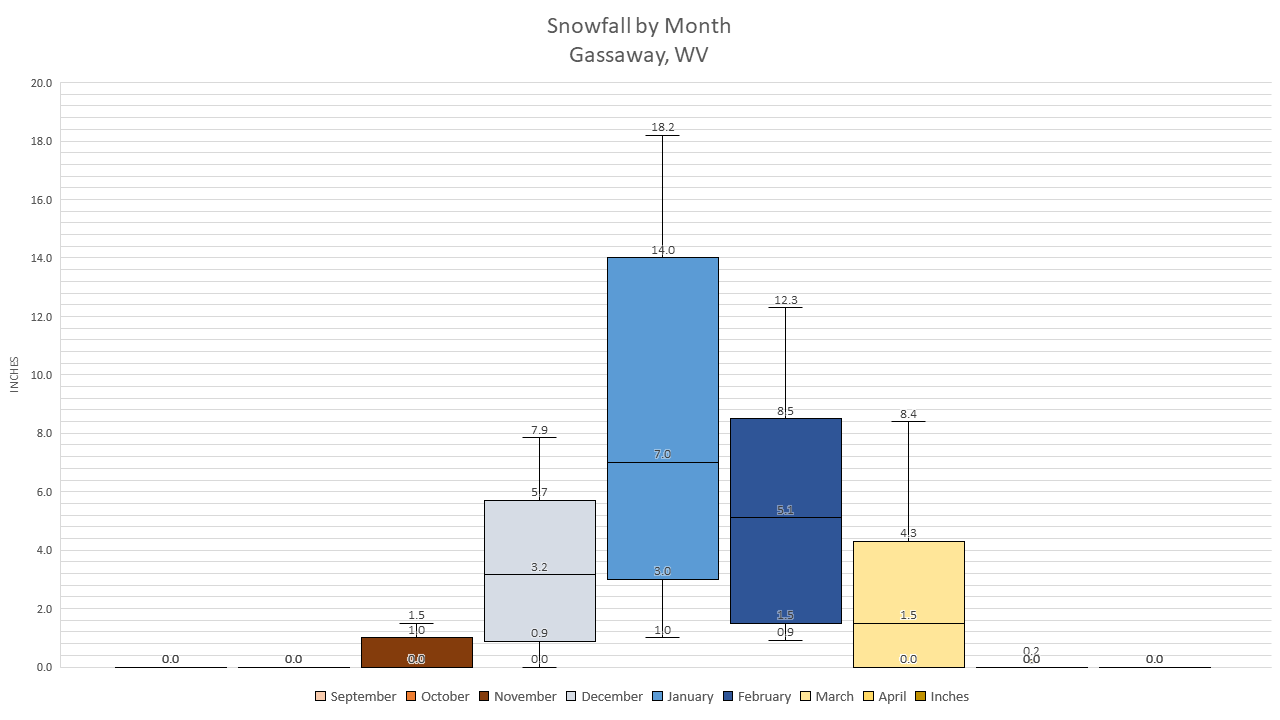
Gassaway, WV |
||||||
|
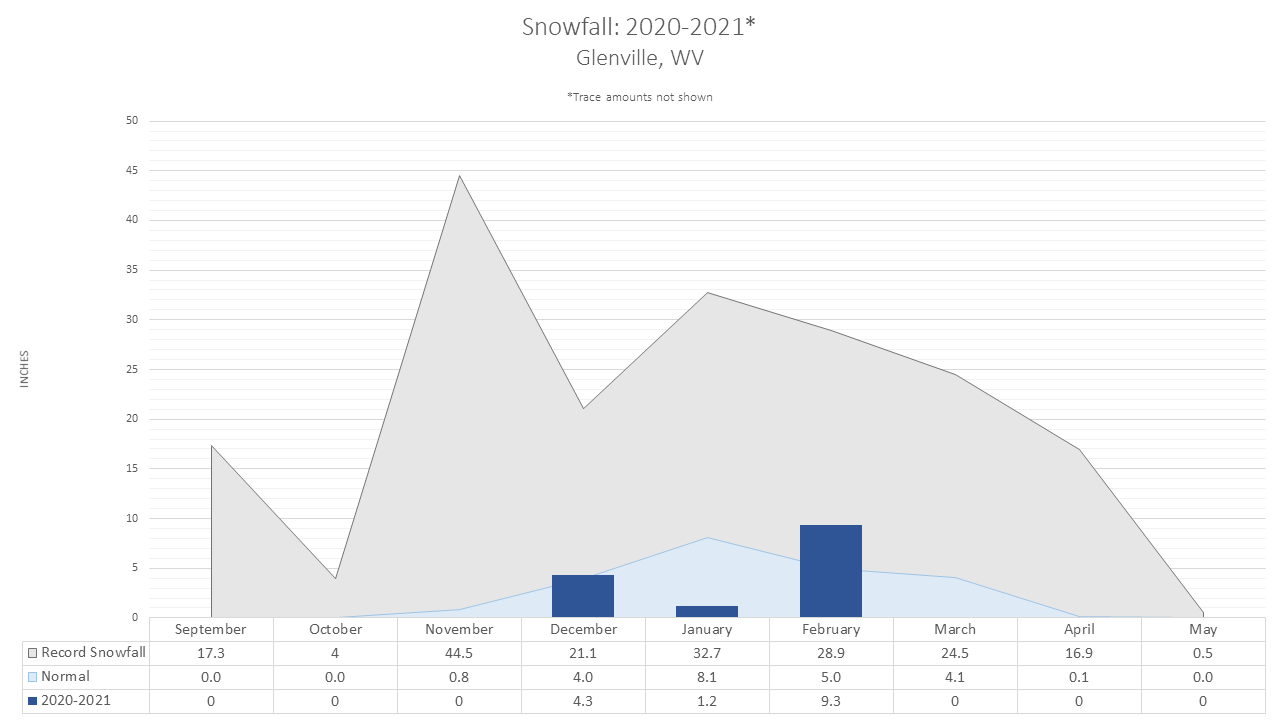
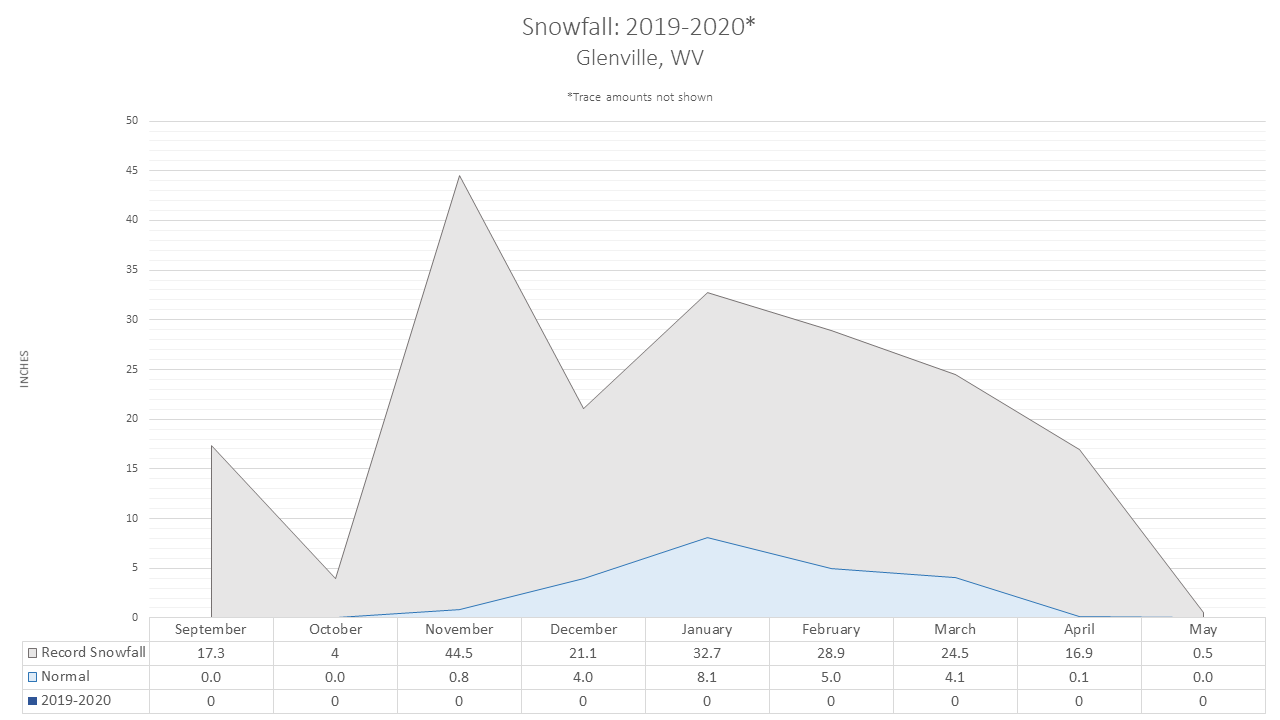
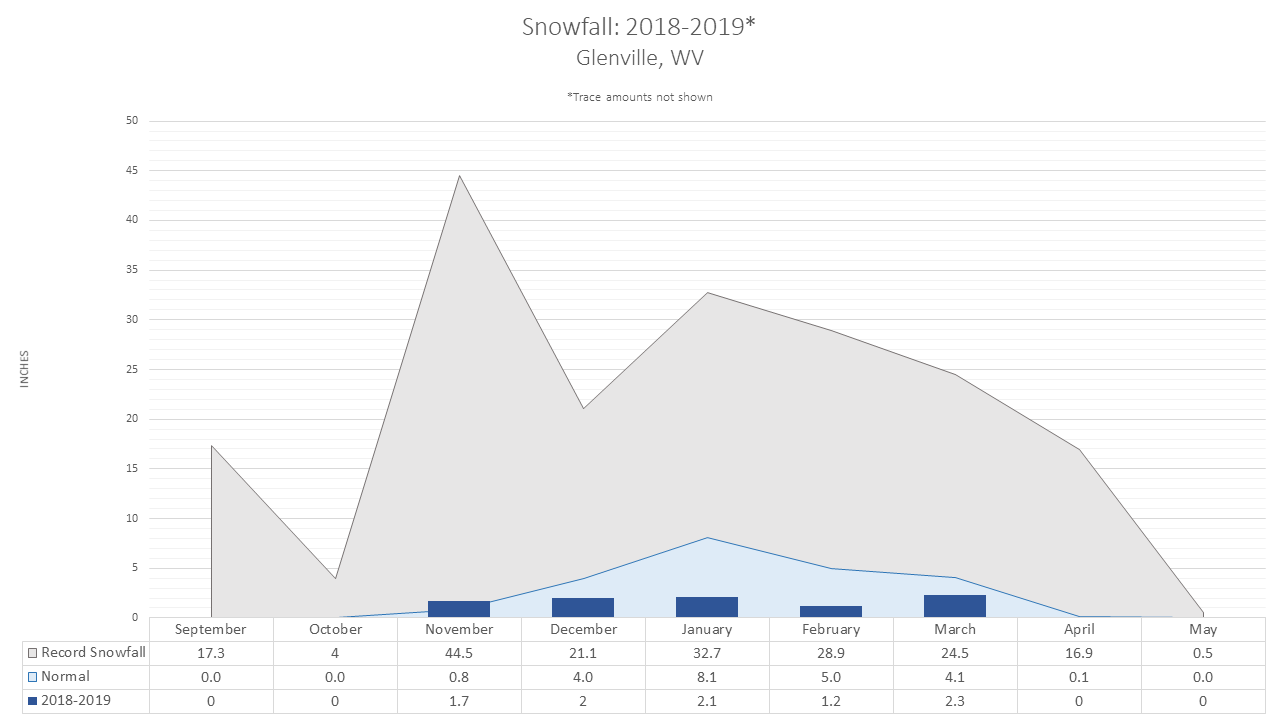
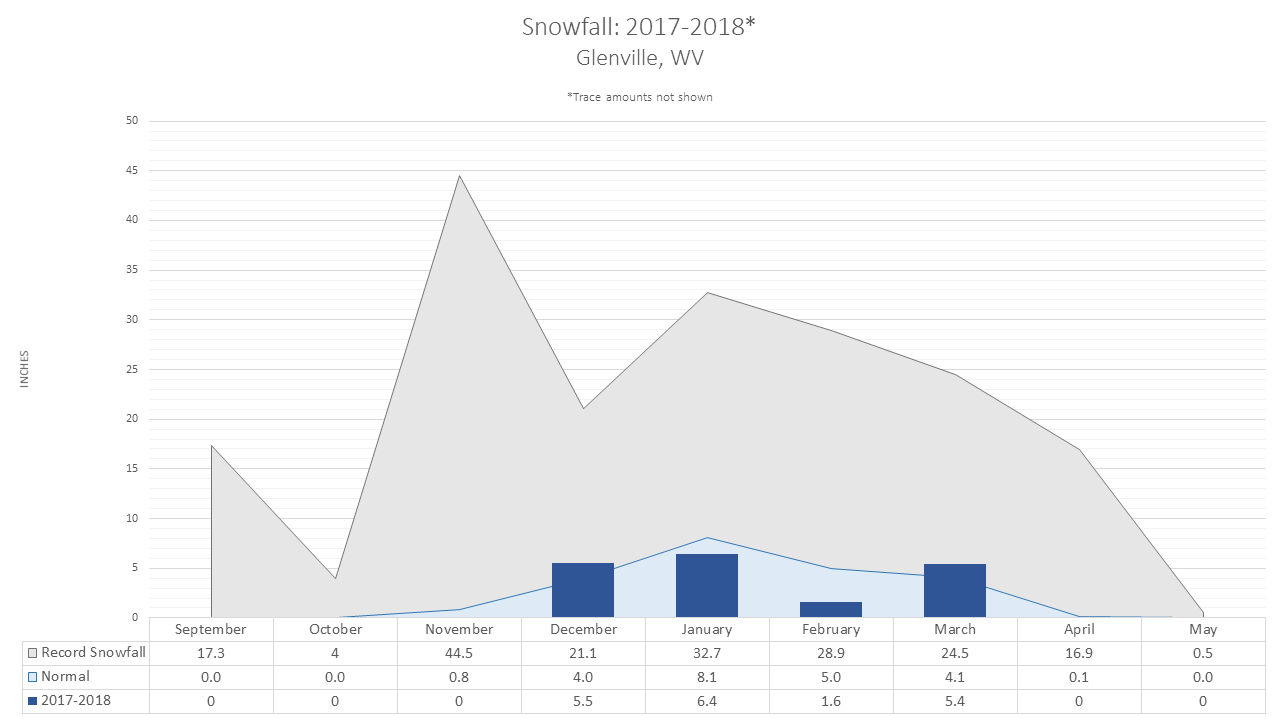
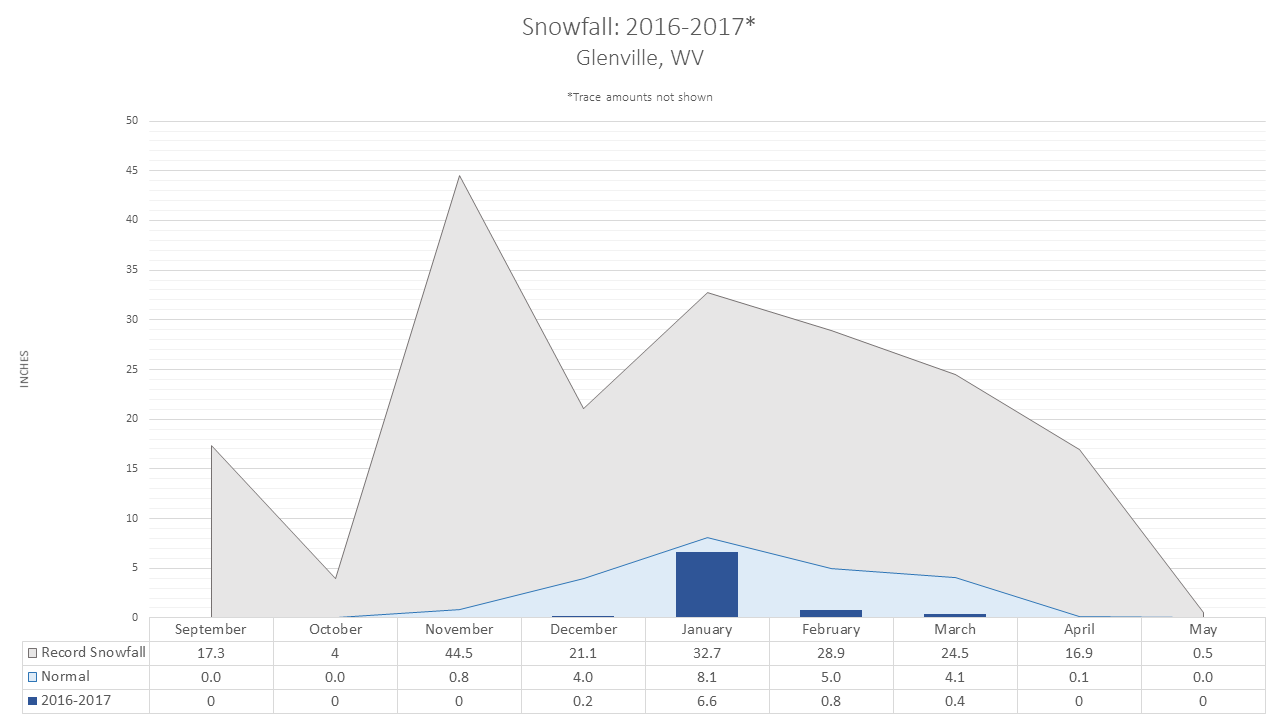
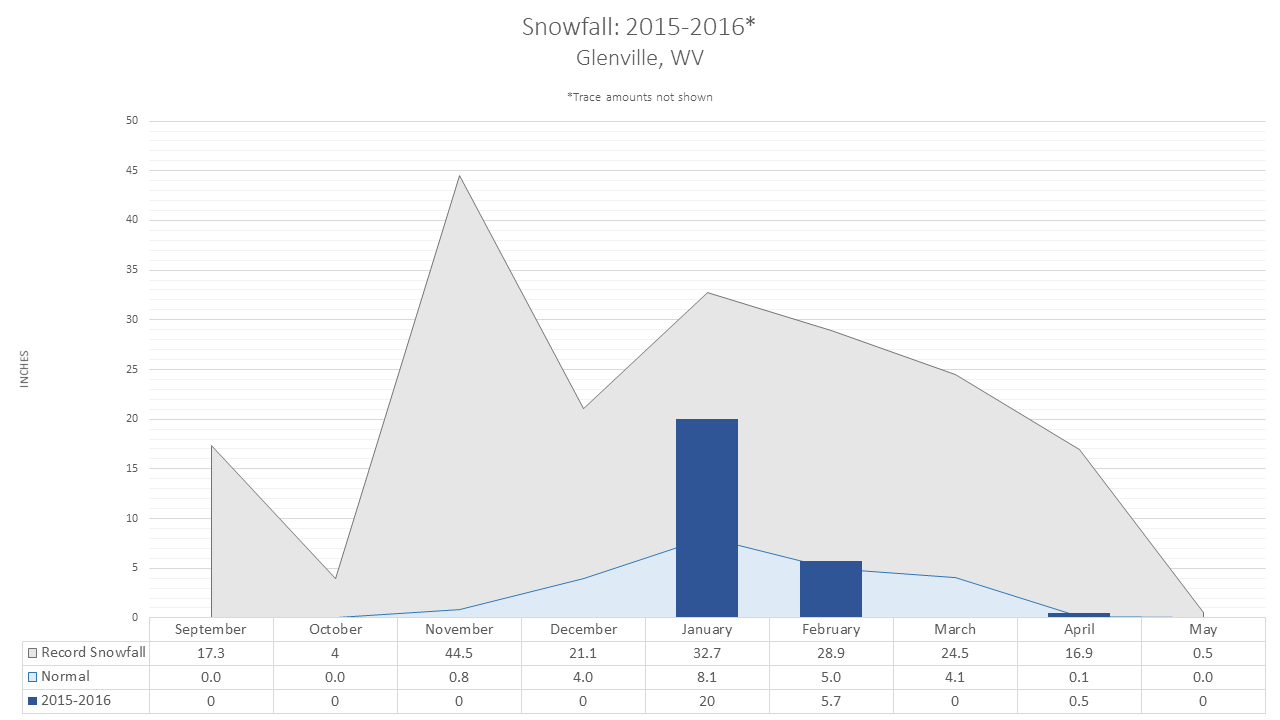
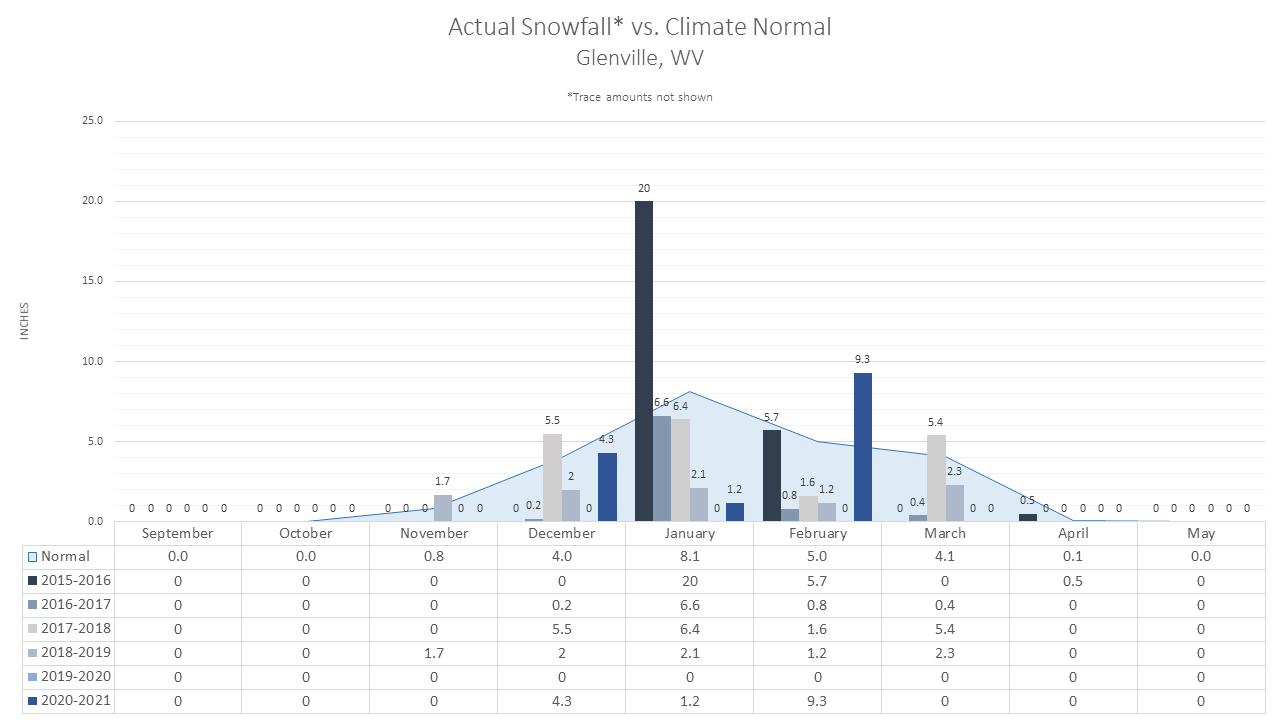
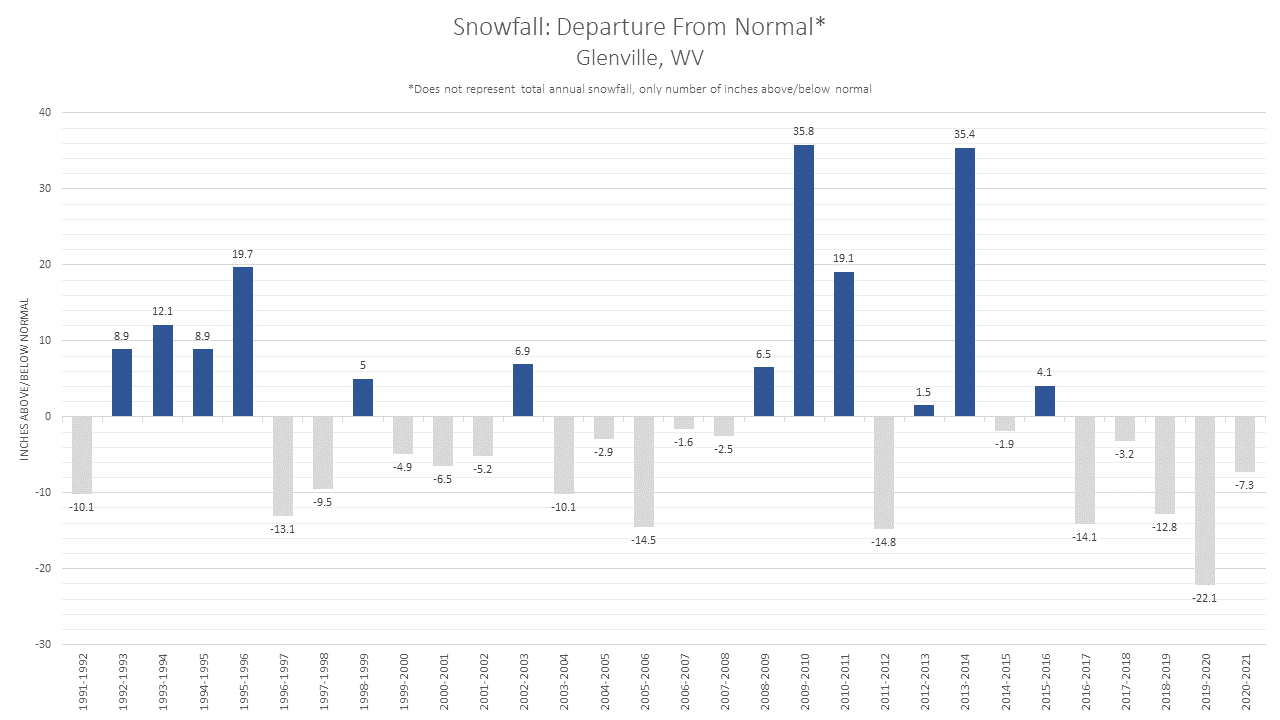
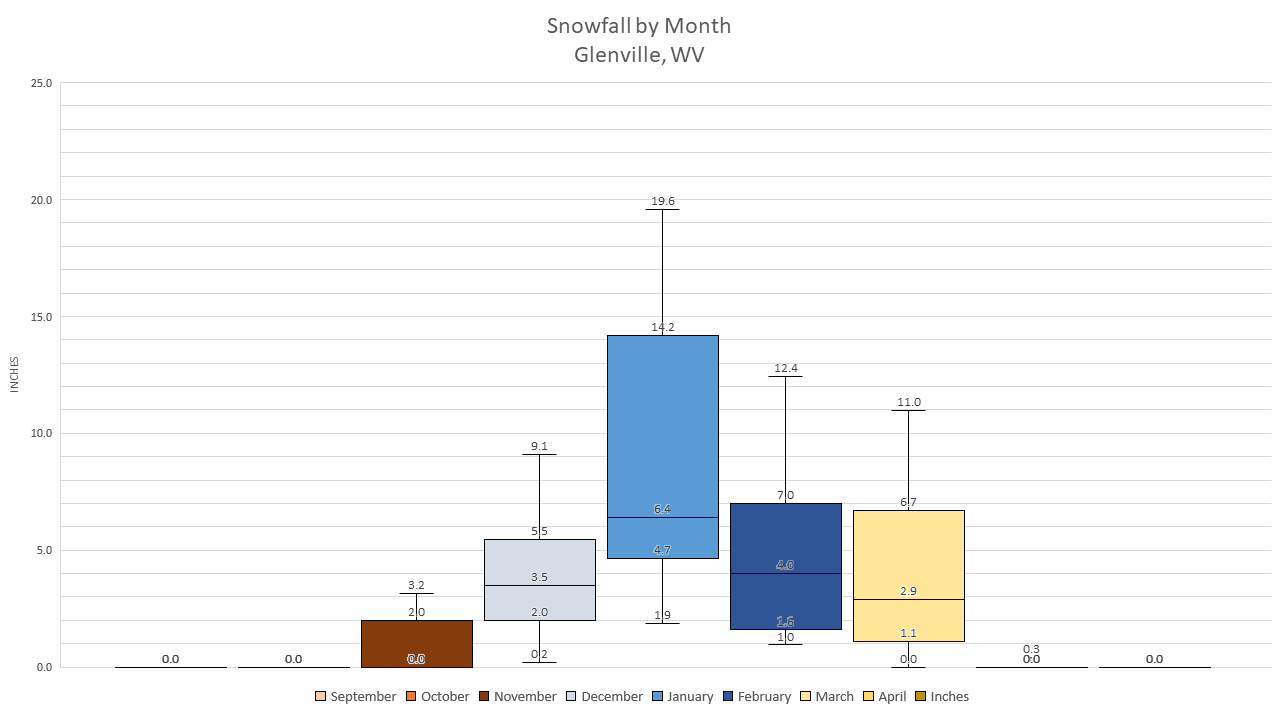
Glenville, WV |
||||||
|
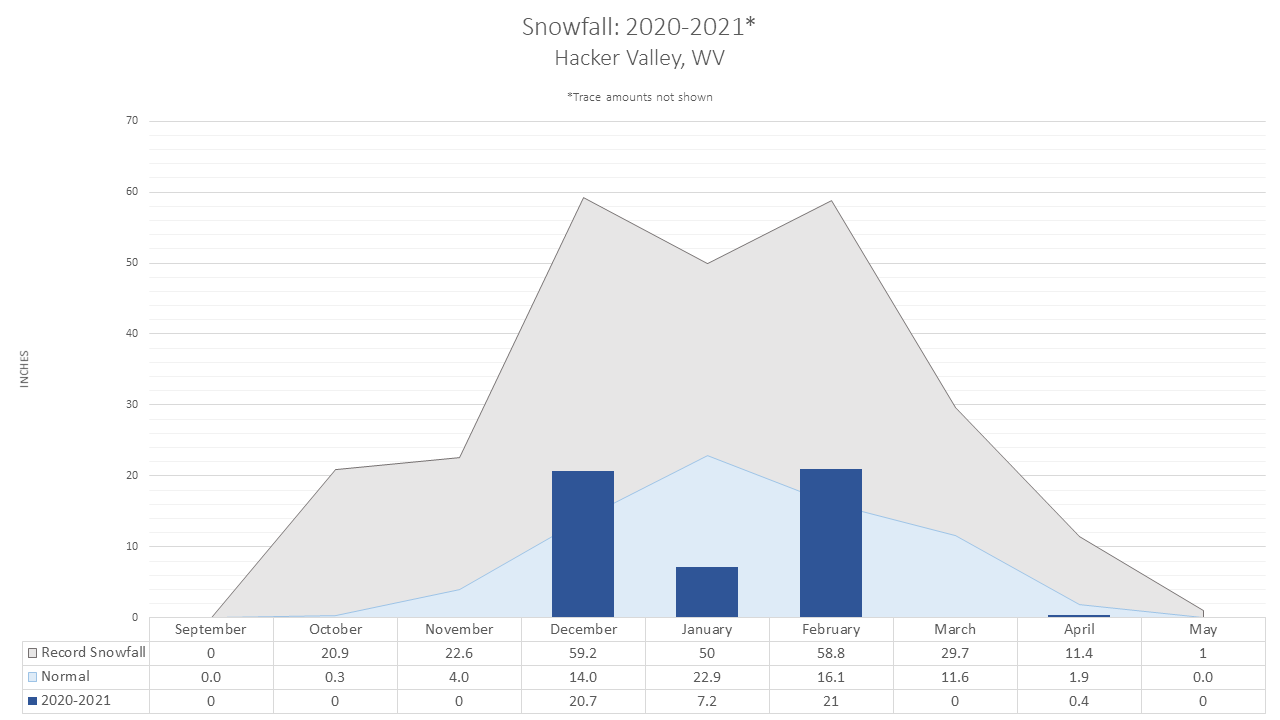
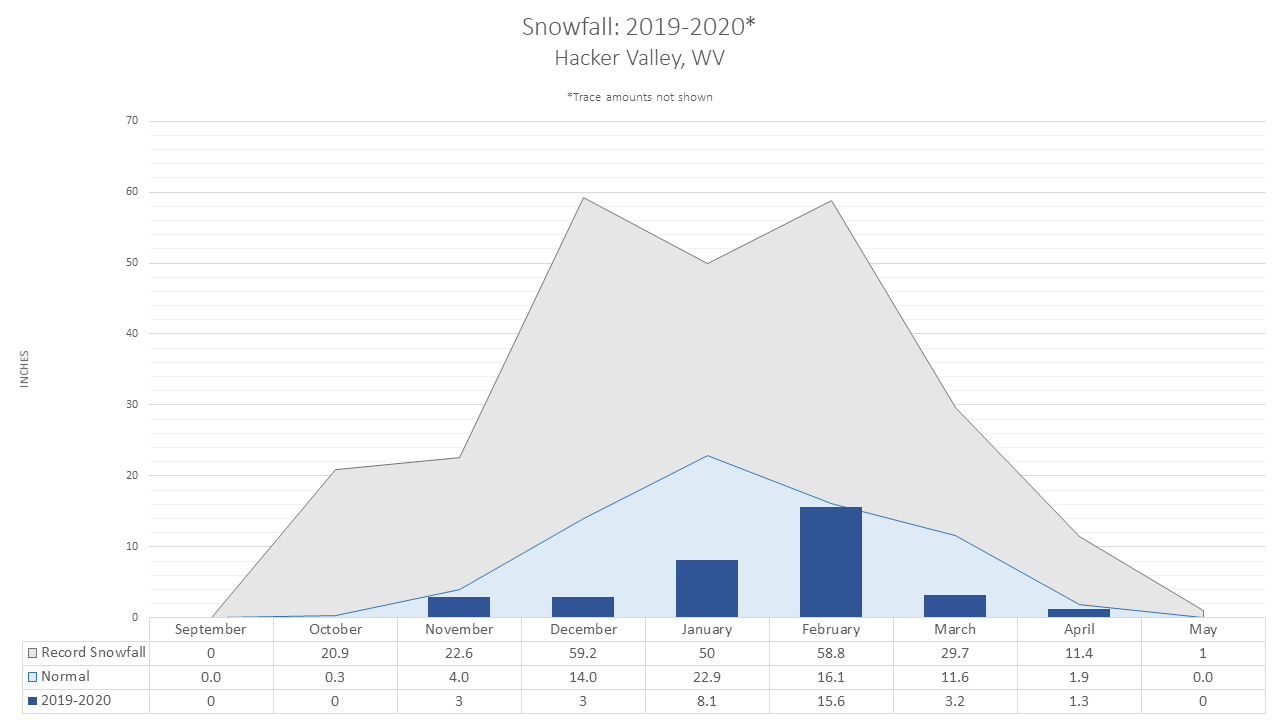
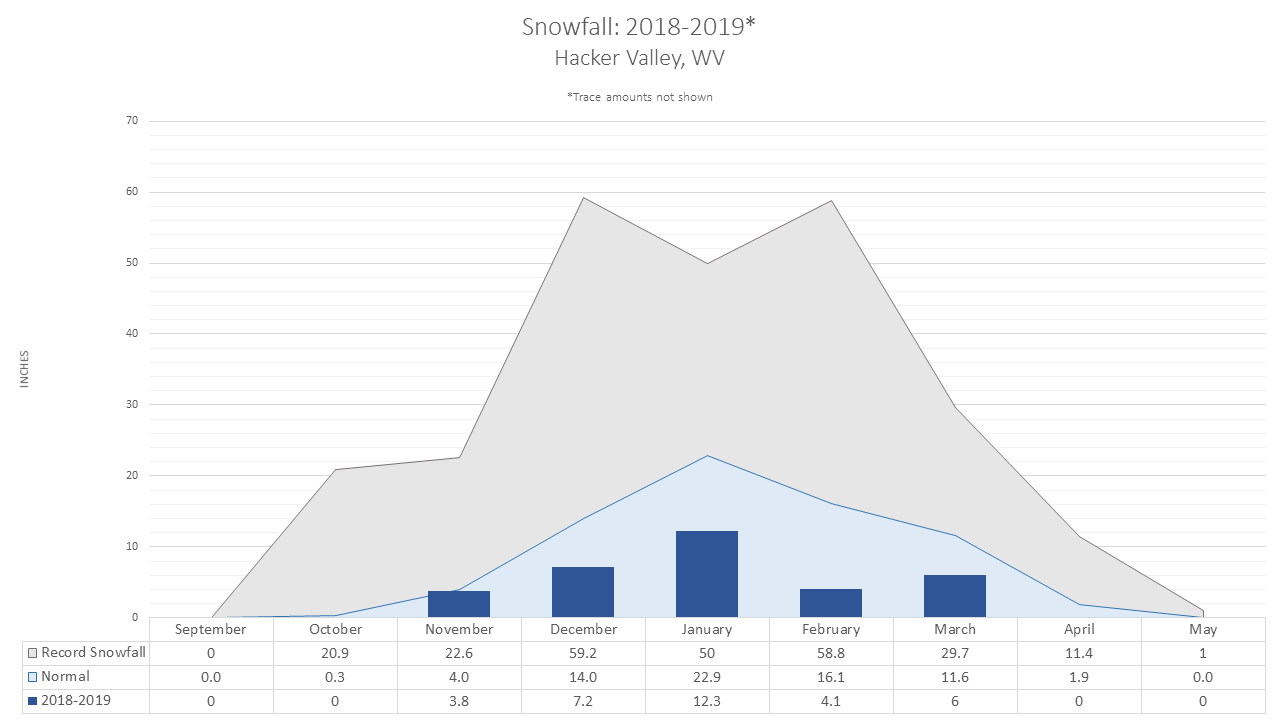
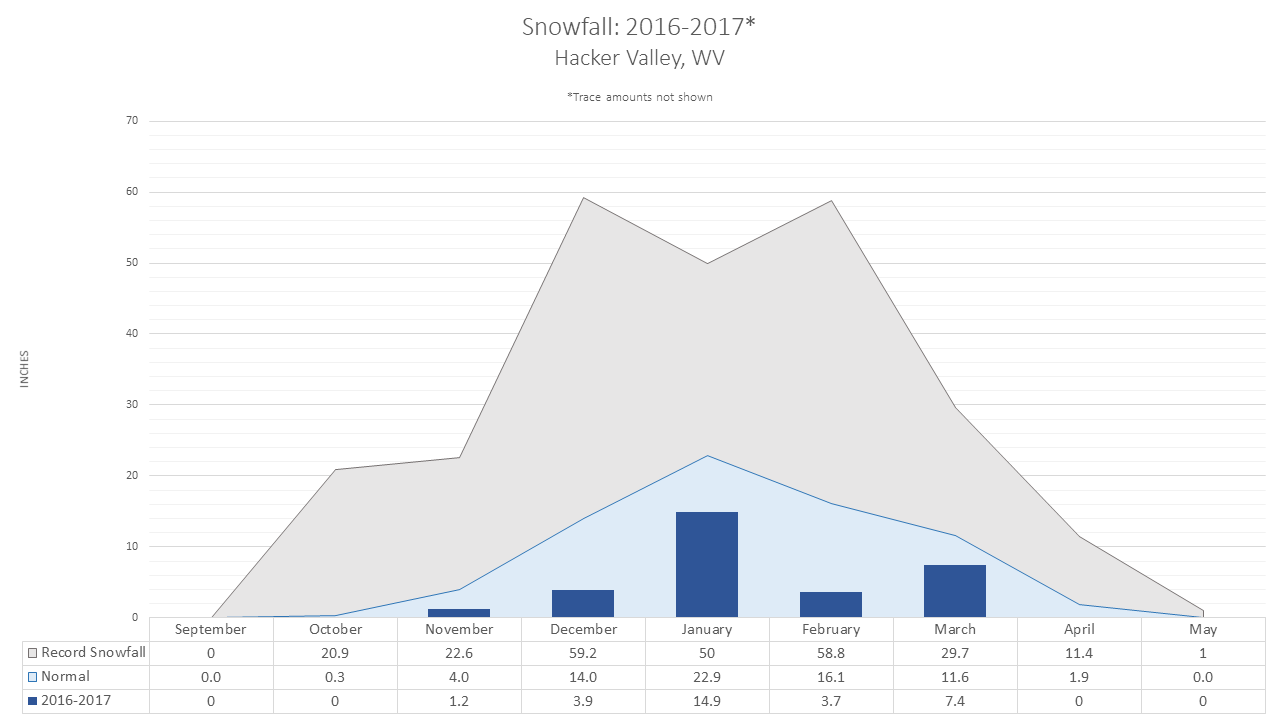
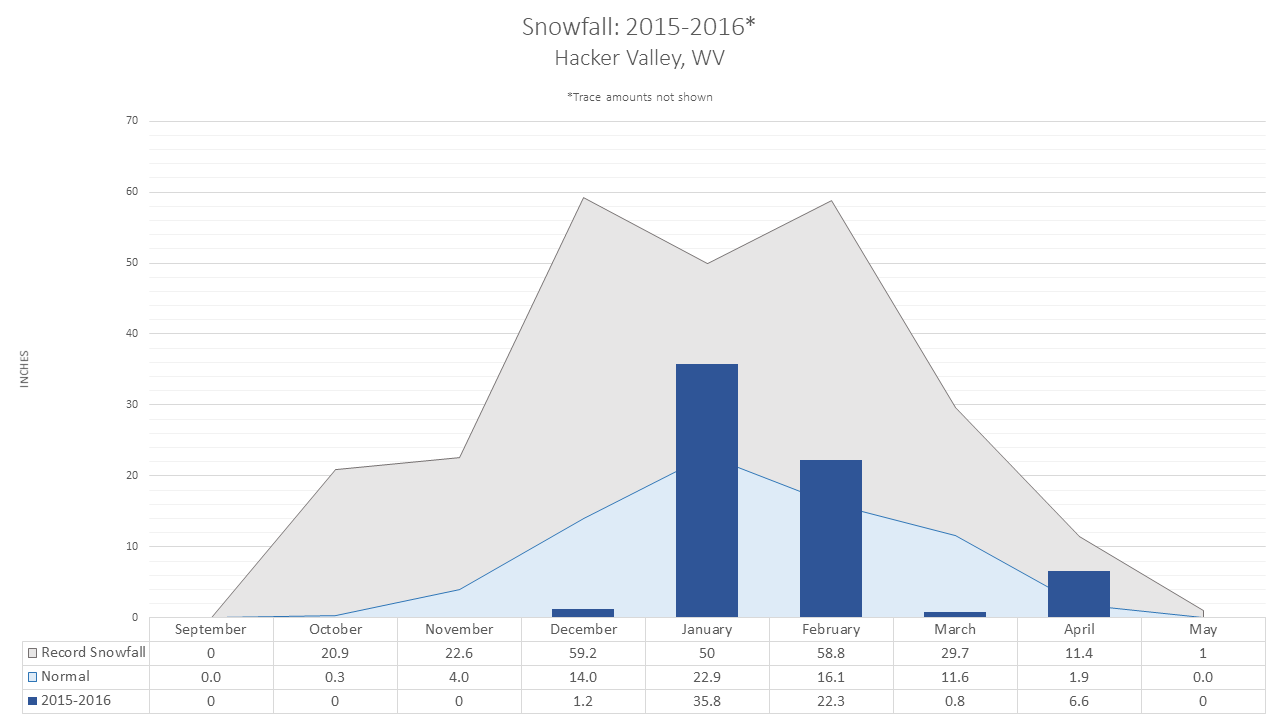
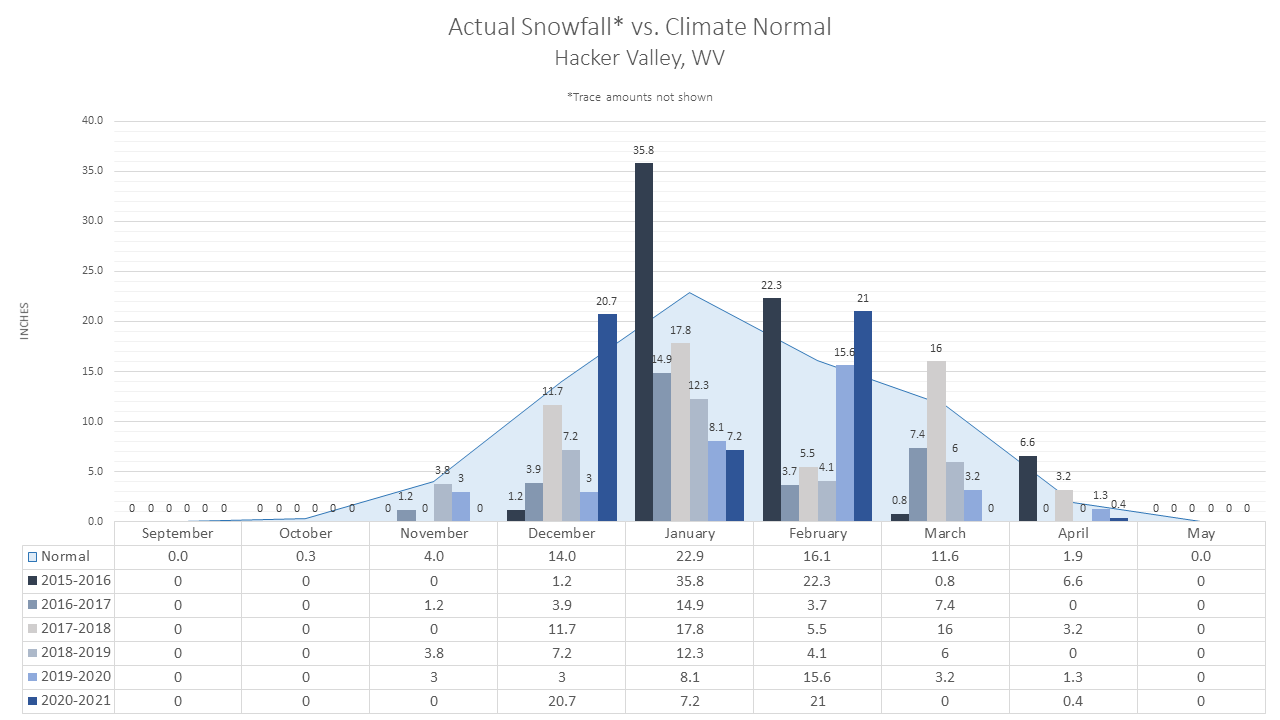
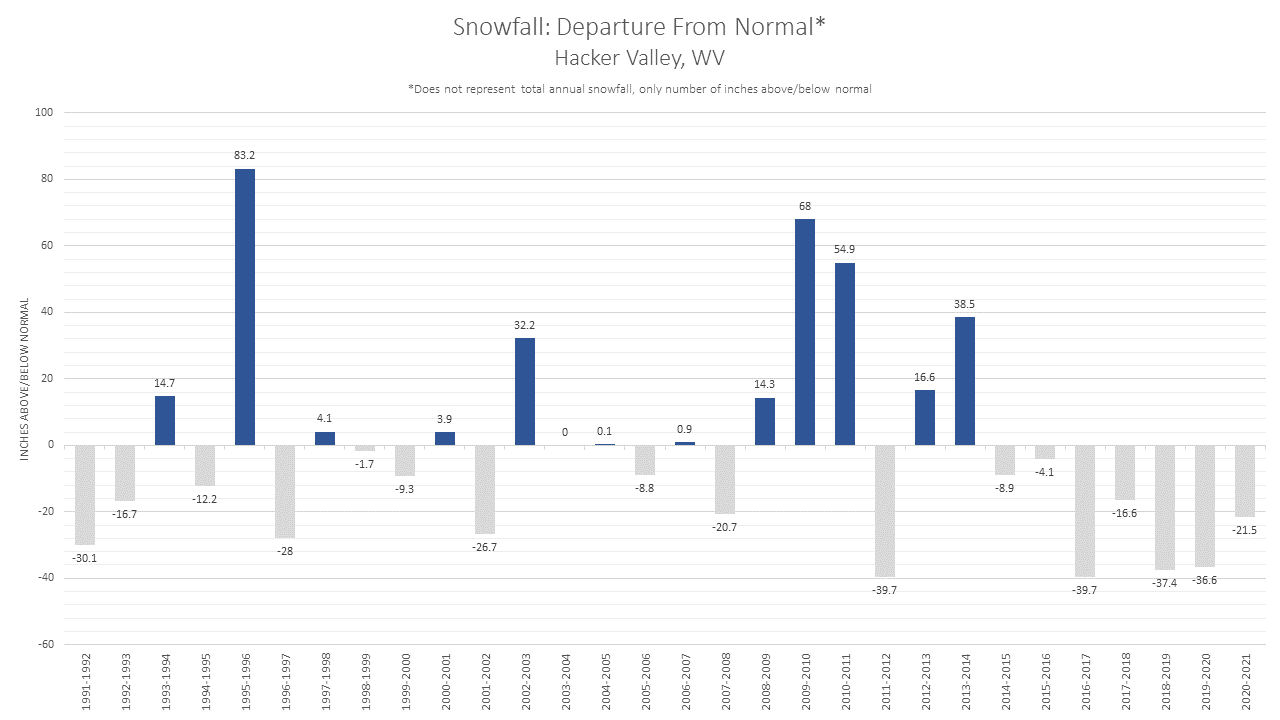
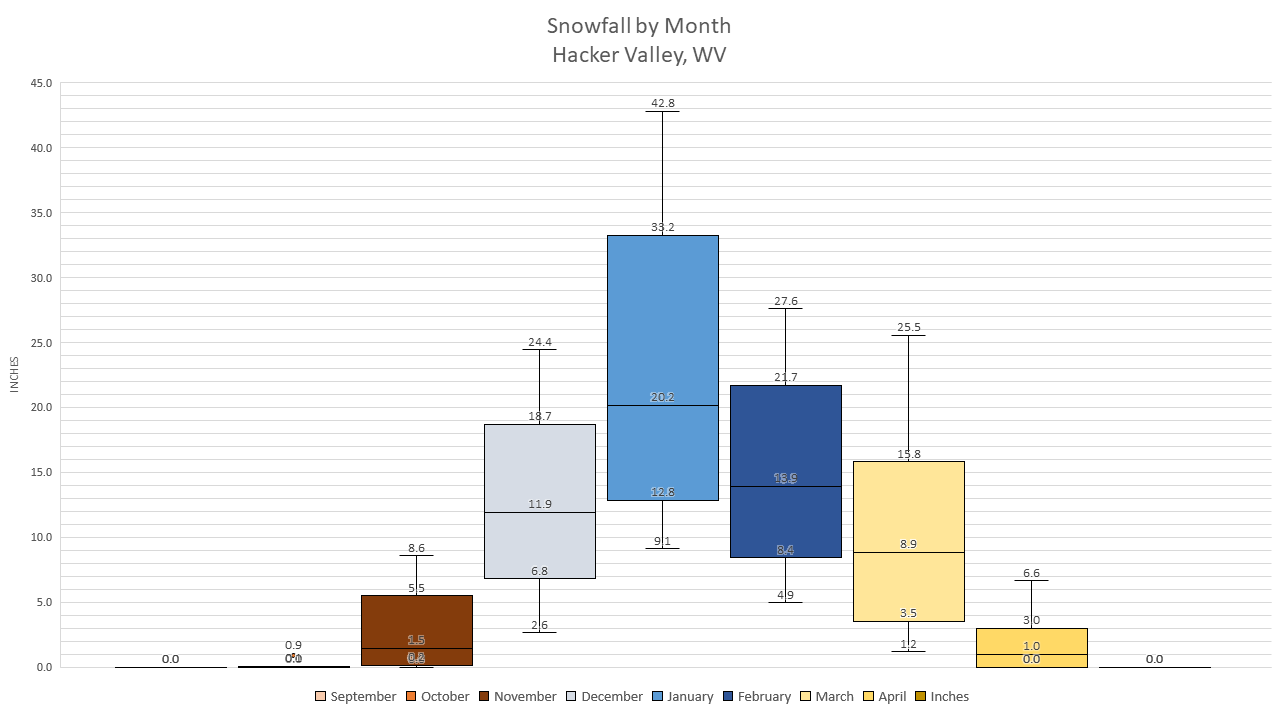
Hacker Valley, WV |
||||||
|
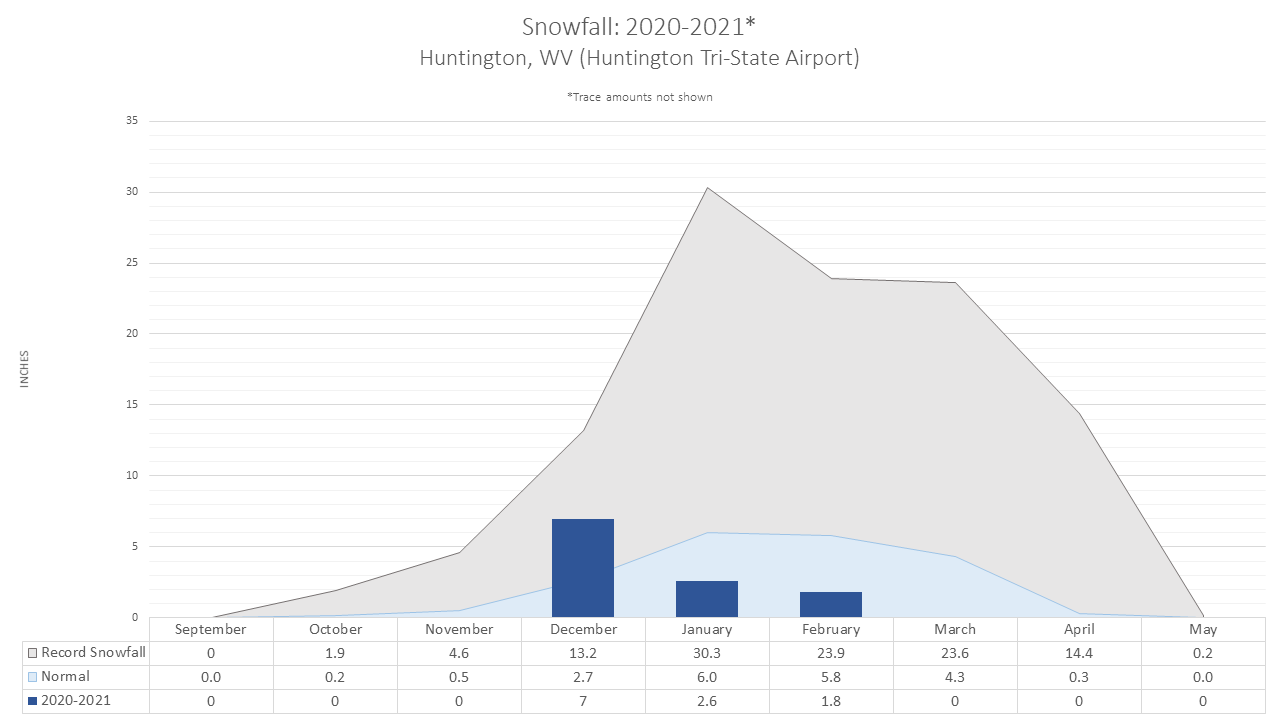
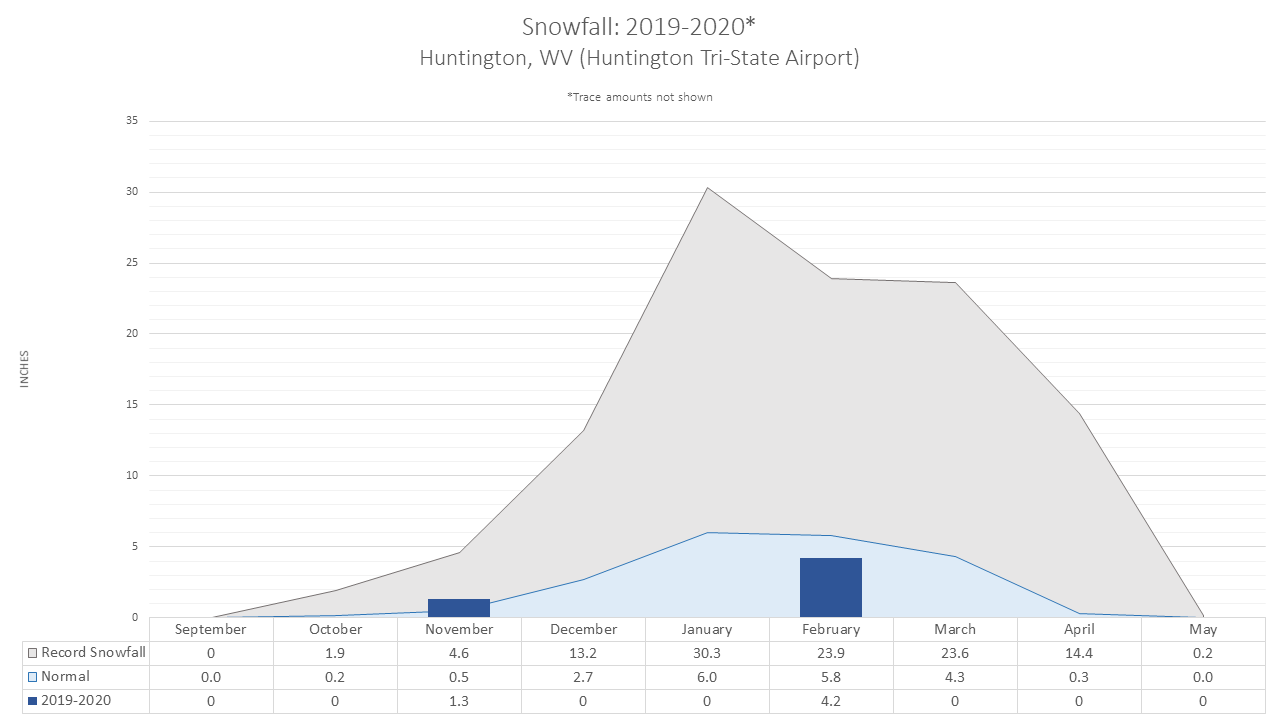
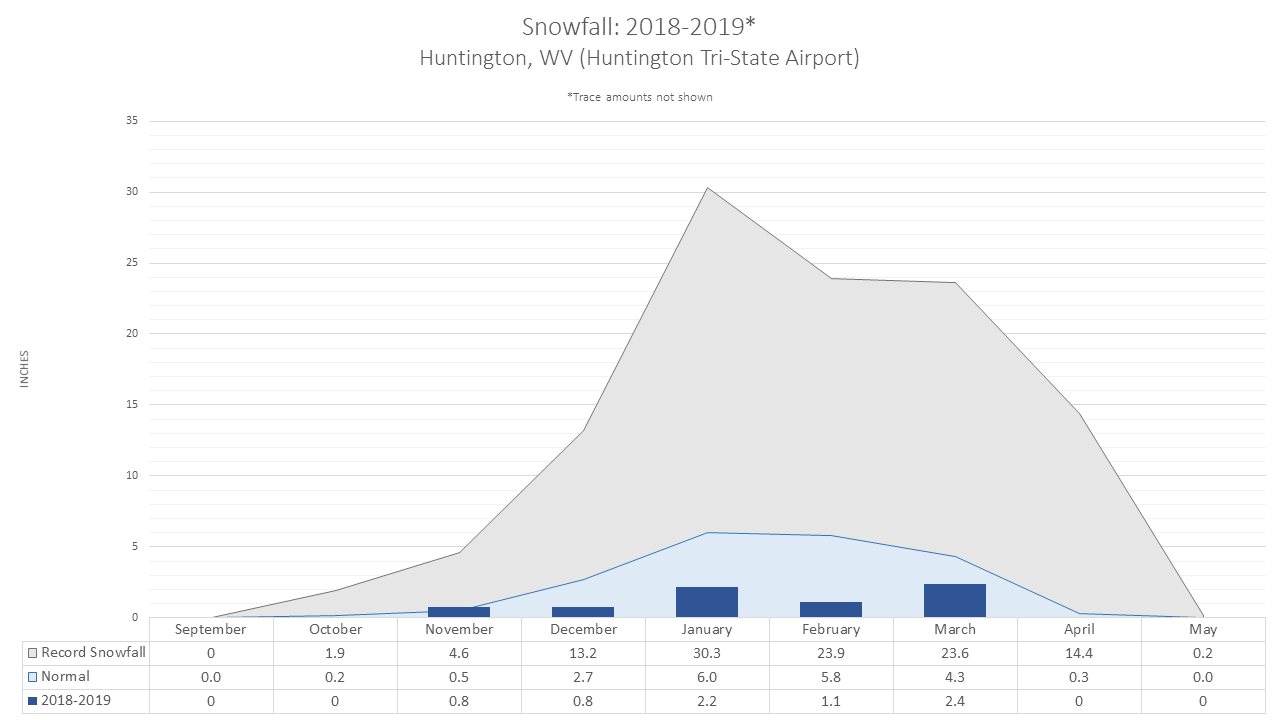
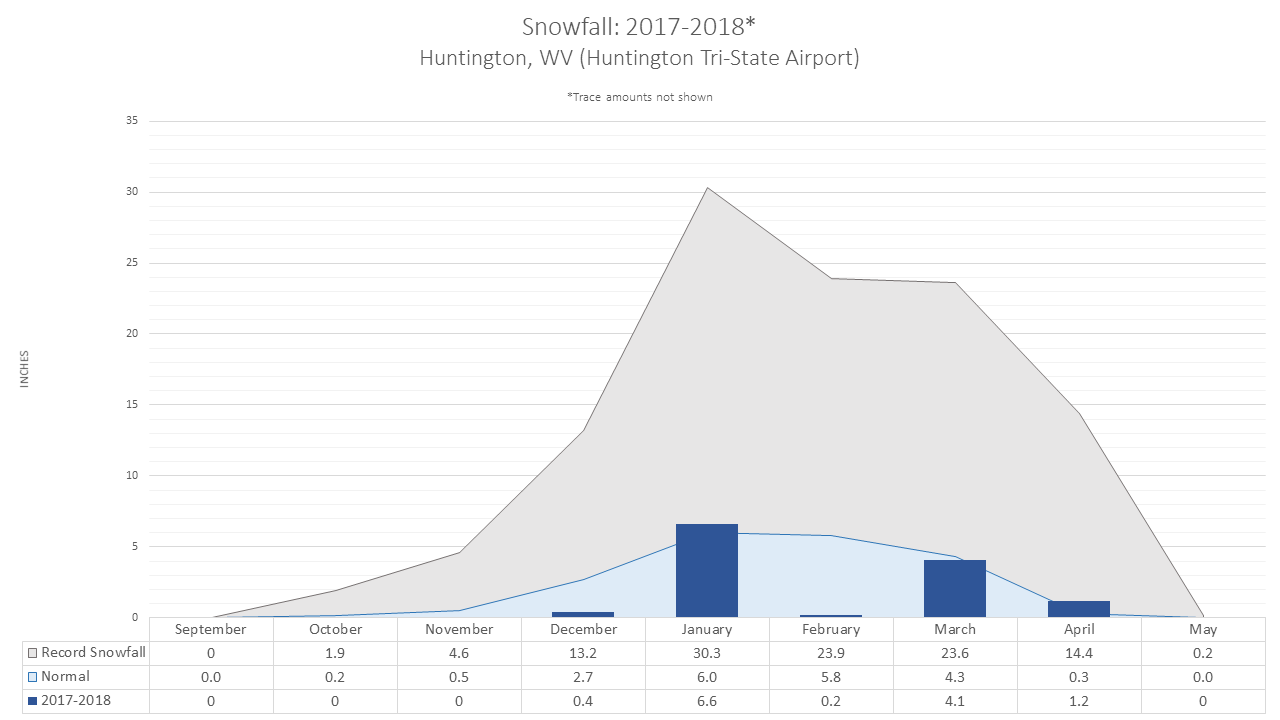
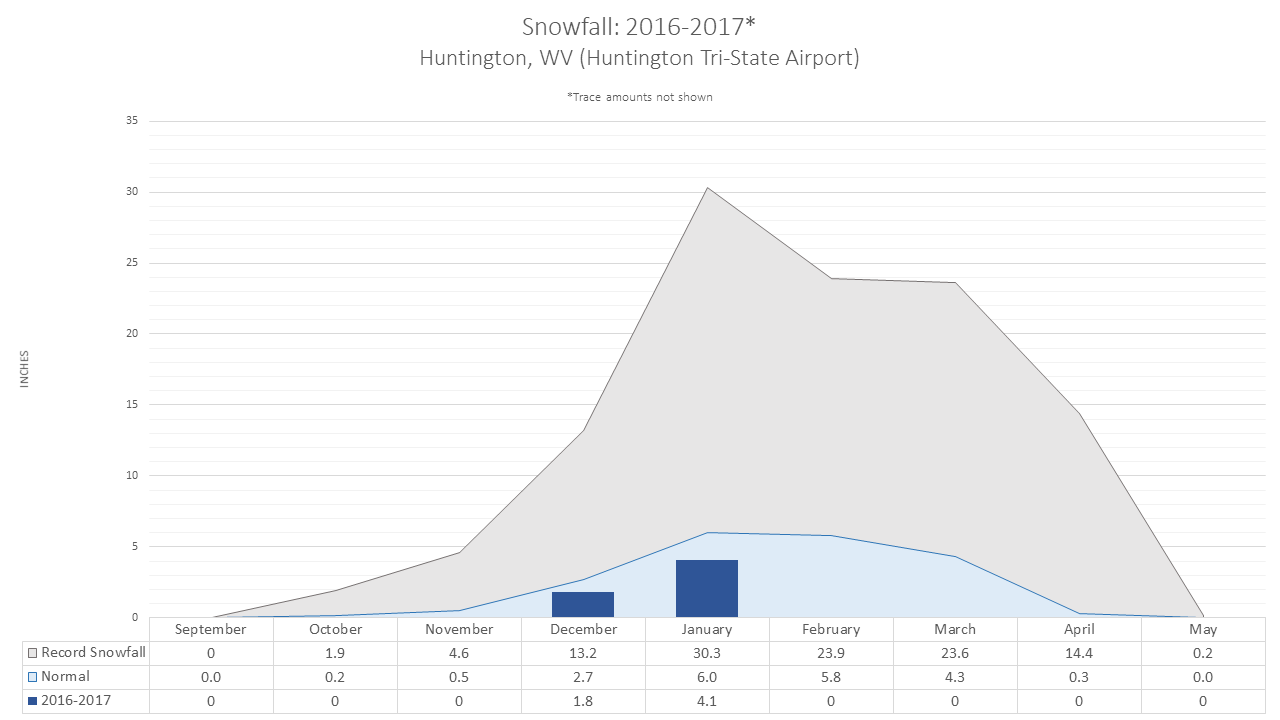
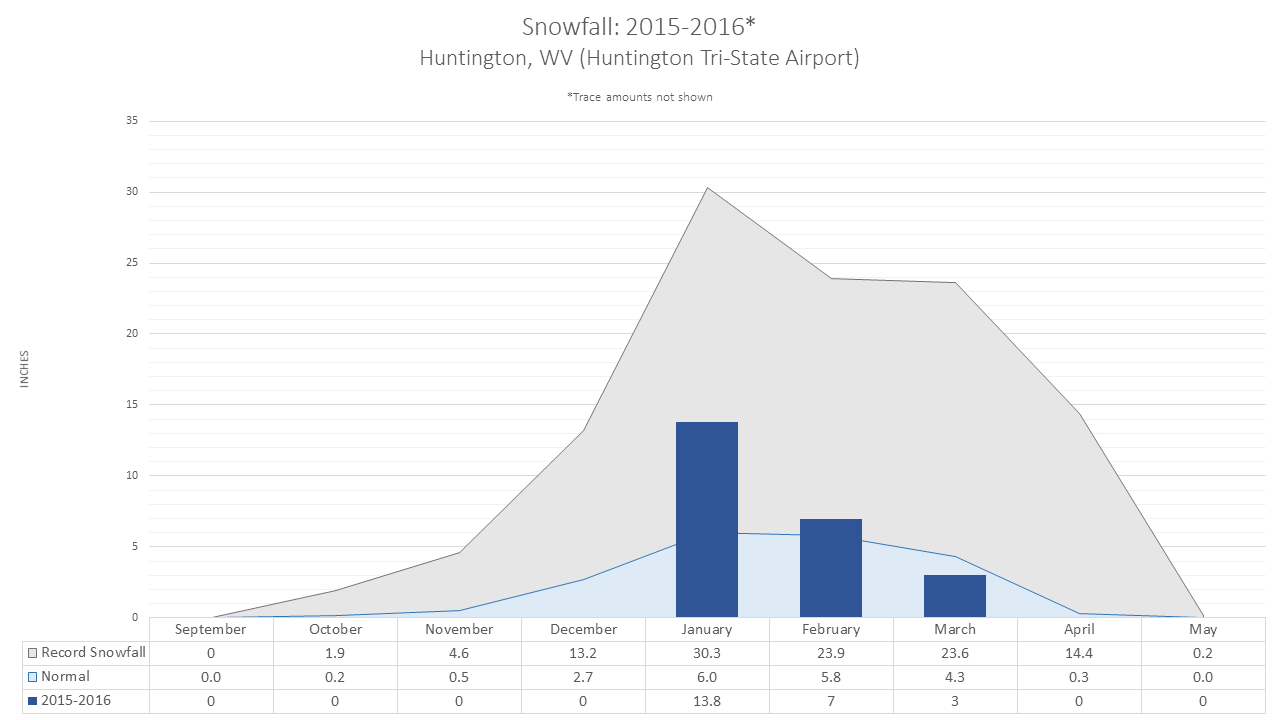
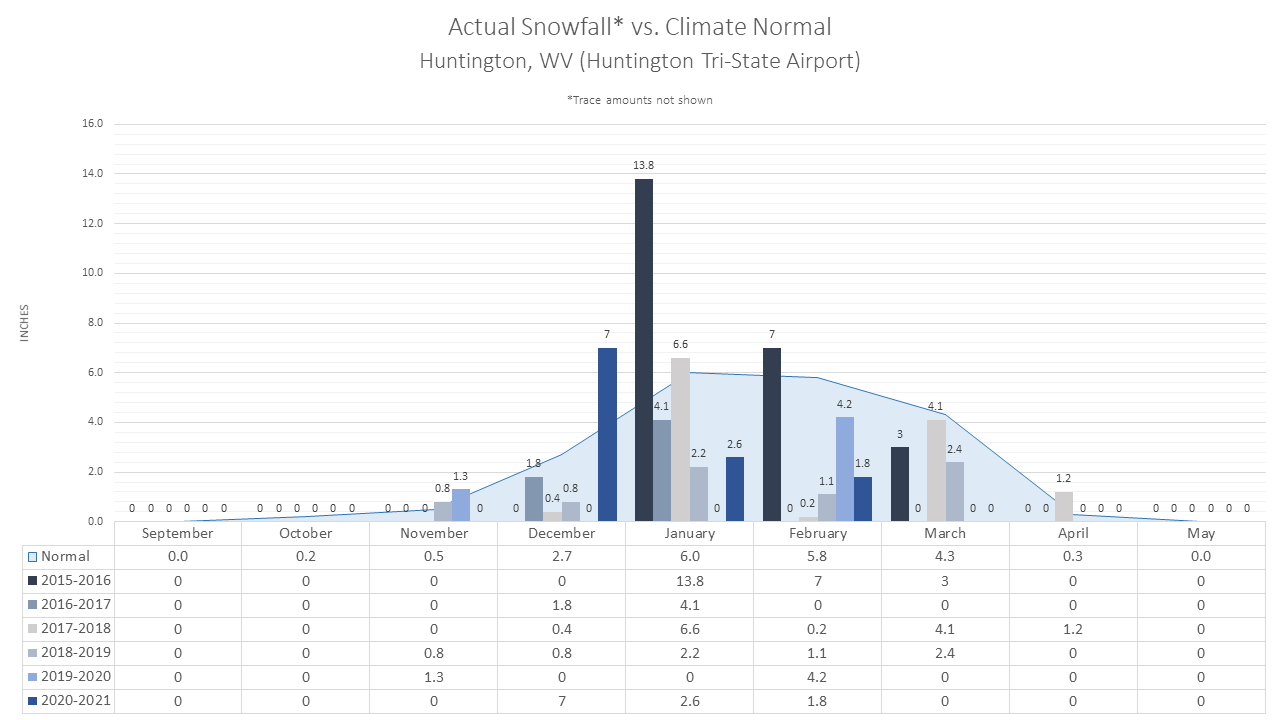
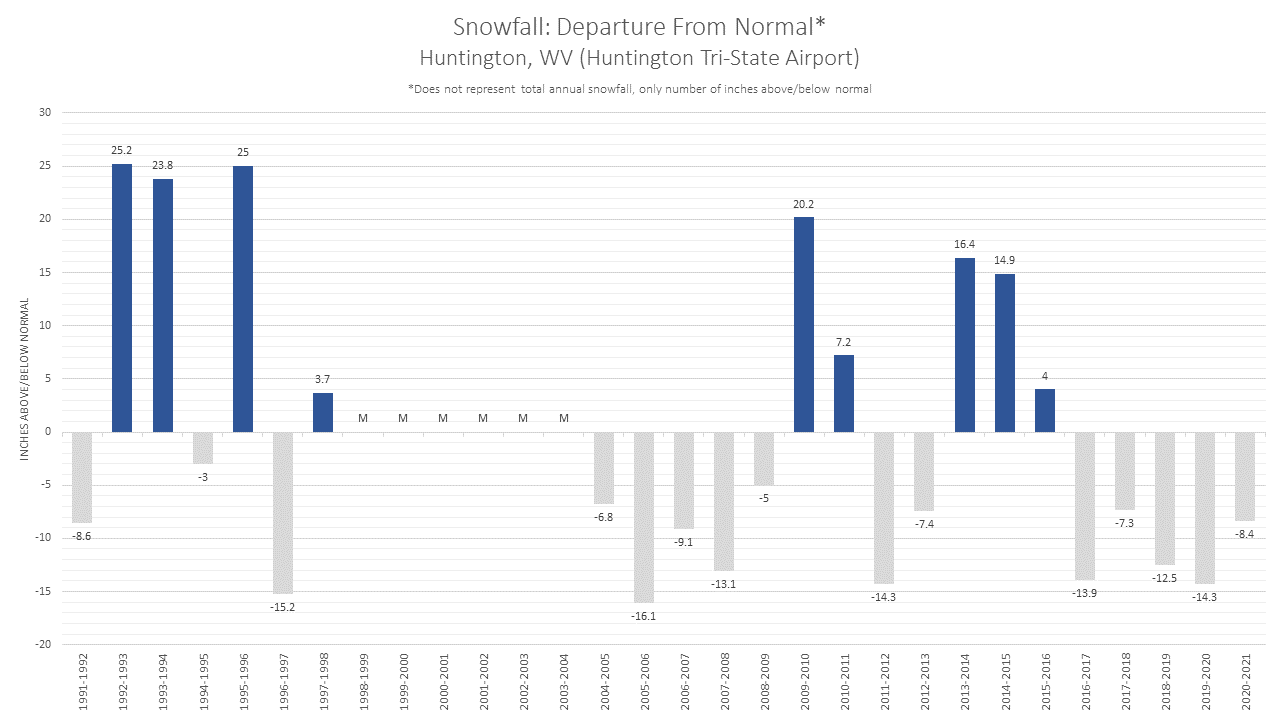
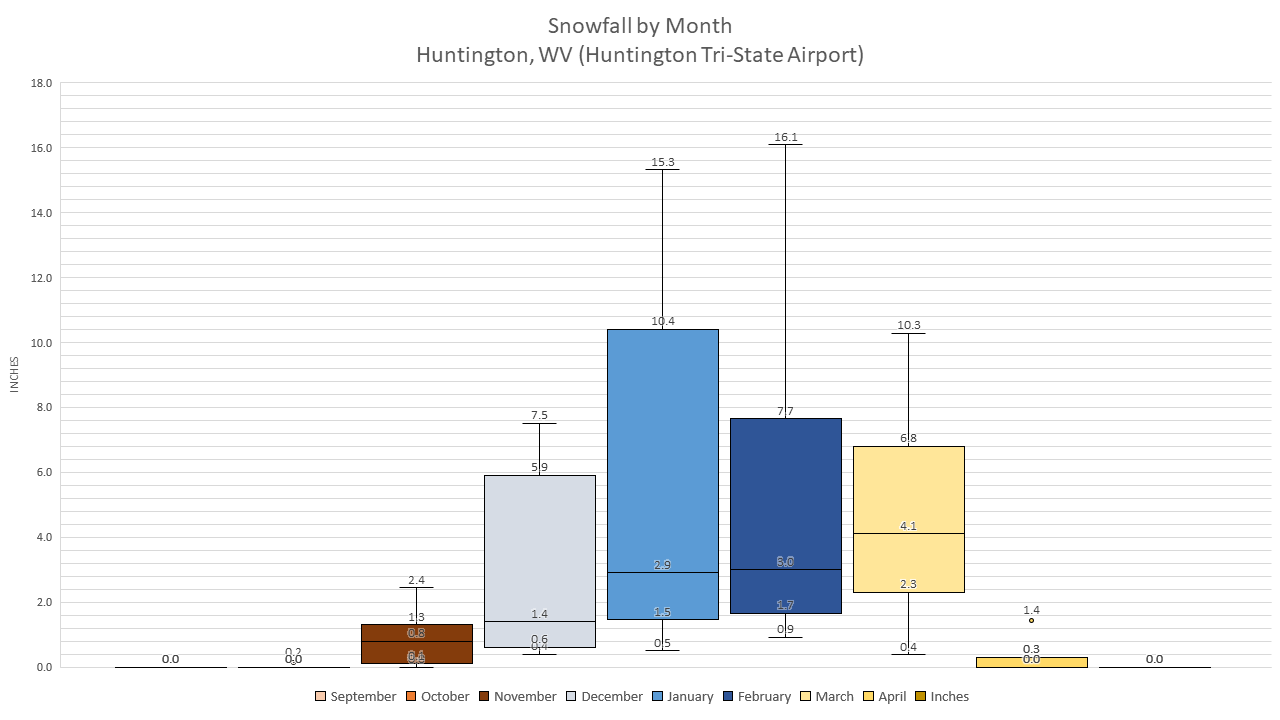
Huntington, WV (Huntington Tri-State Airport) |
||||||
|
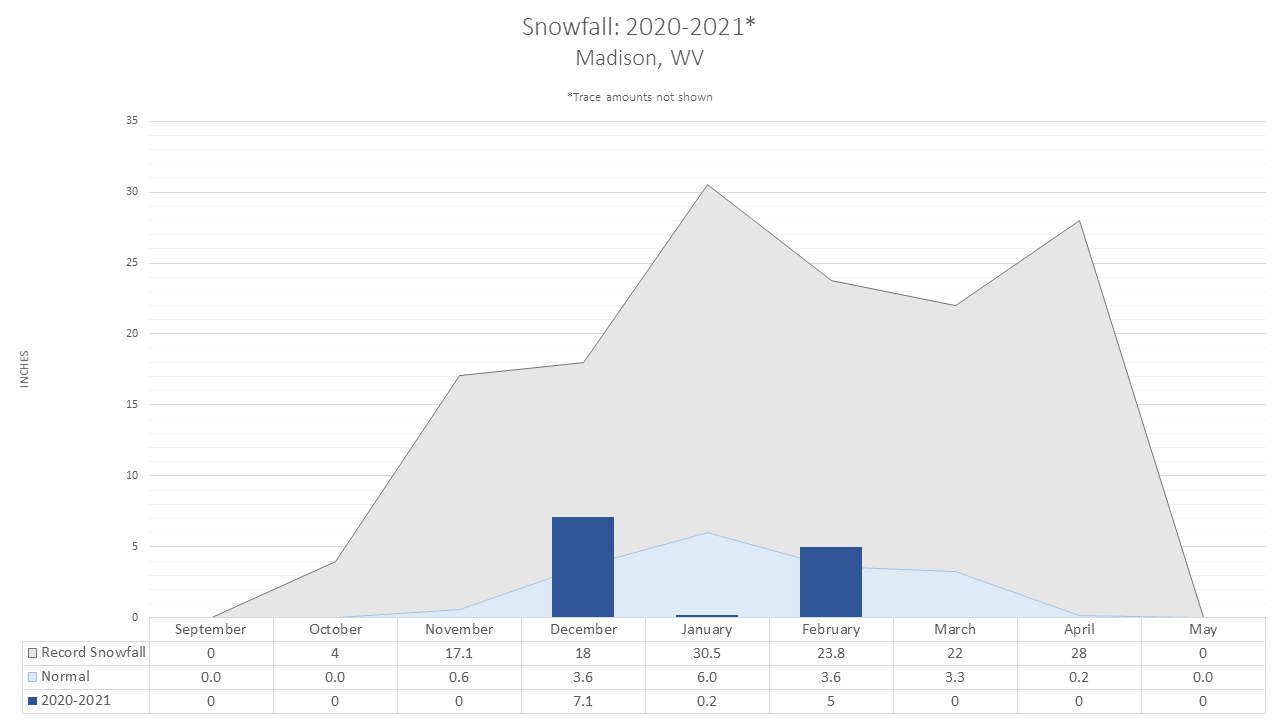
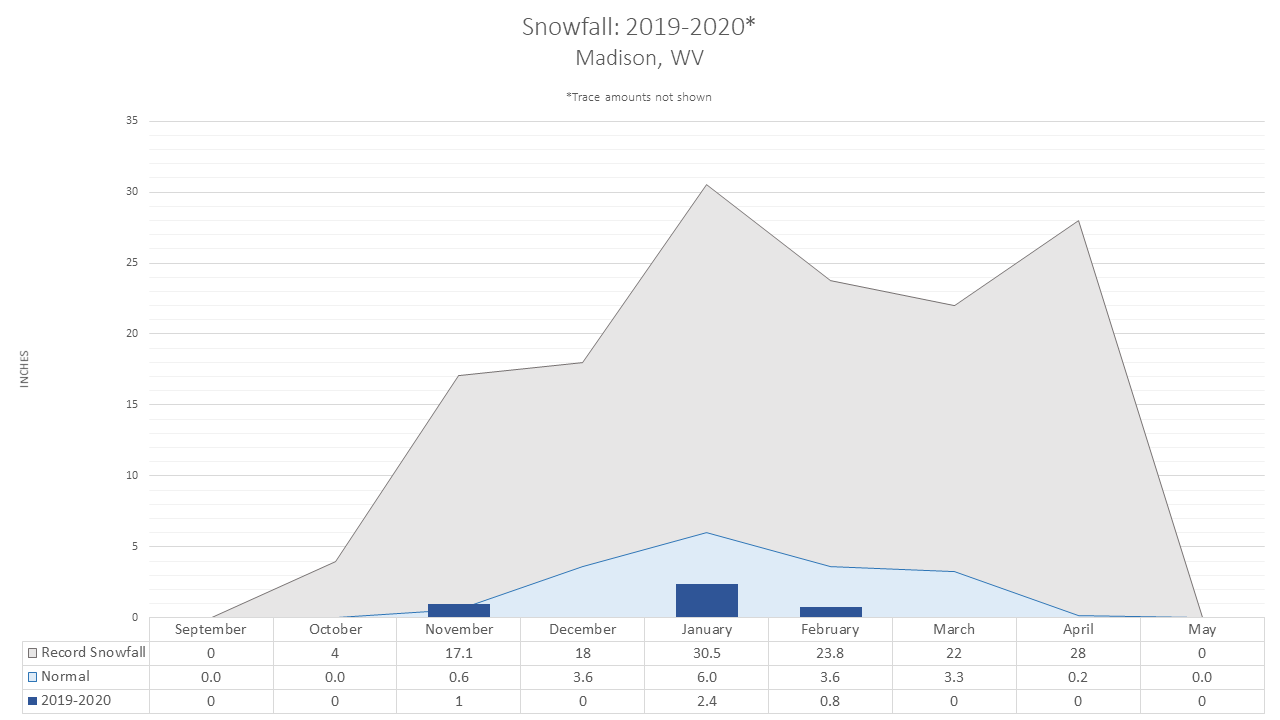
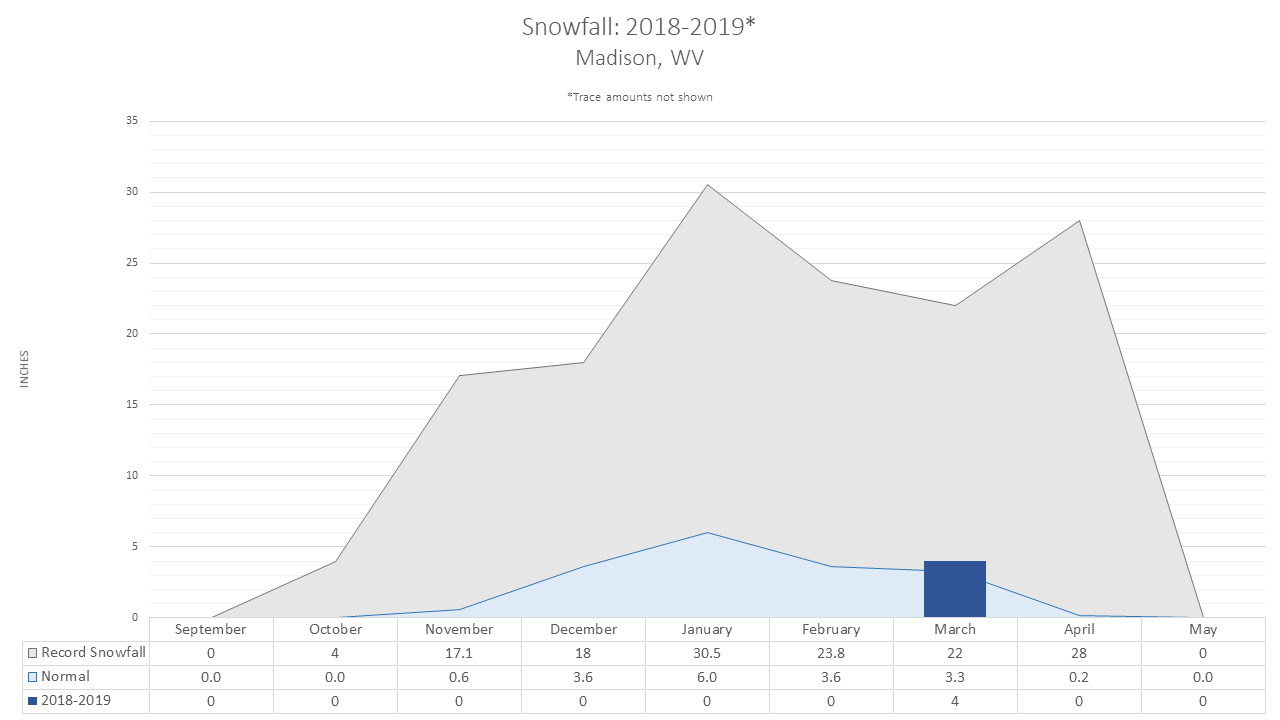
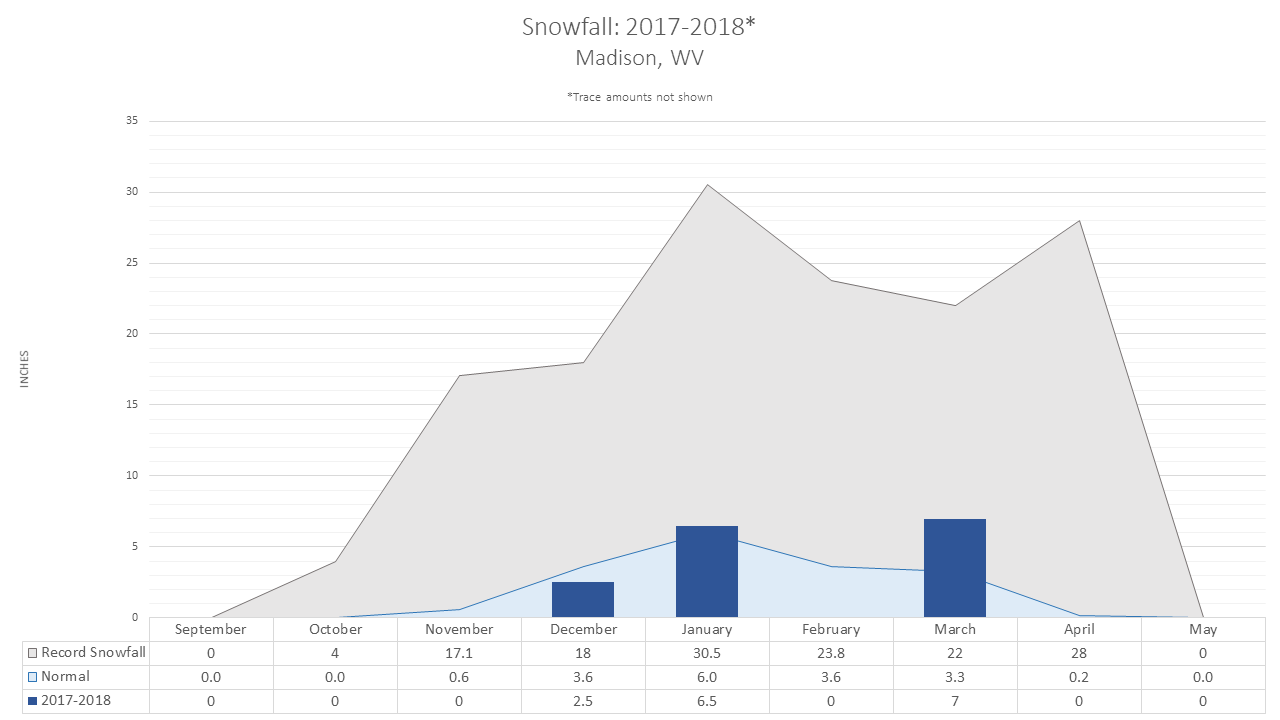
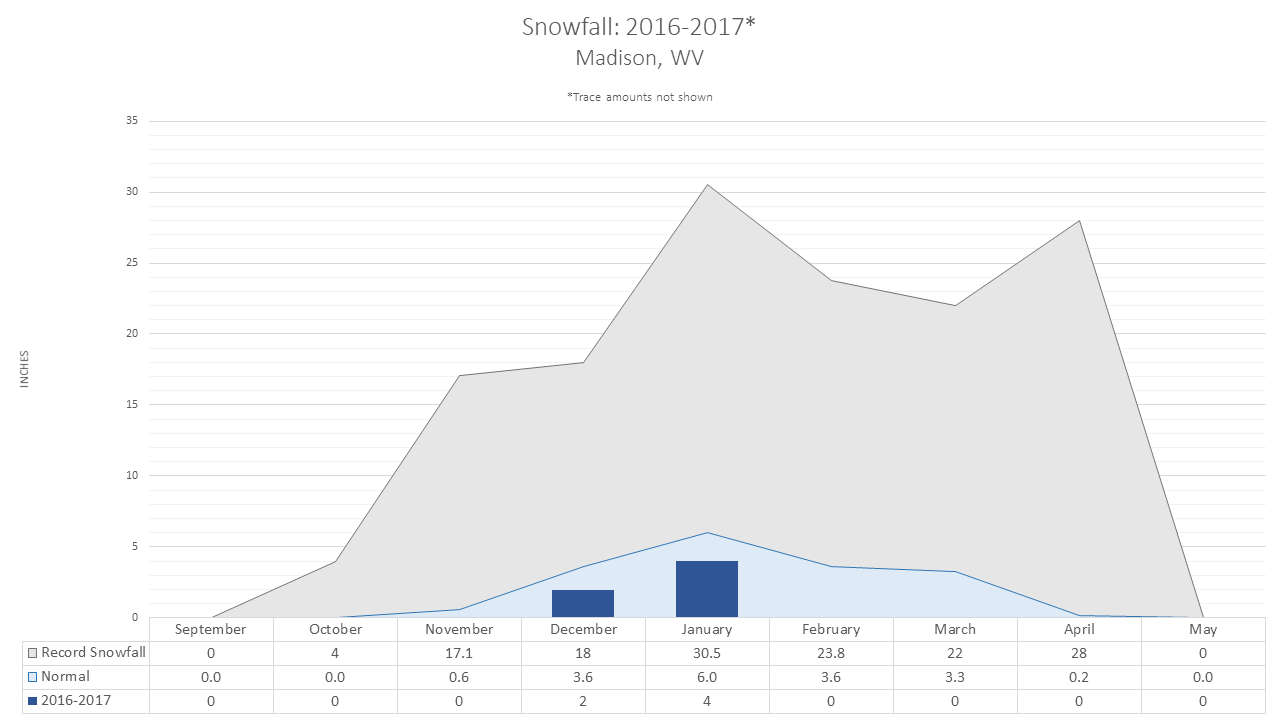
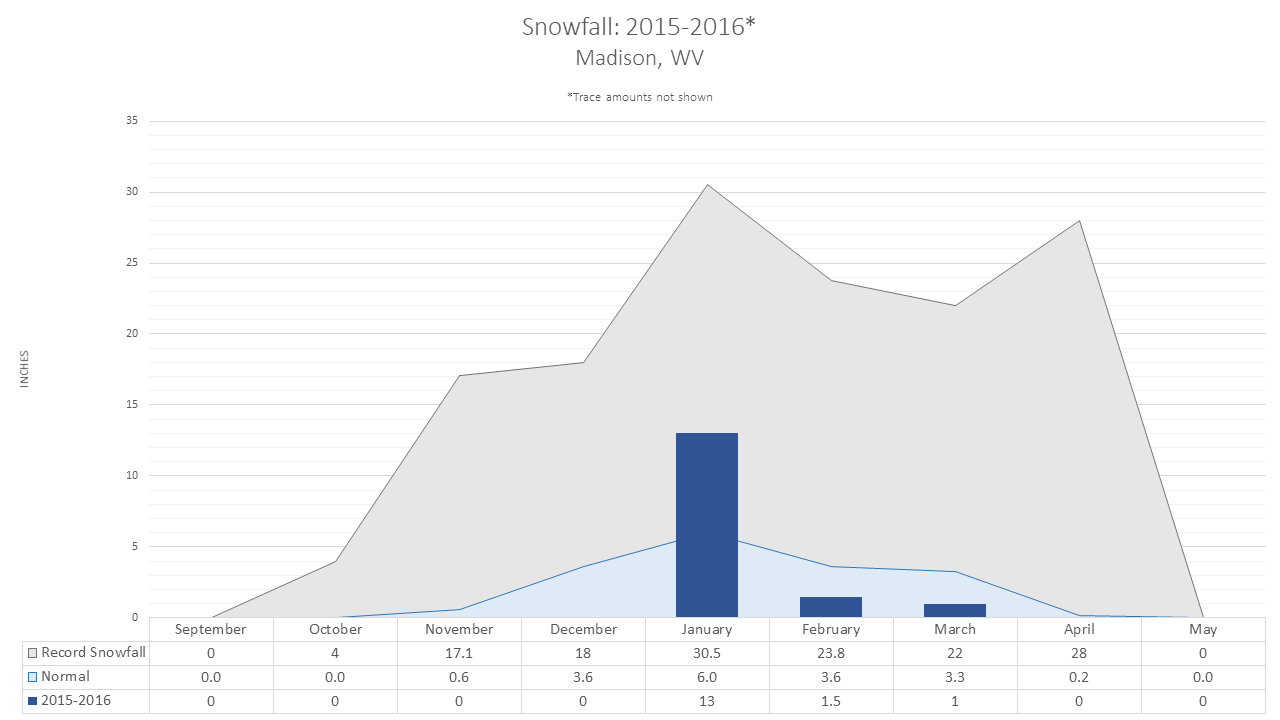
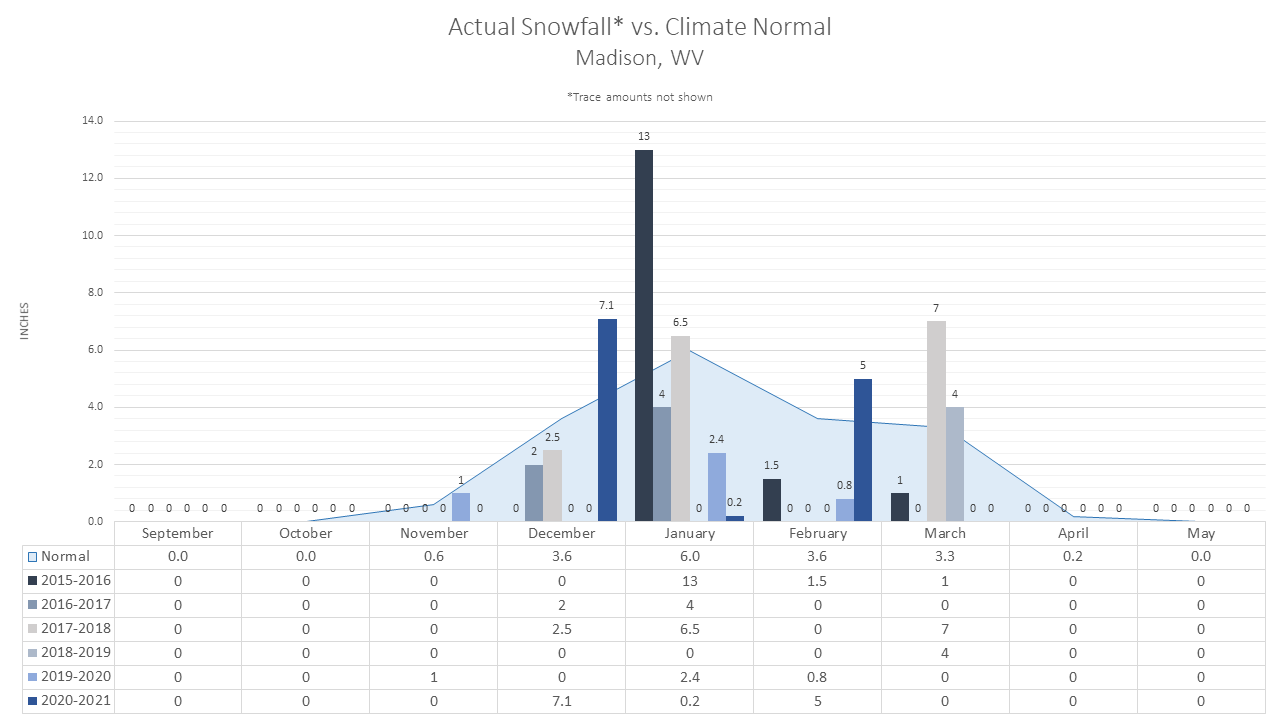
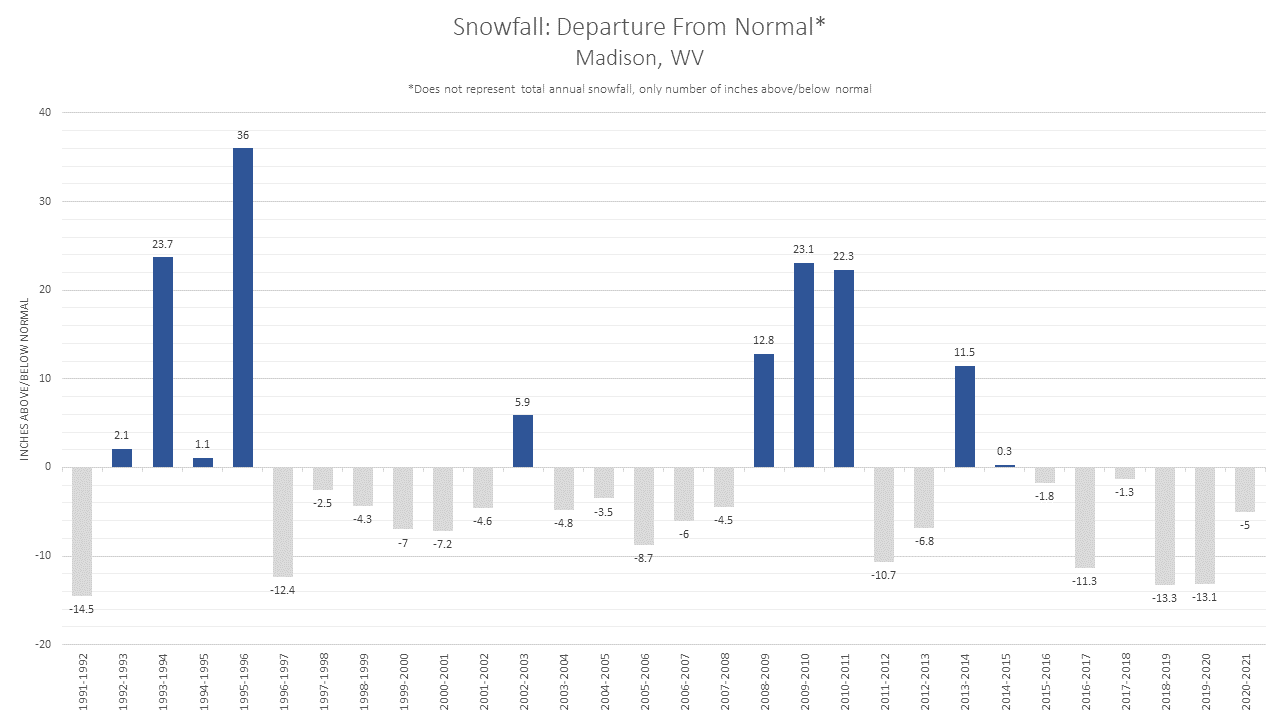
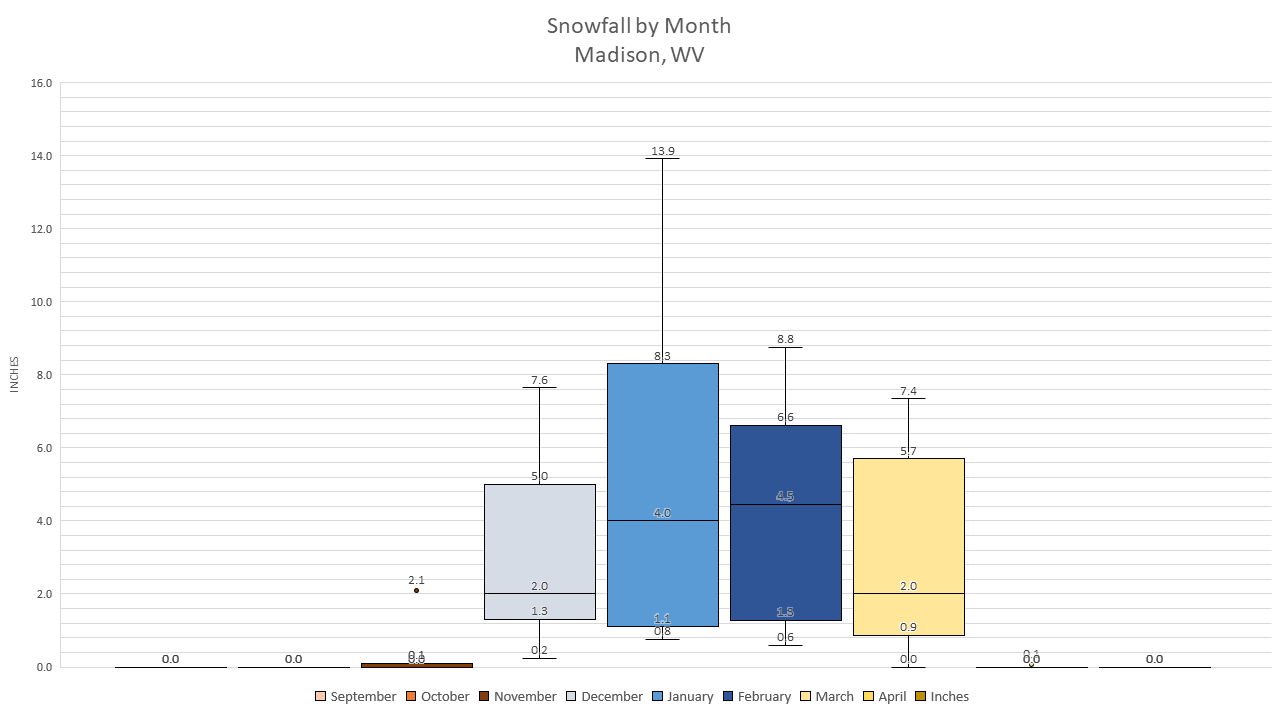
Madison, WV |
||||||
|
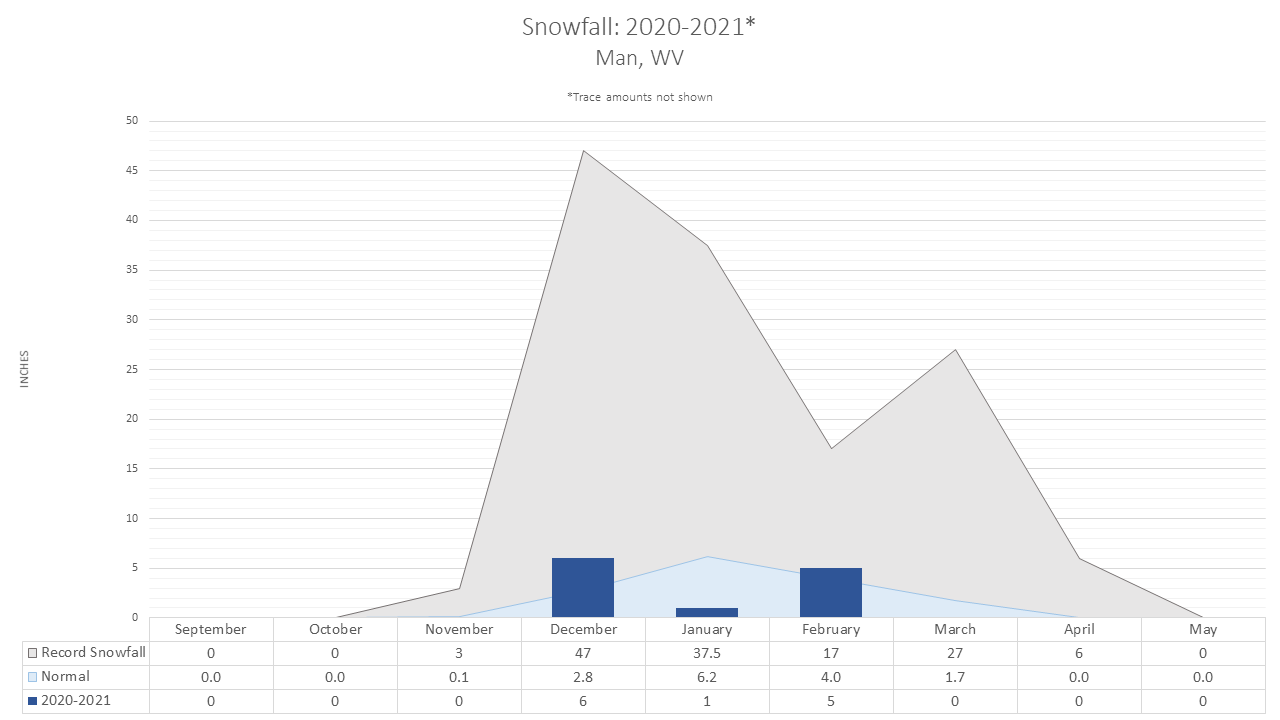
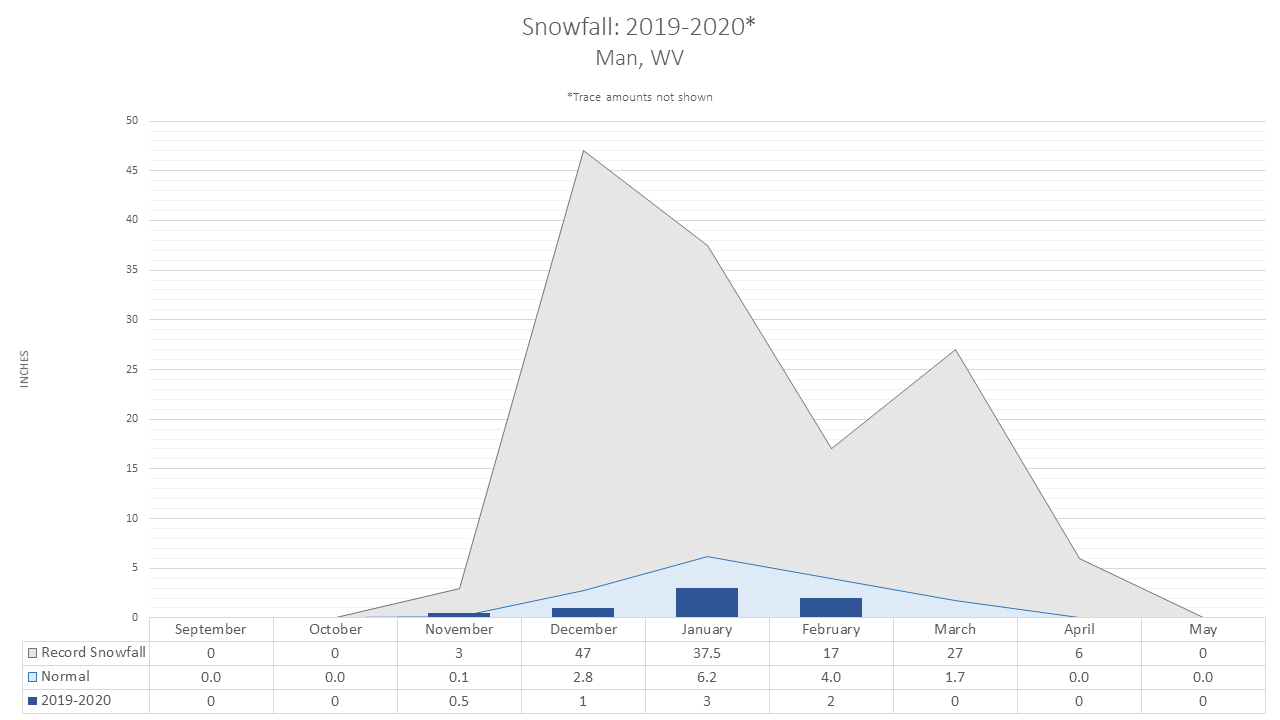
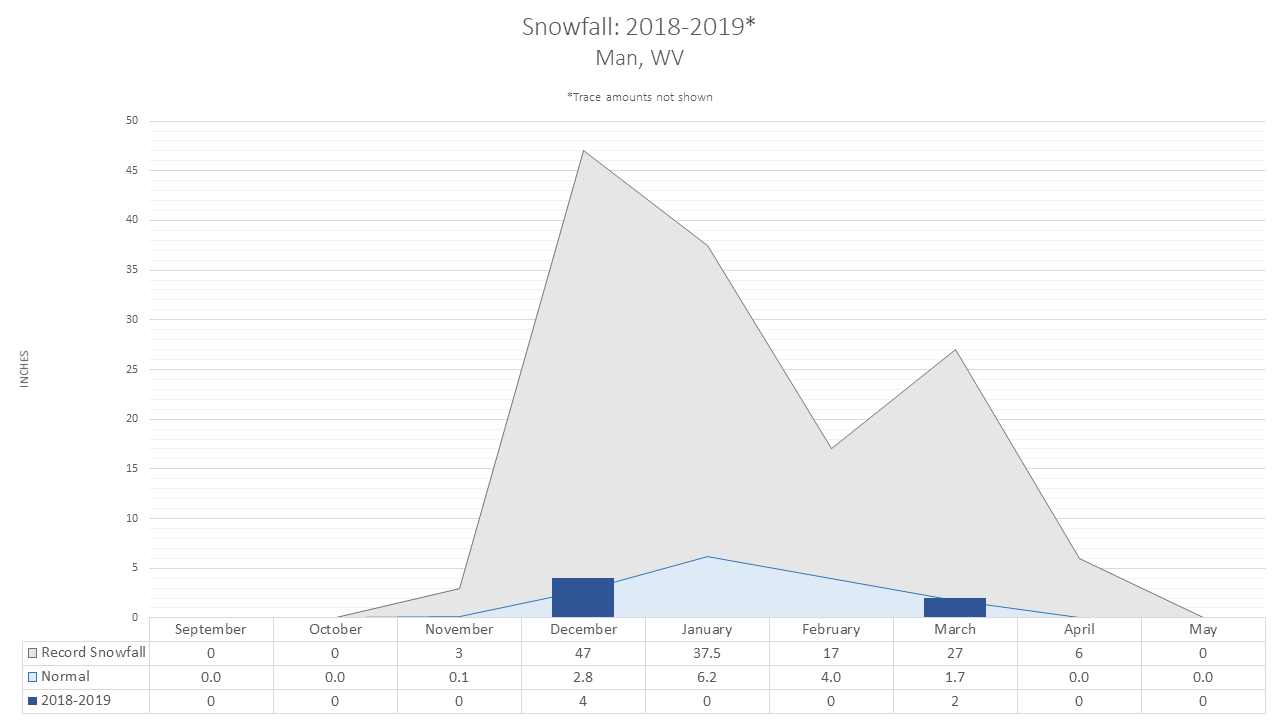
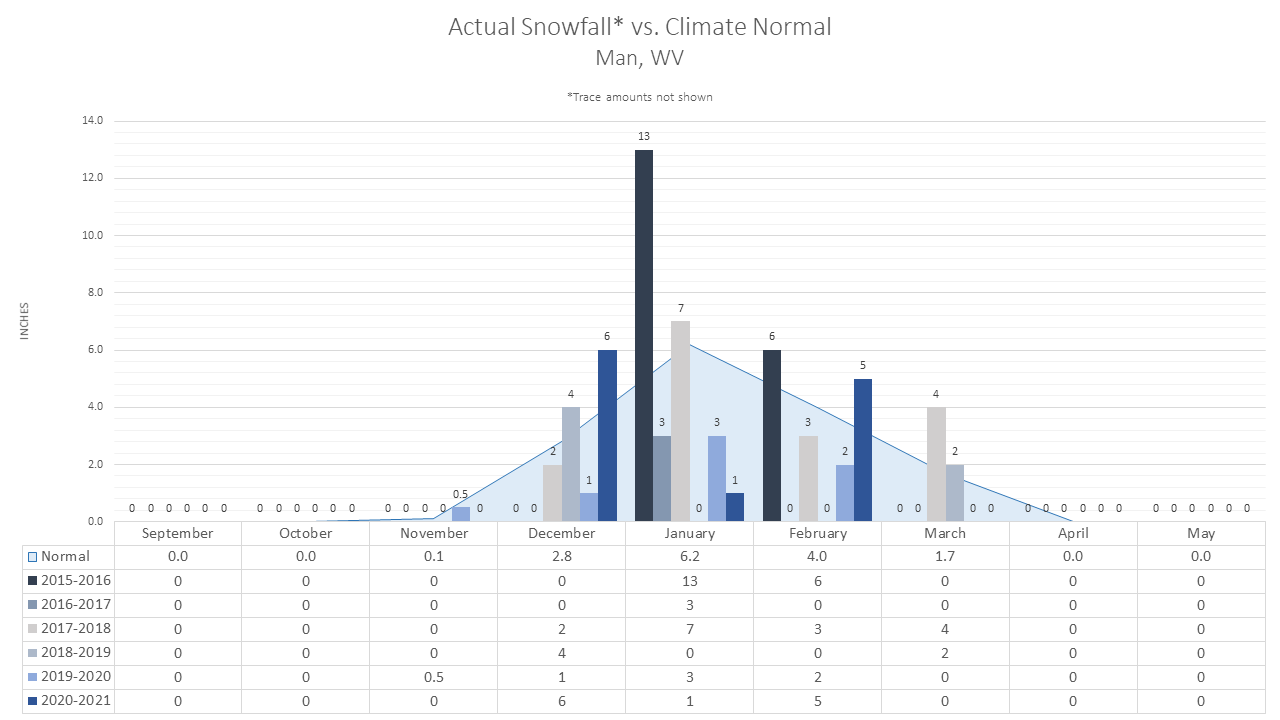
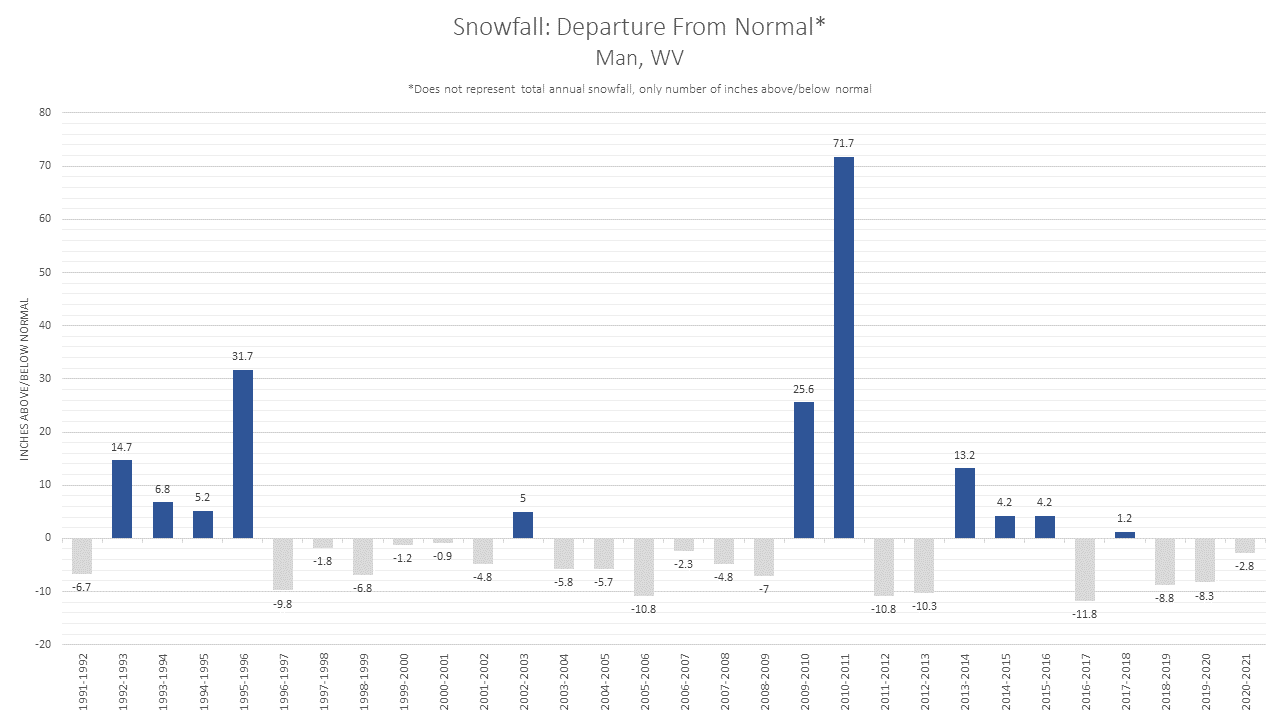
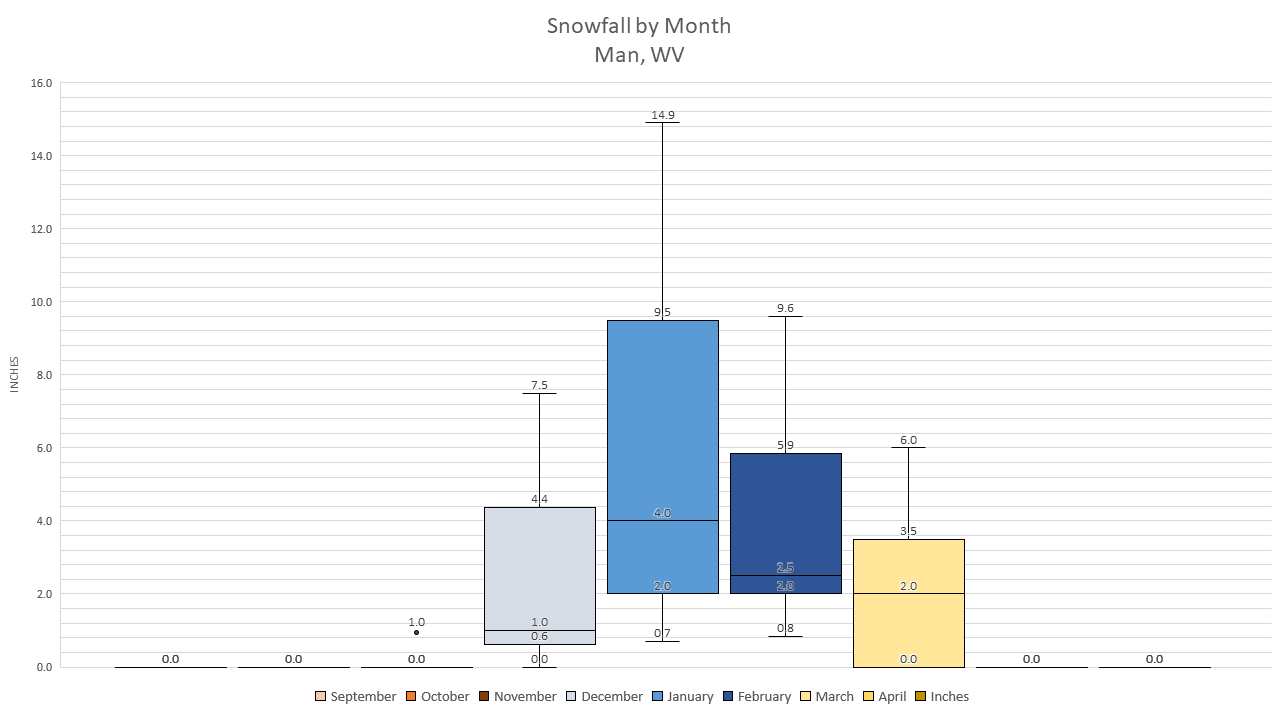
Man, WV |
||||||
|
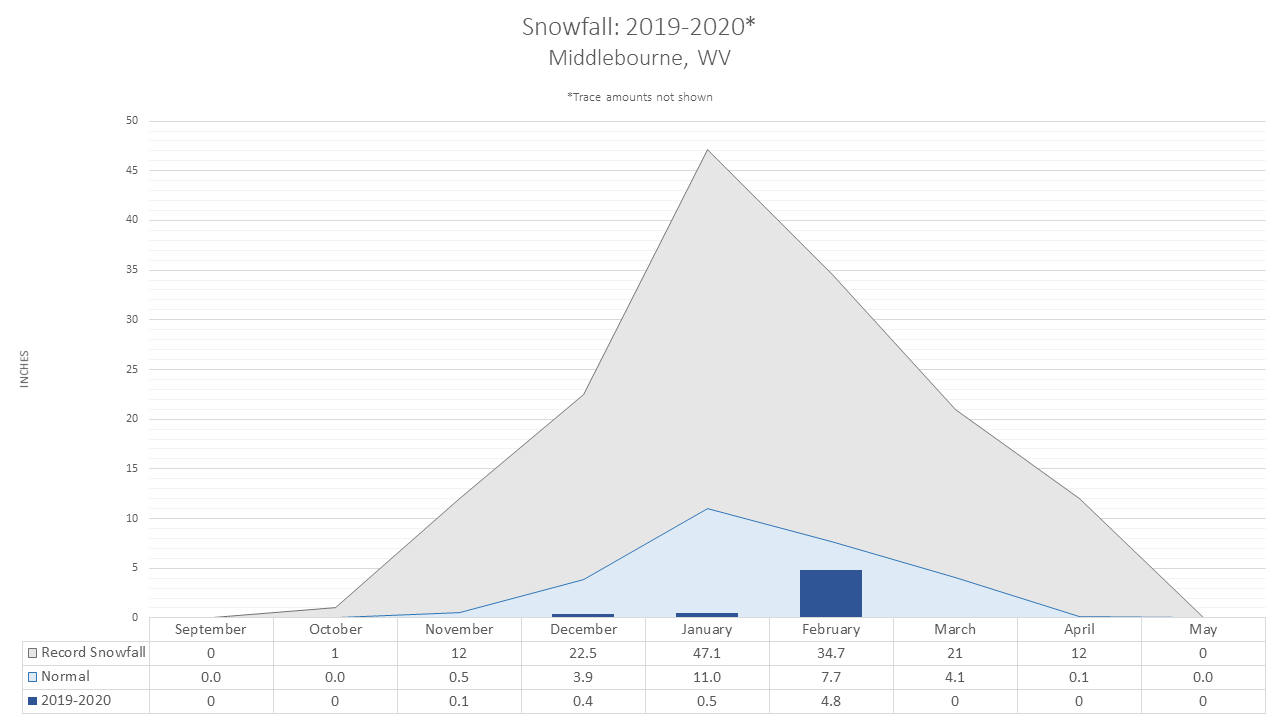
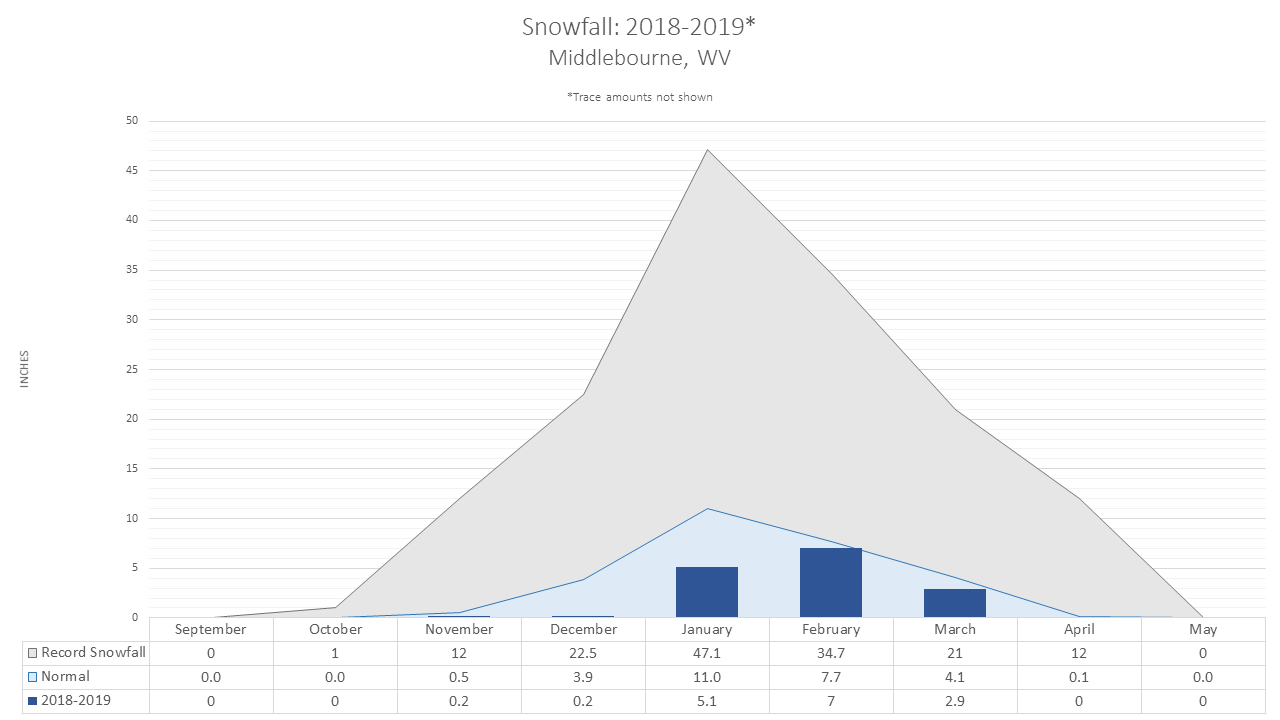
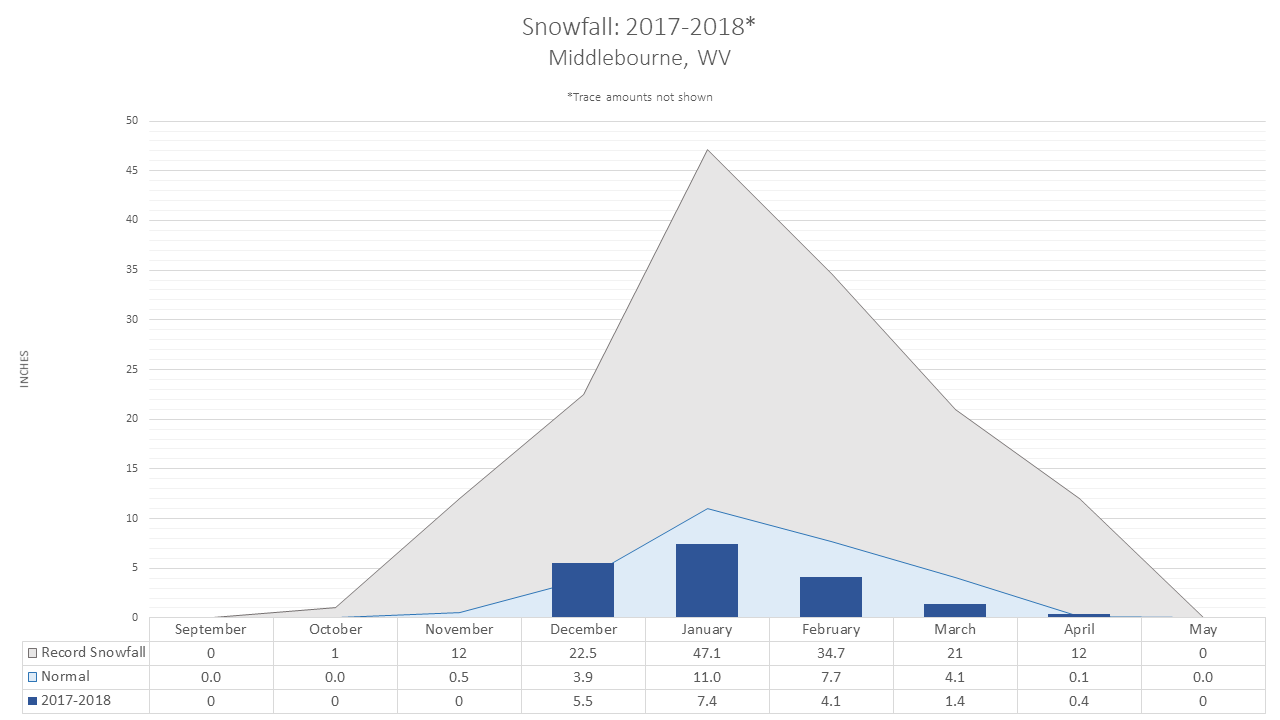
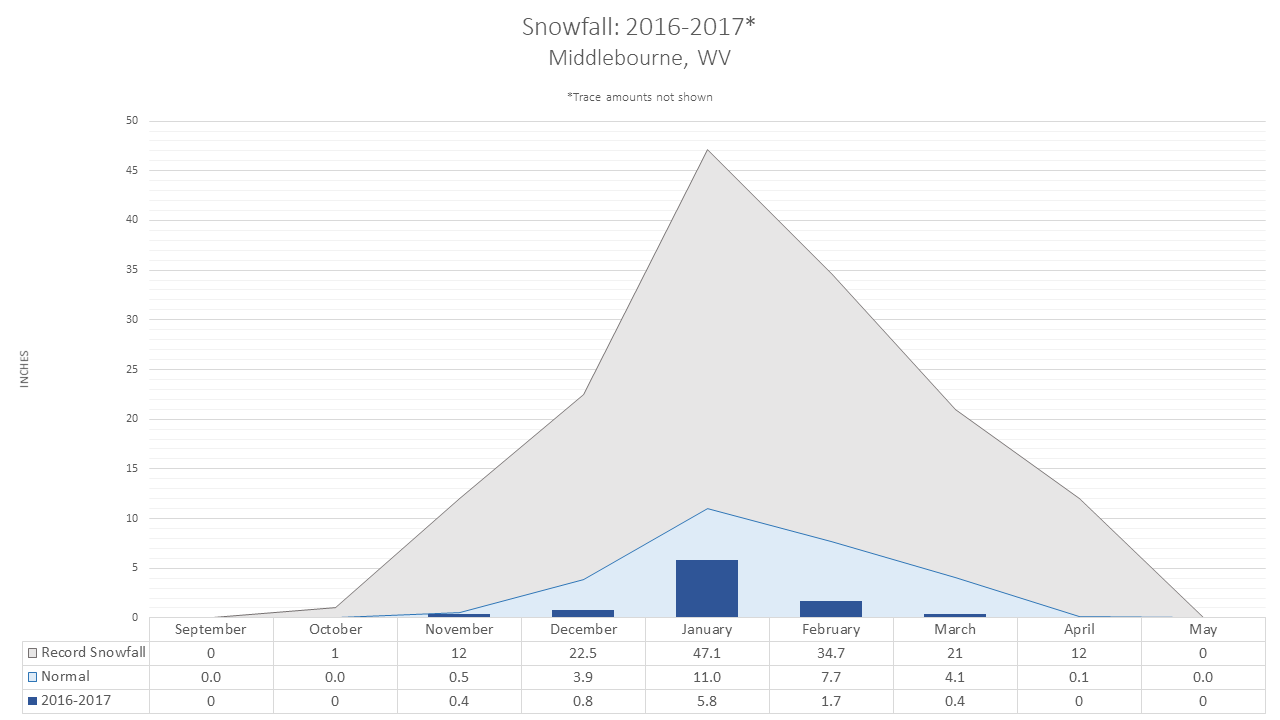
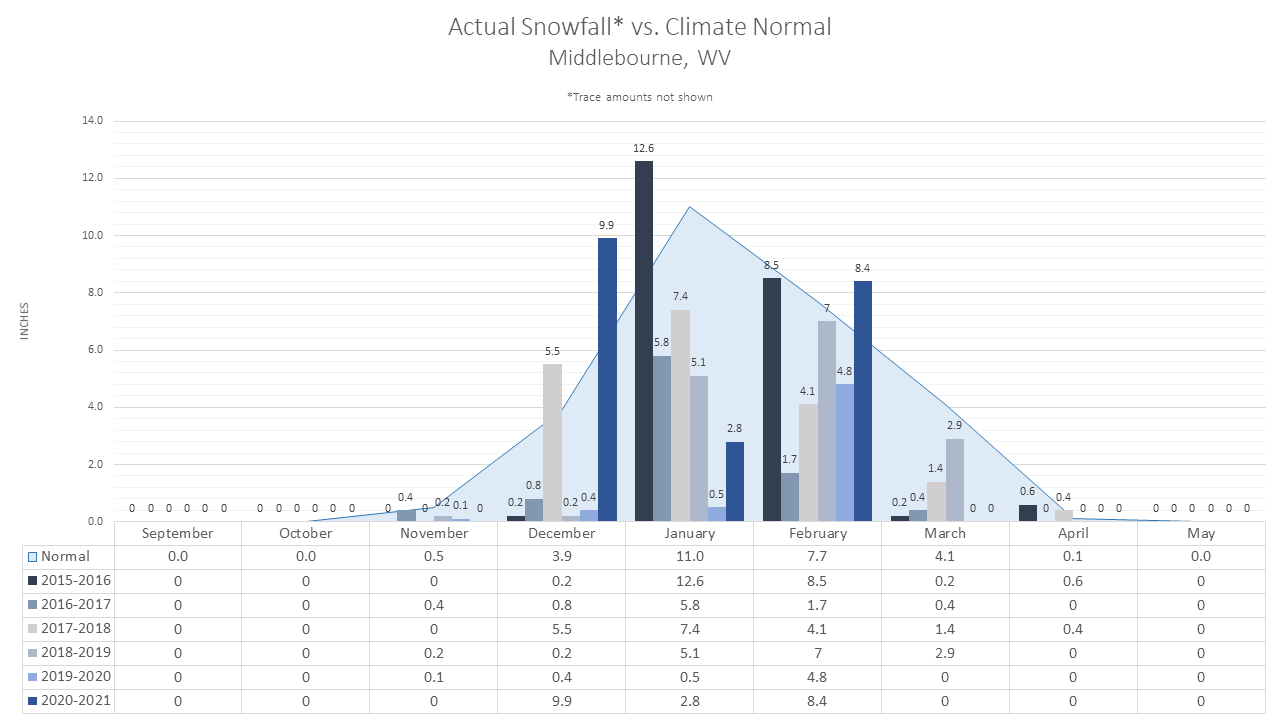
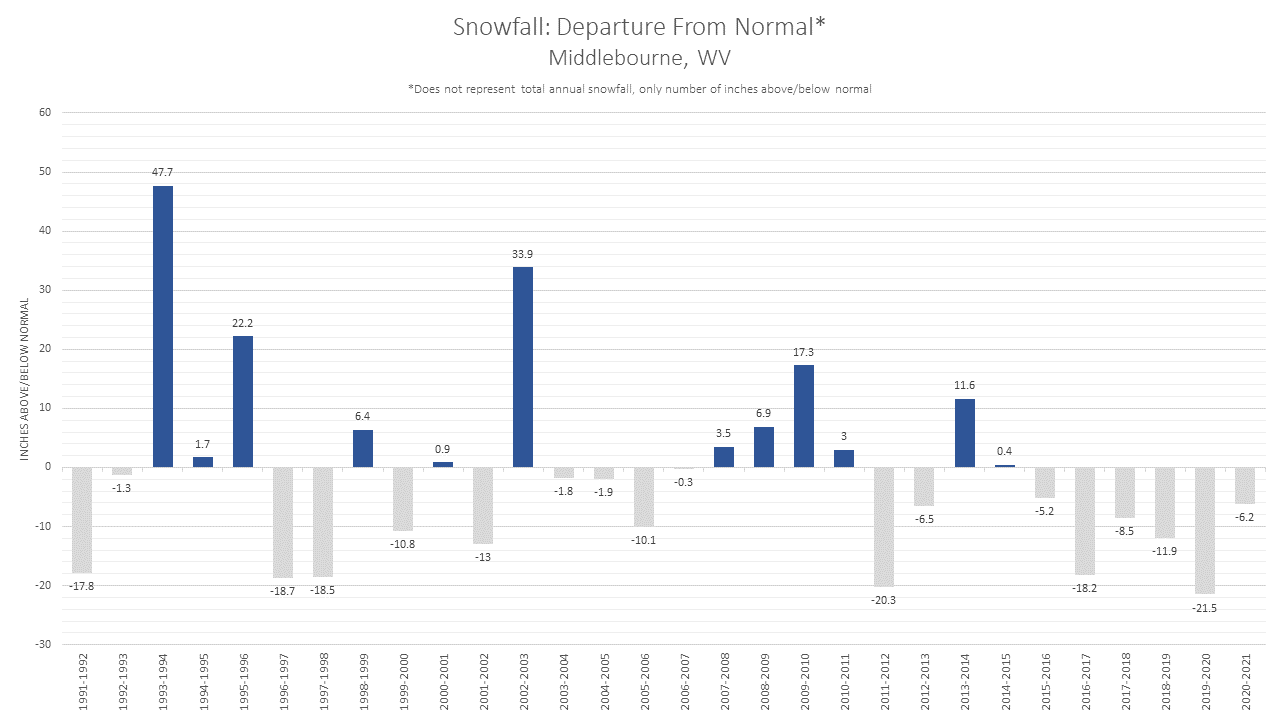
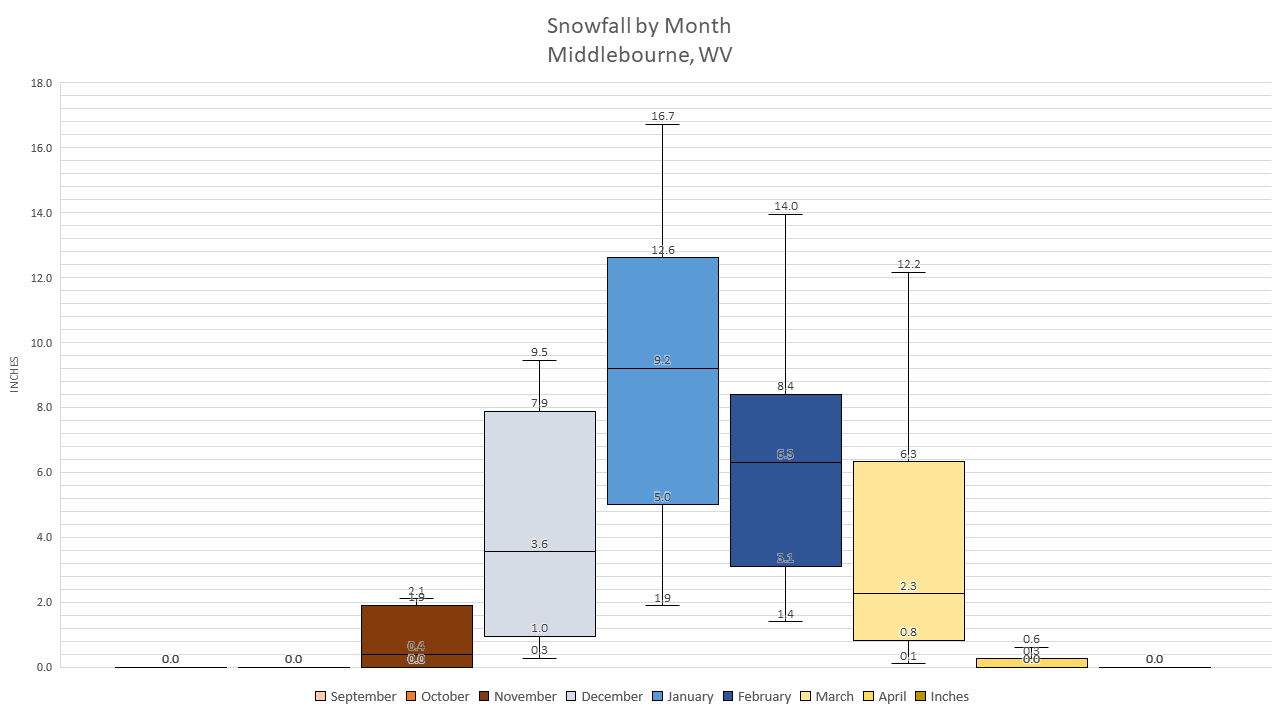
Middlebourne, WV |
||||||
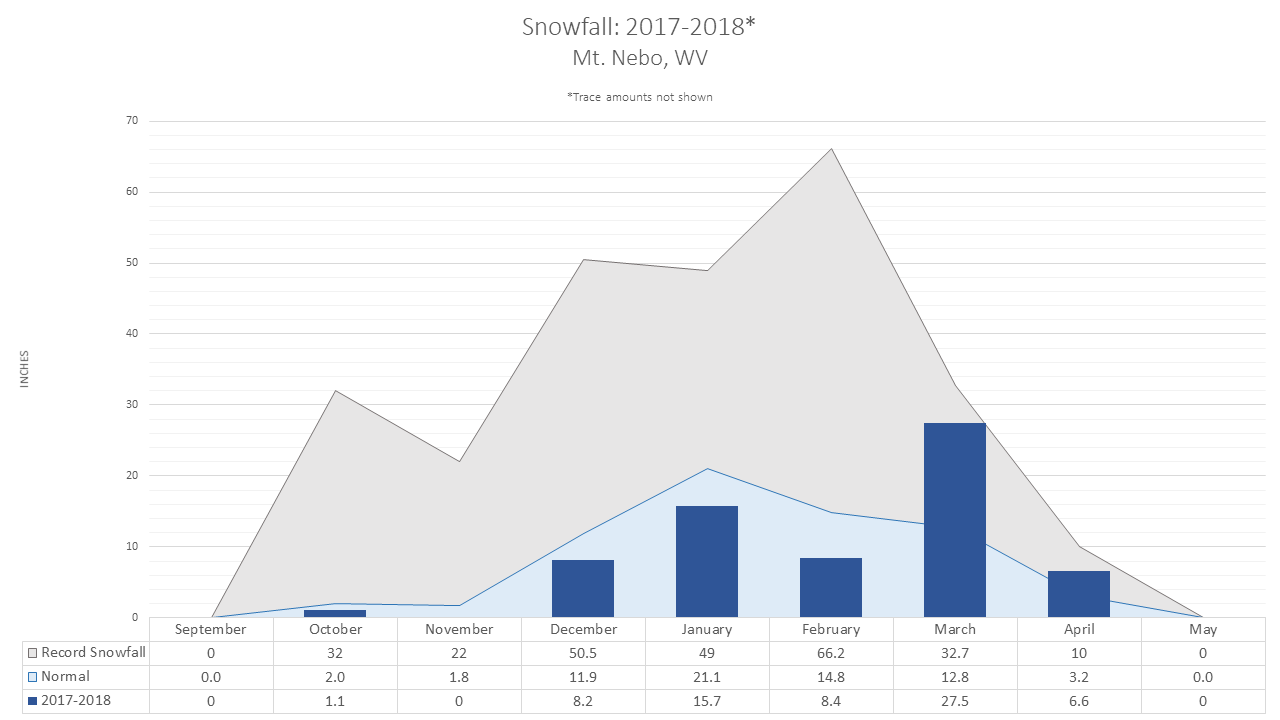
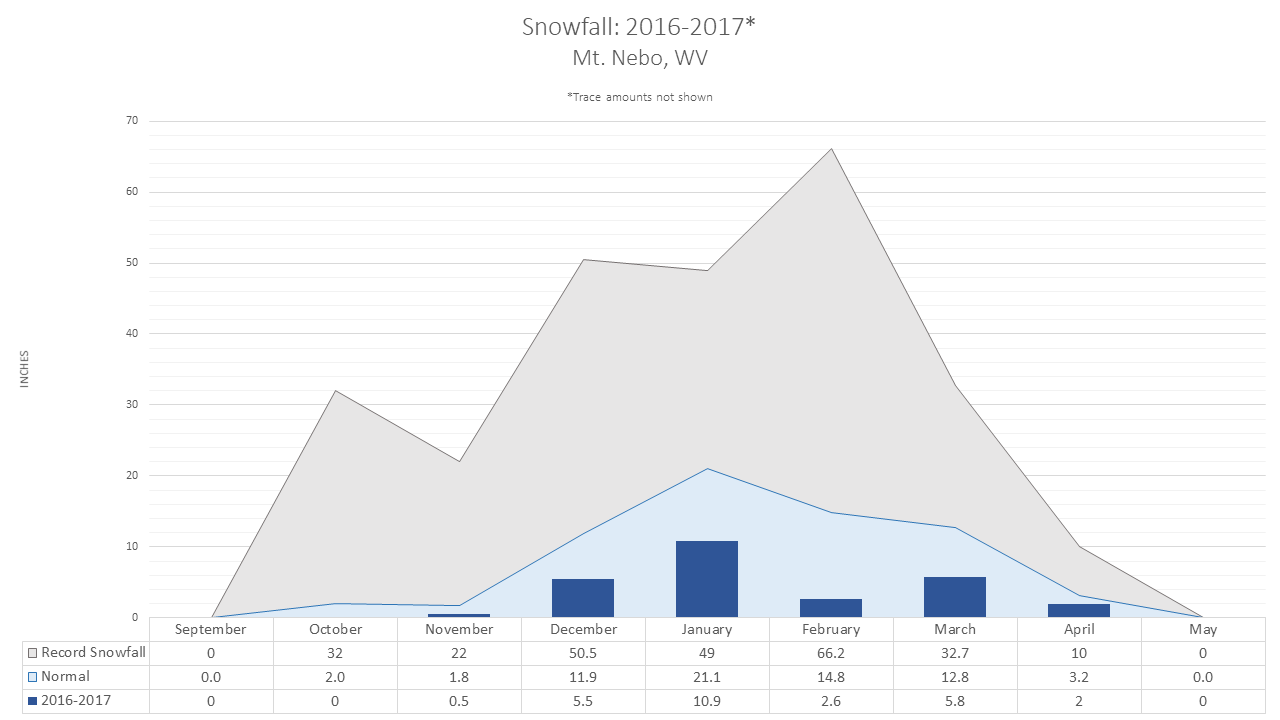
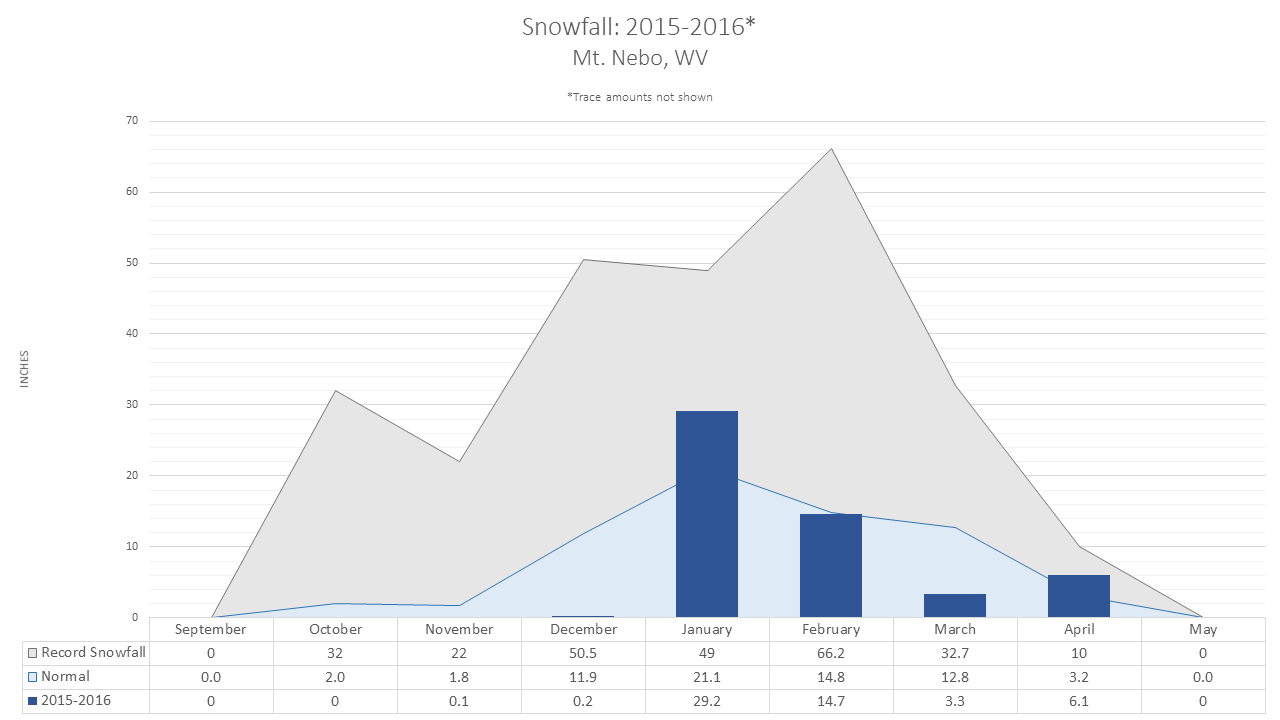
|
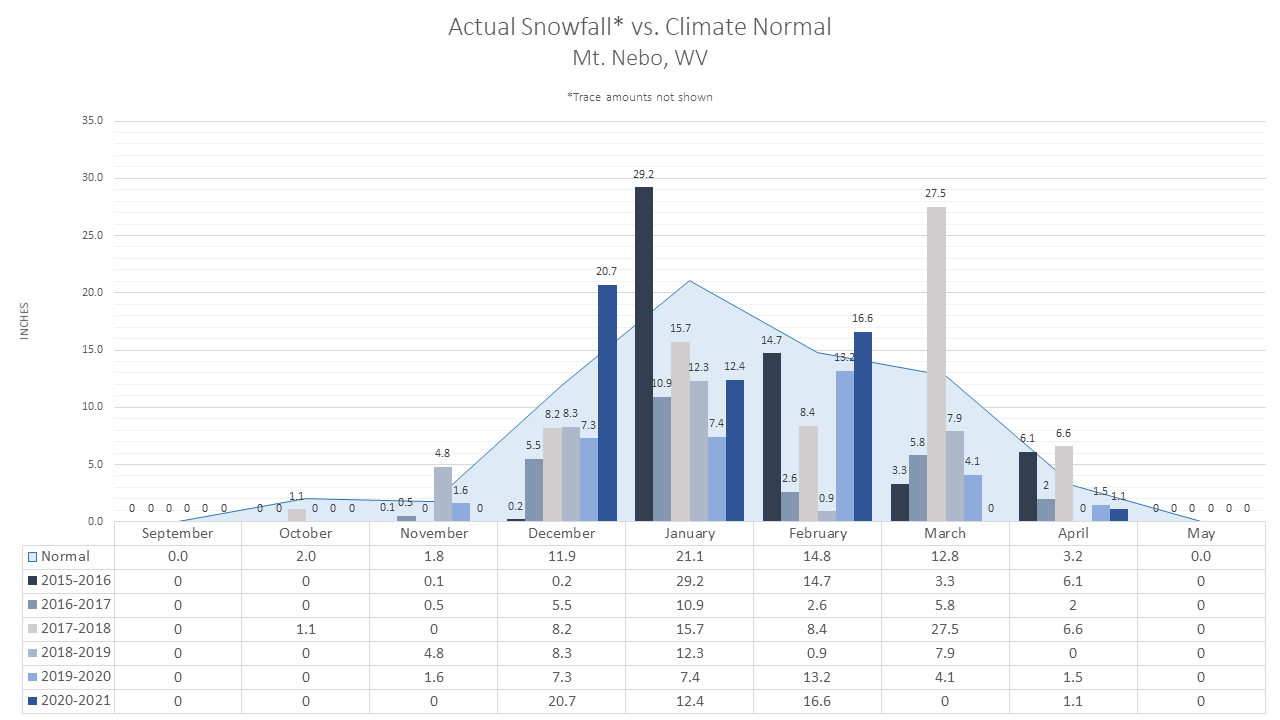
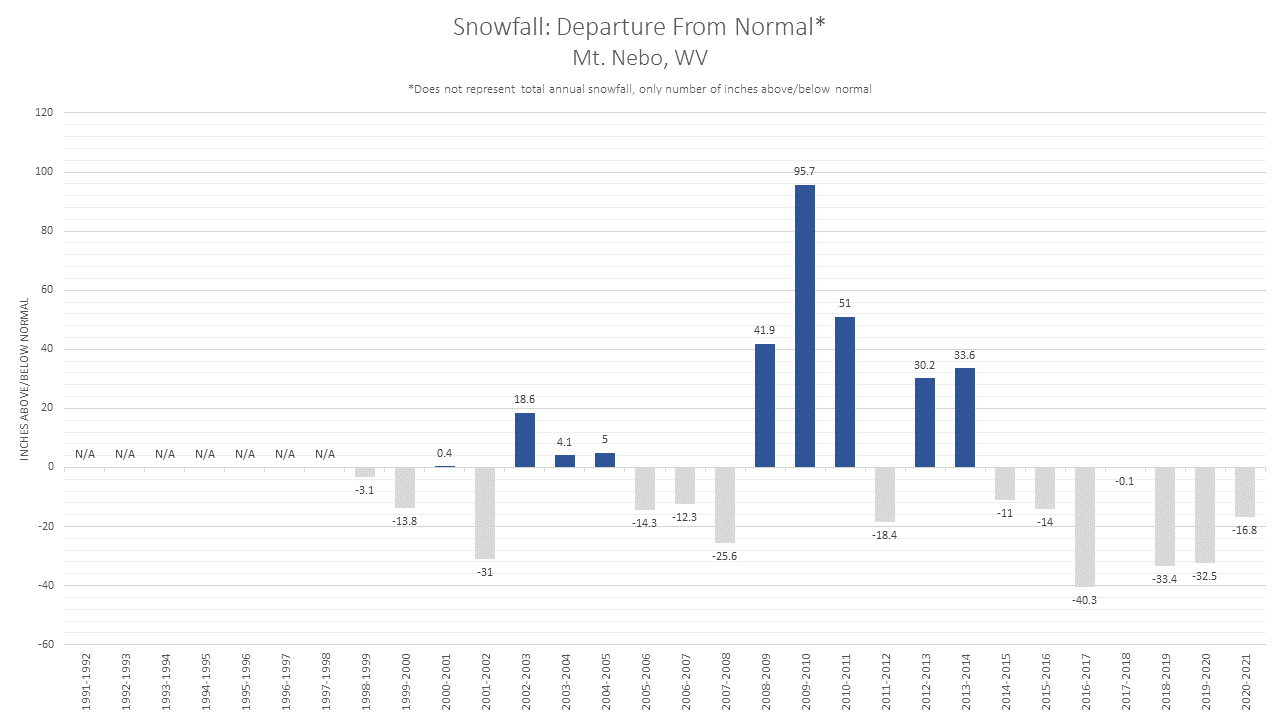
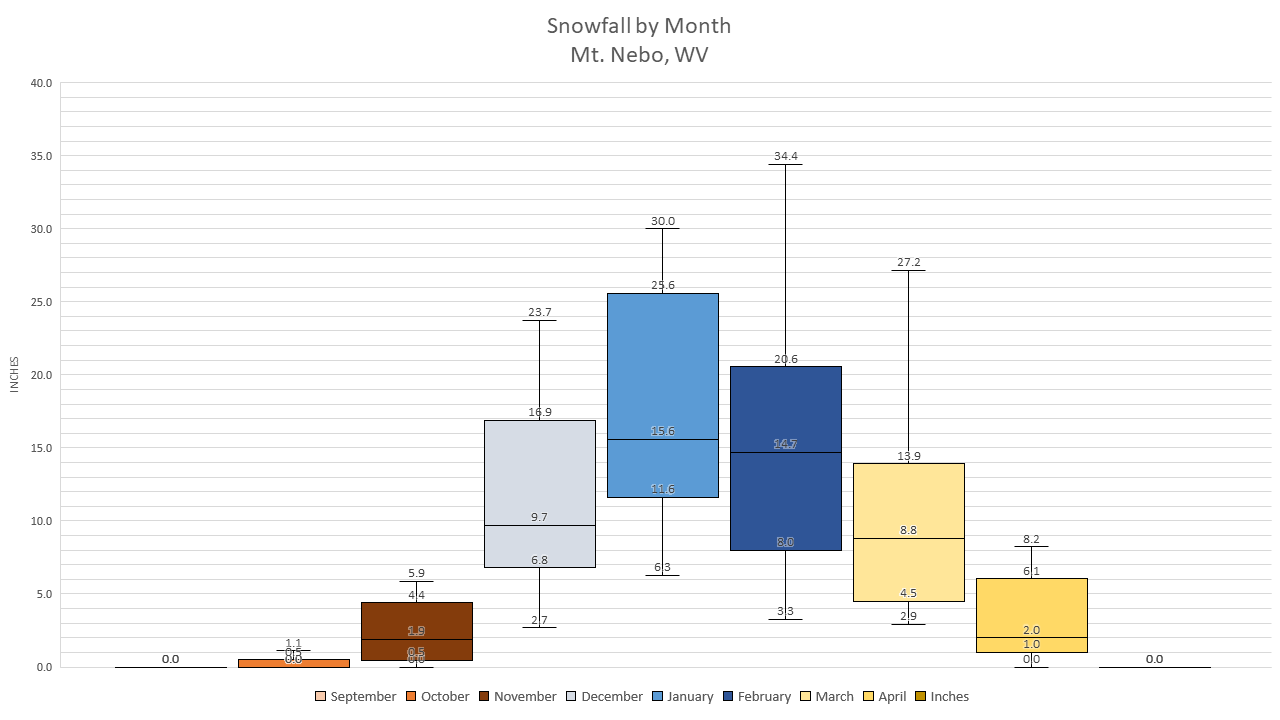
Mt Nebo, WV |
||||||
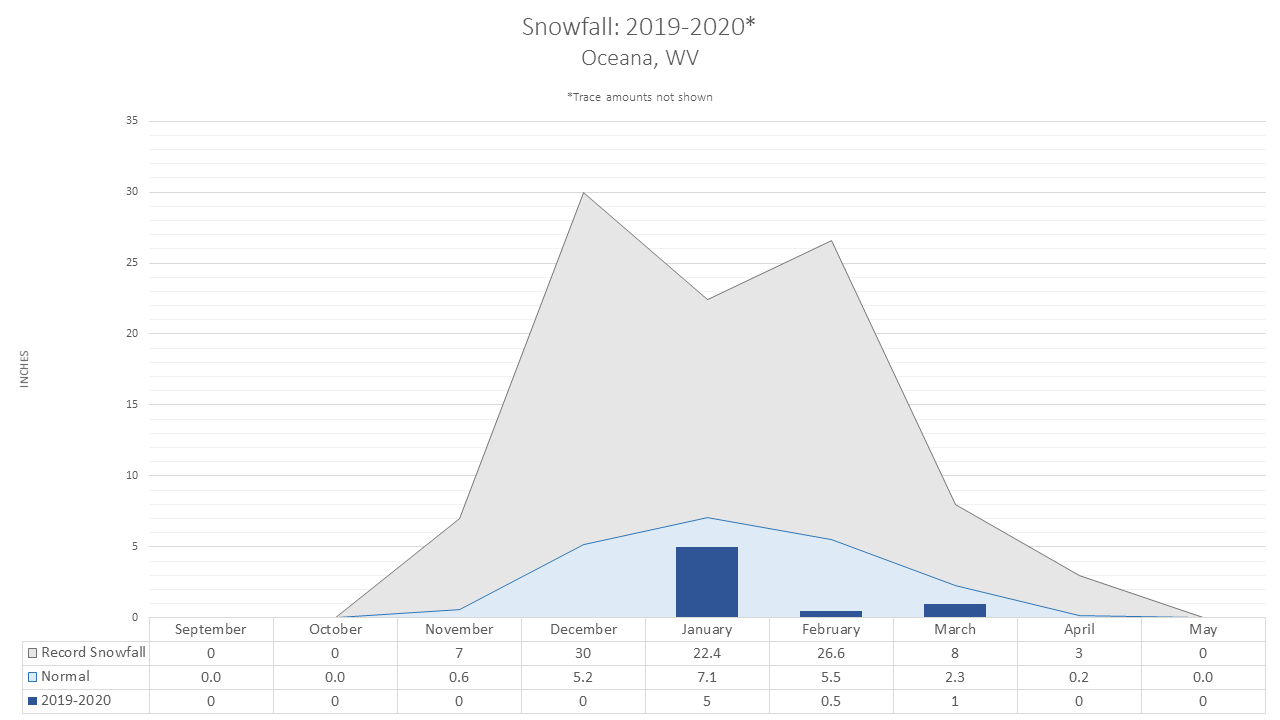
|
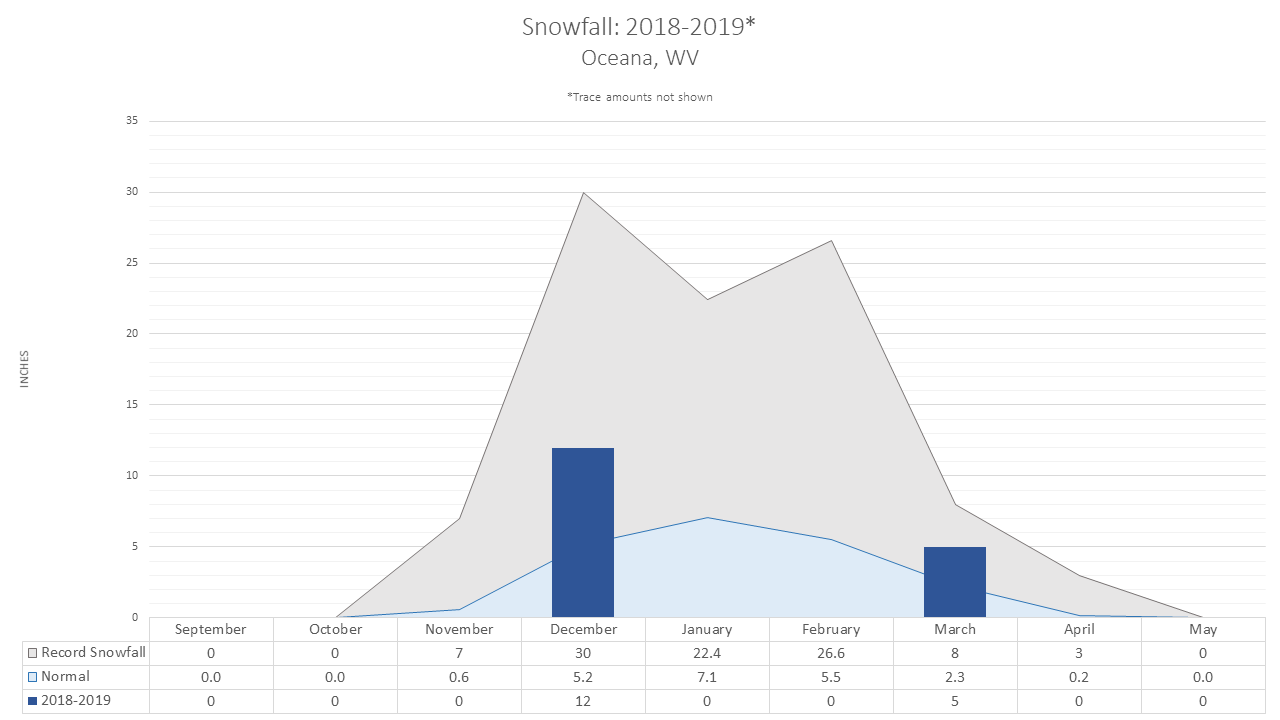
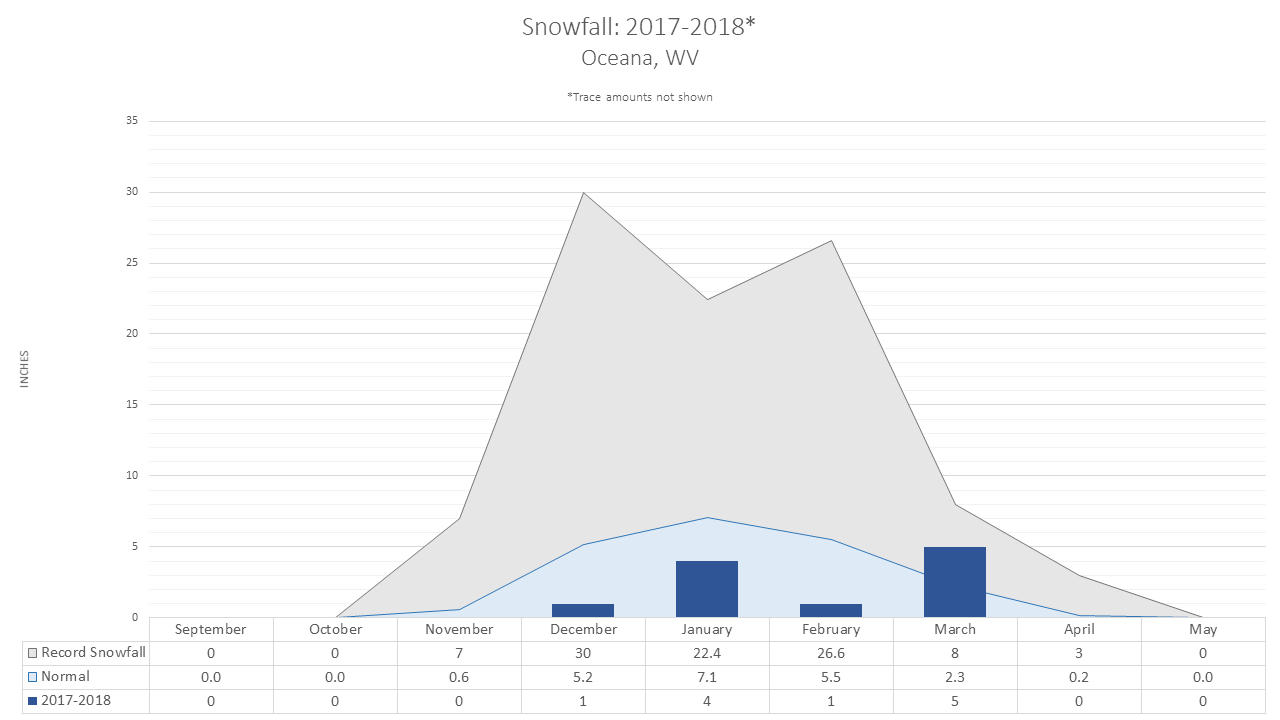
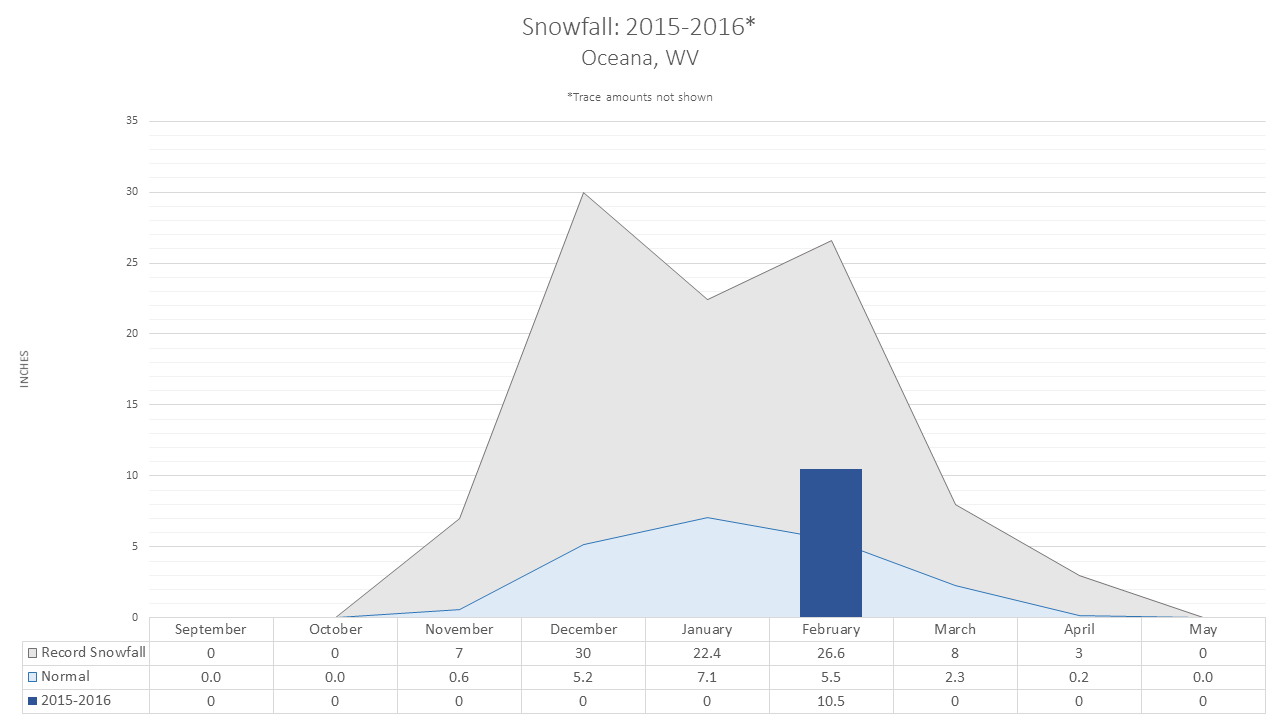
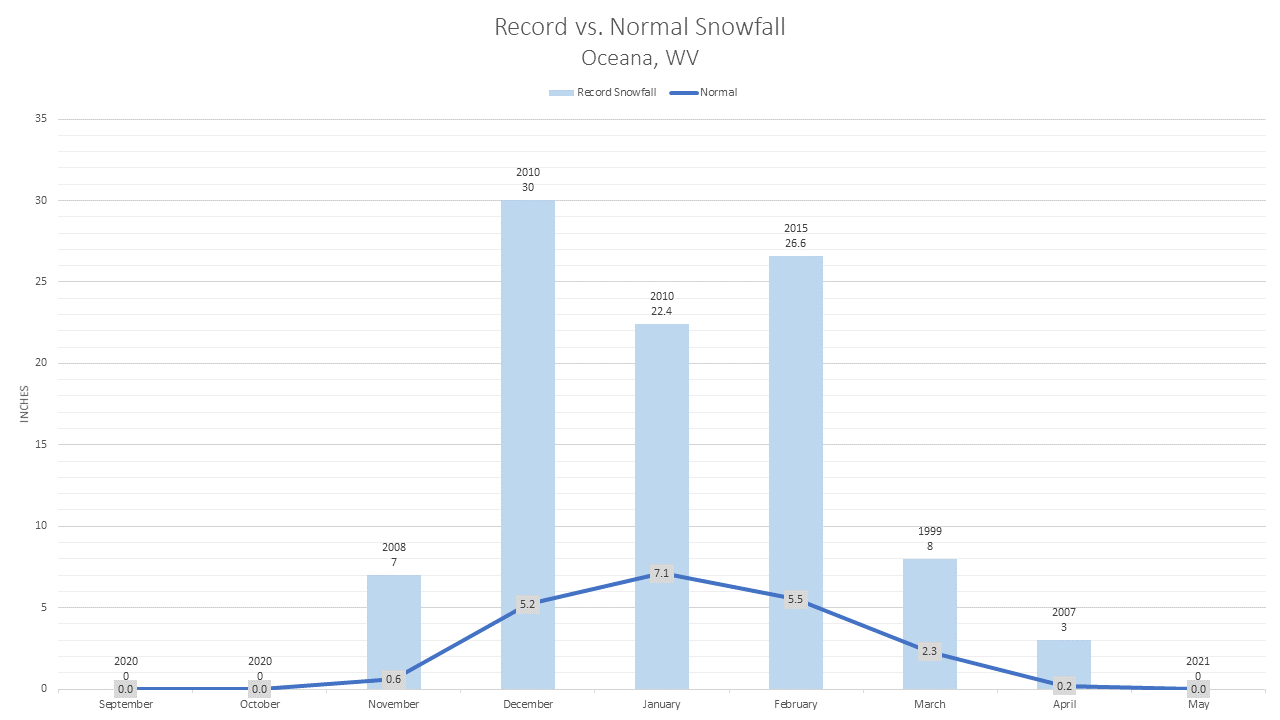
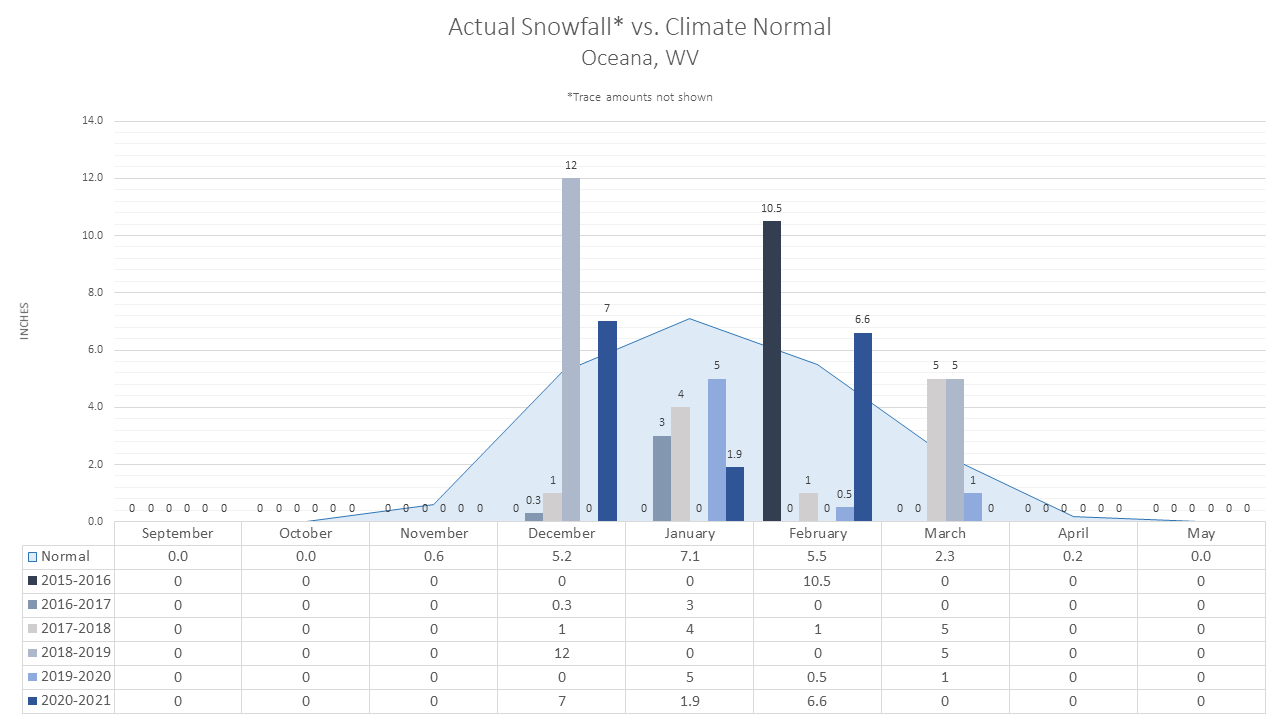
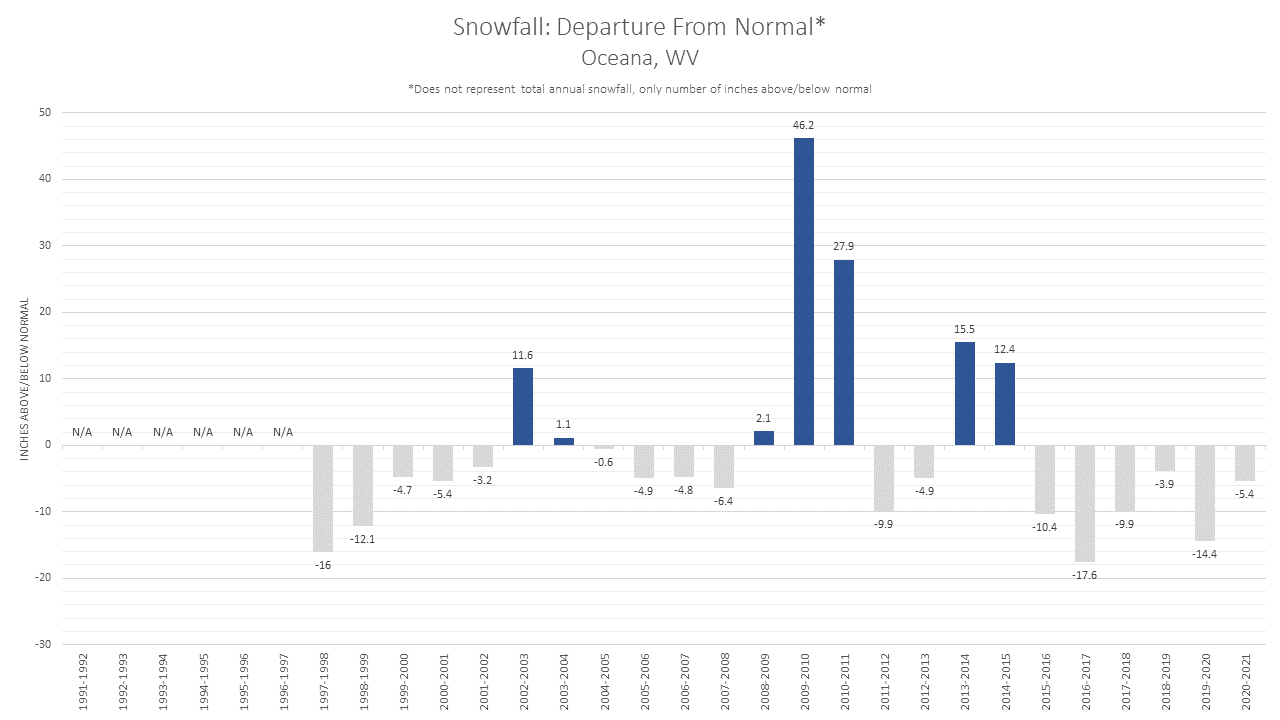
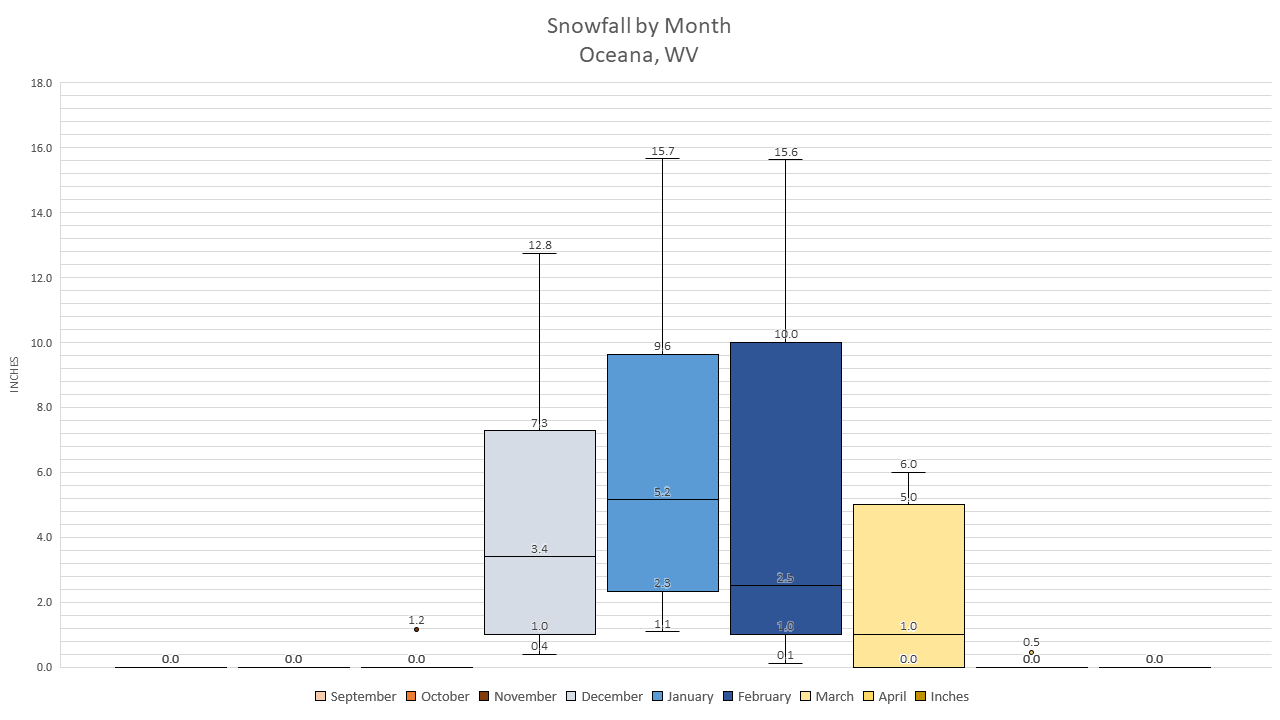
Oceana, WV |
||||||
|
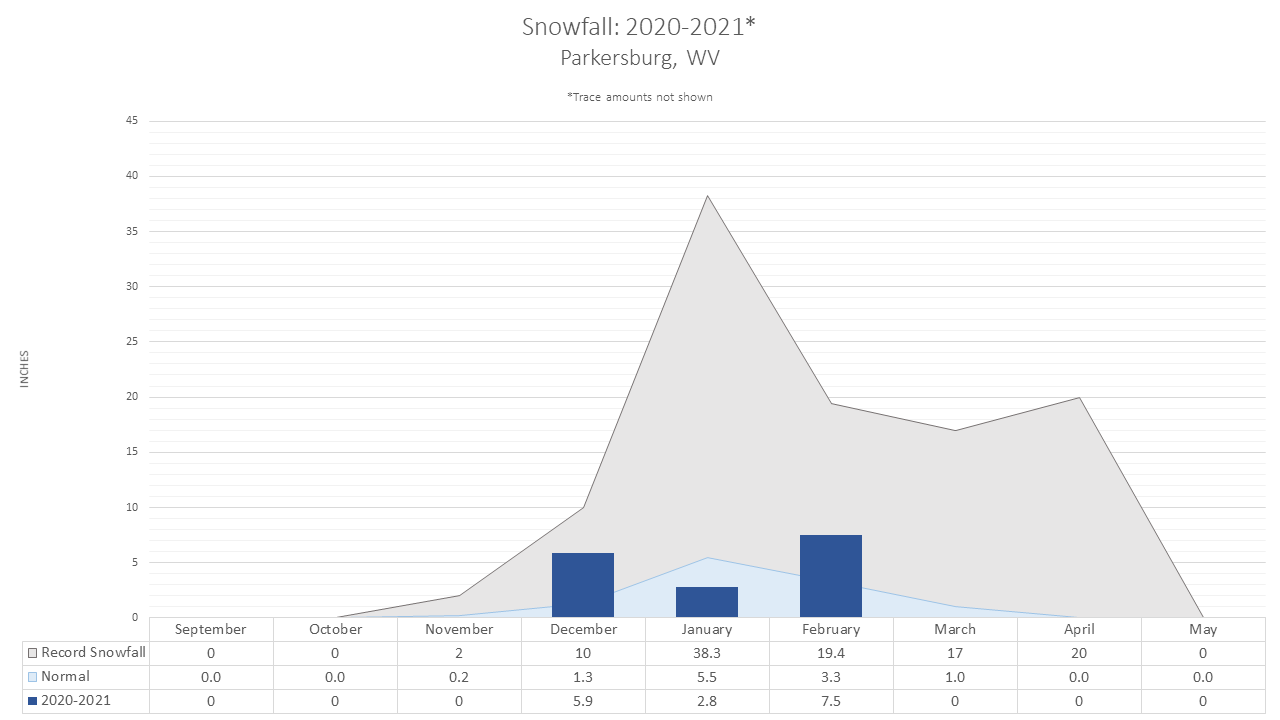
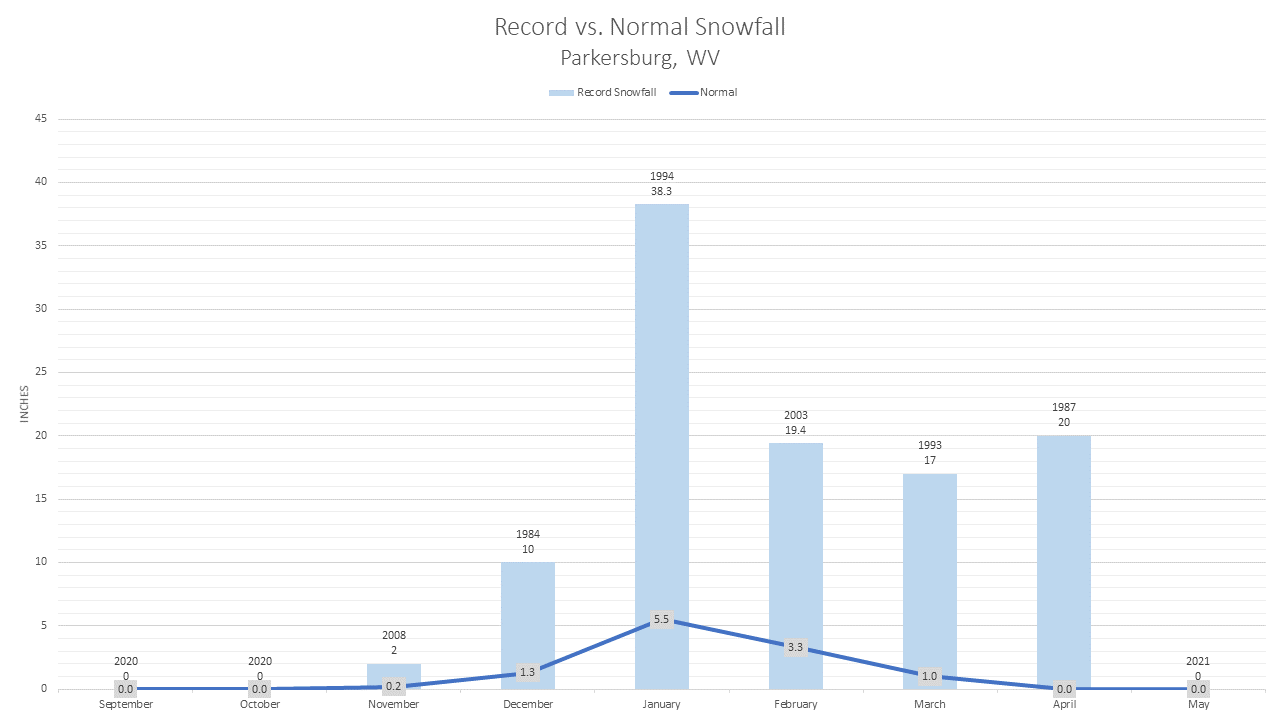
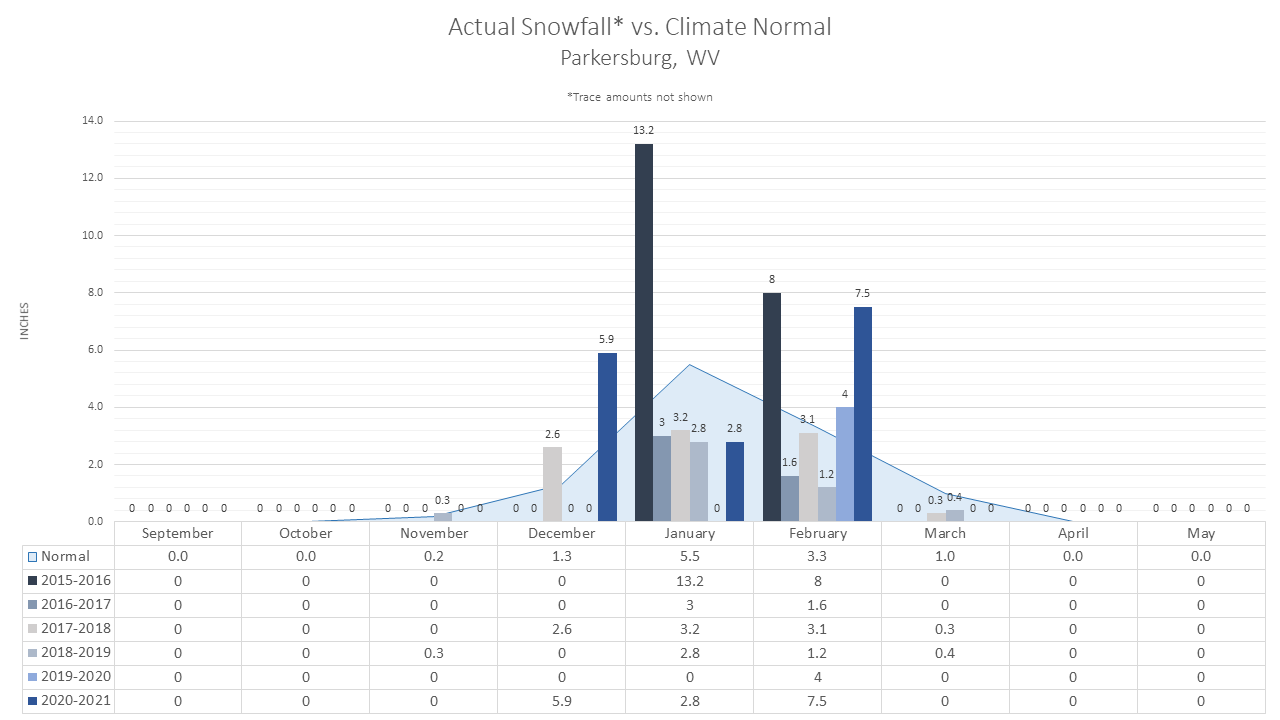
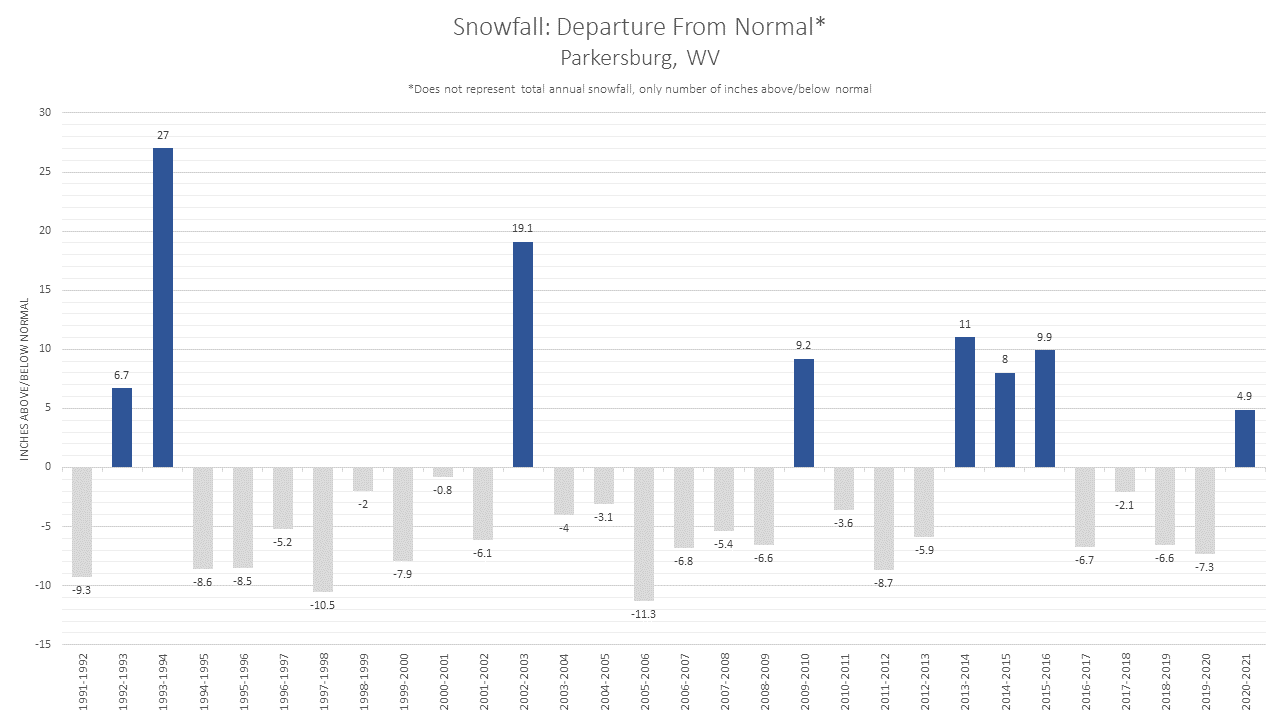
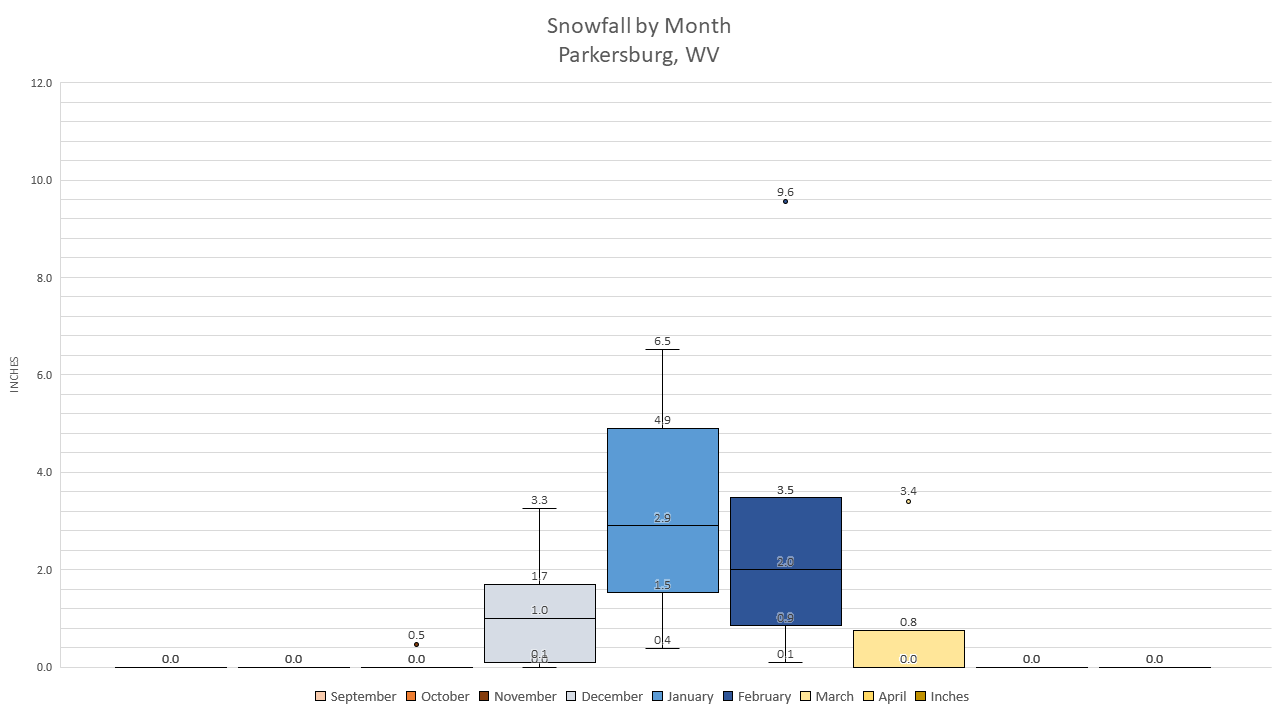
Parkersburg, WV |
||||||
|
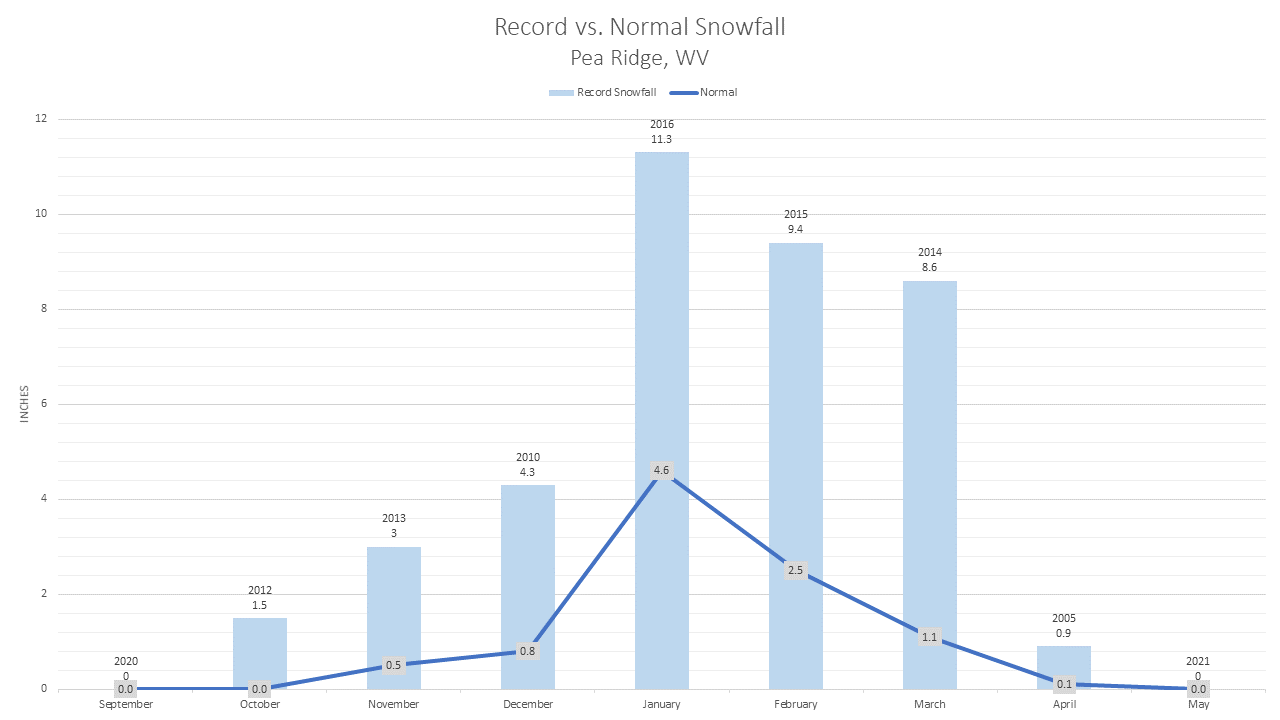
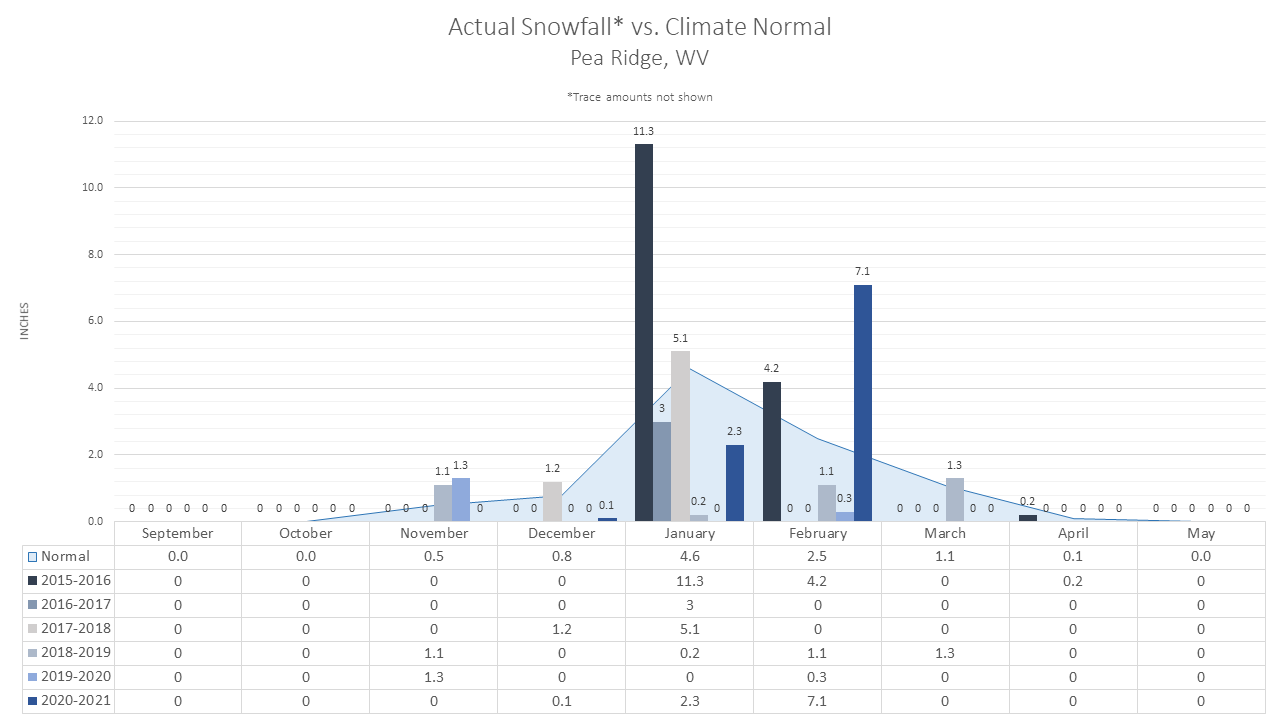
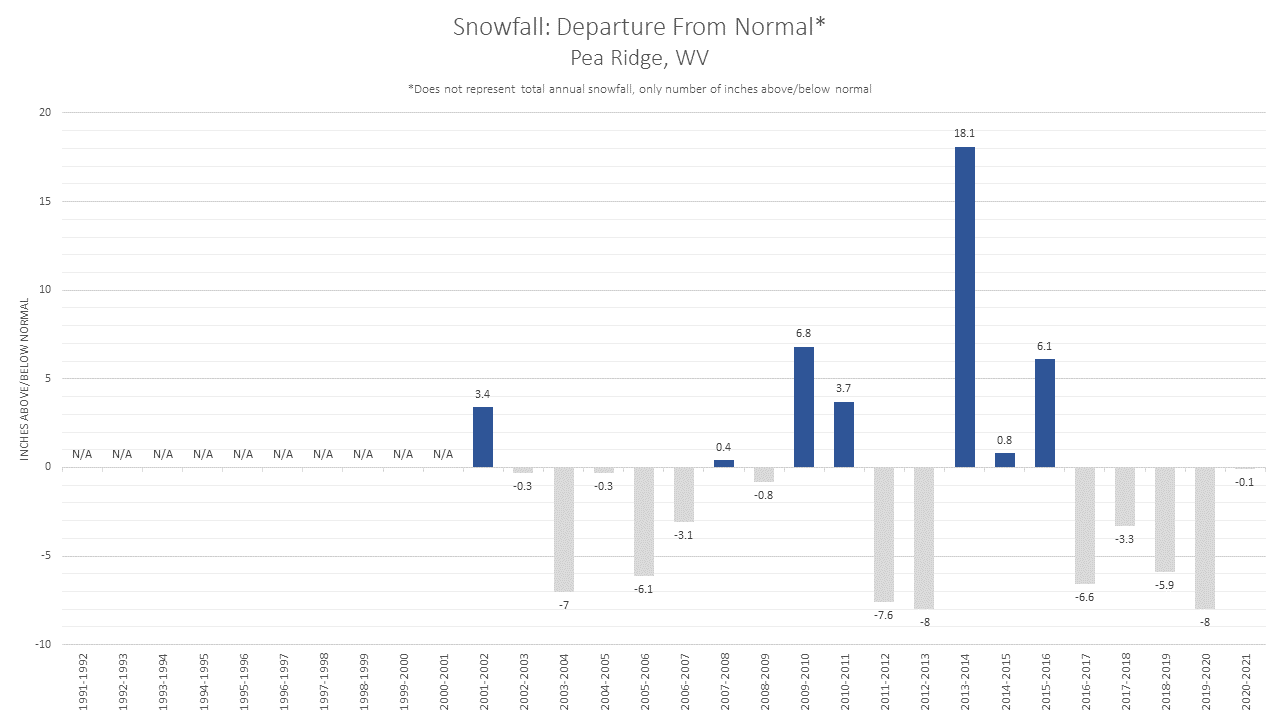
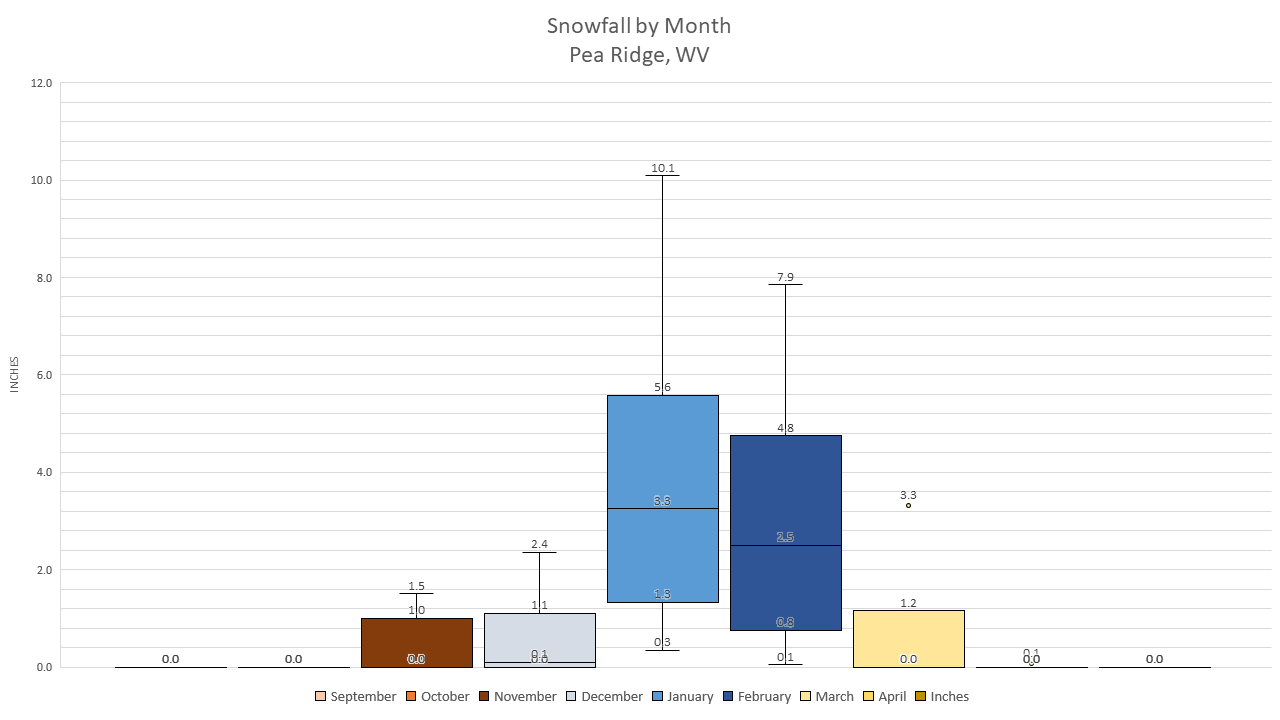
Pea Ridge, WV |
||||||
|
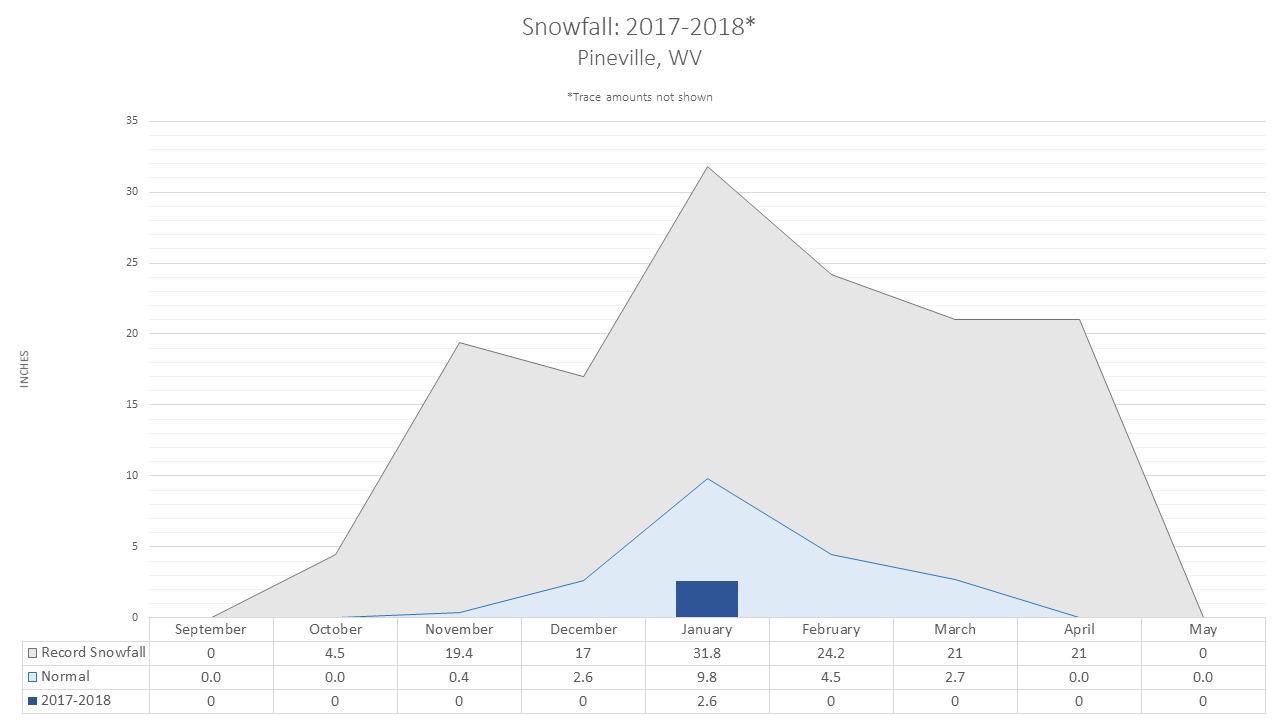
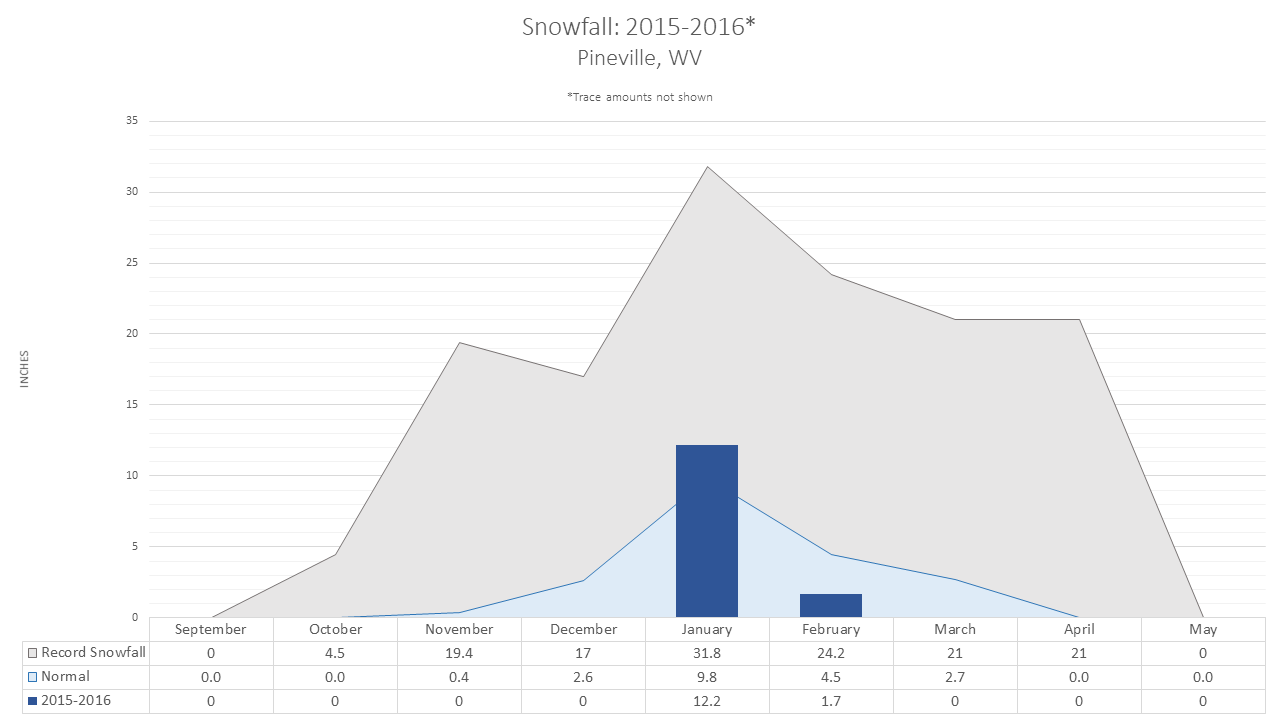
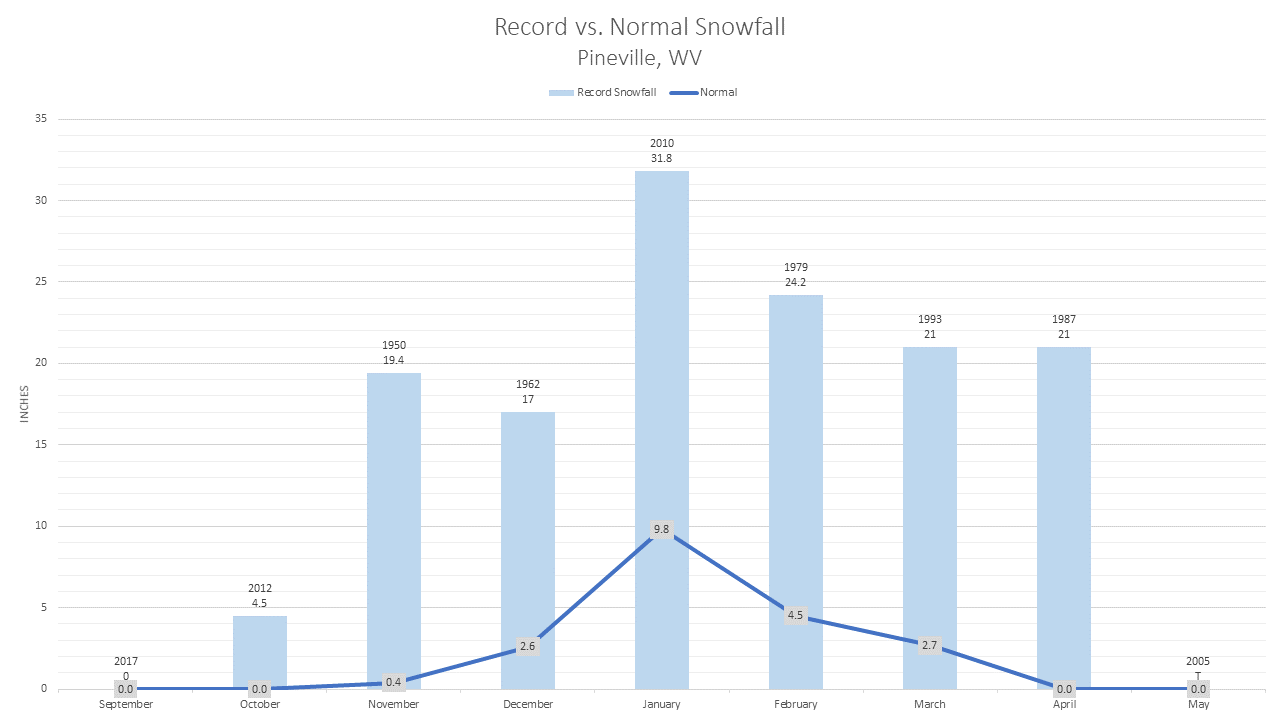
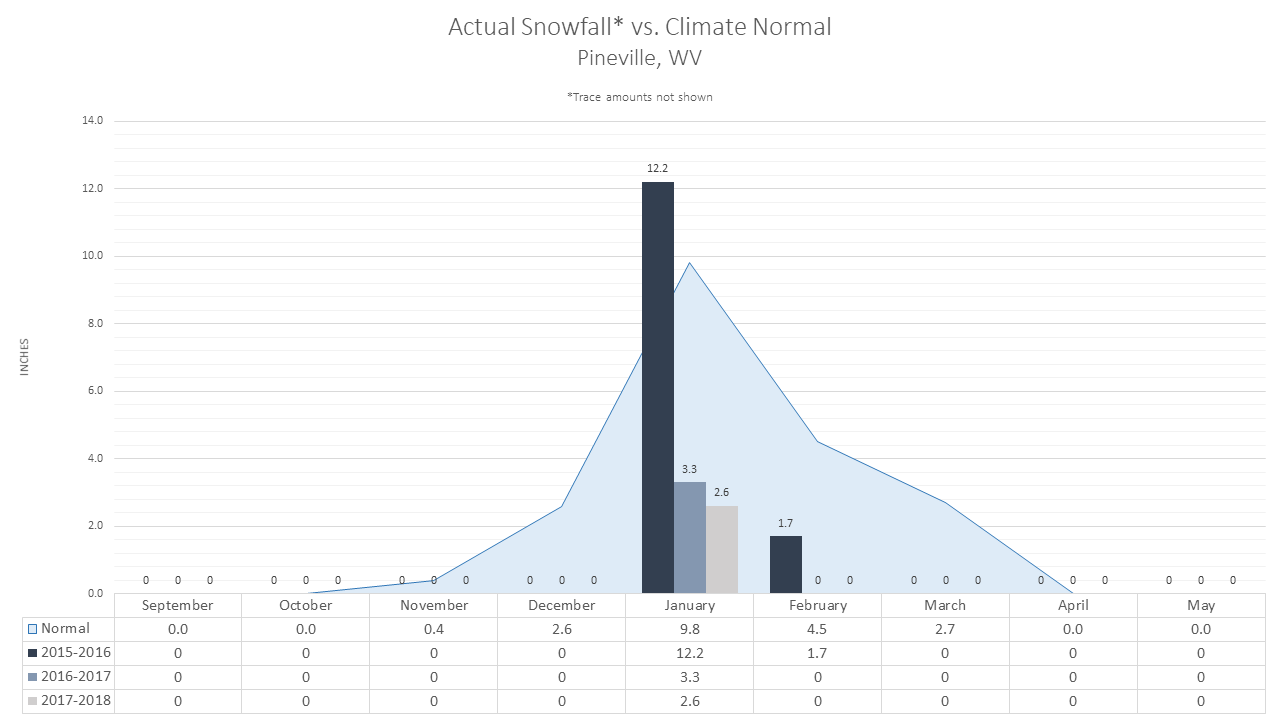
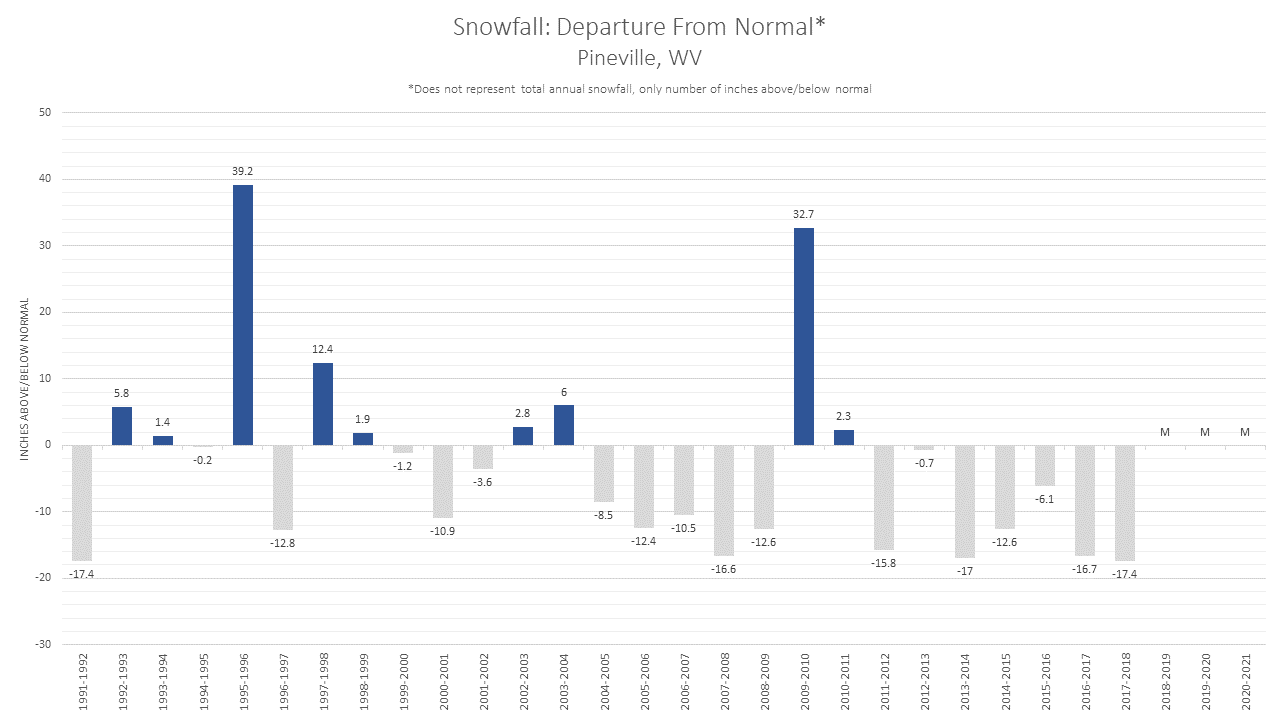
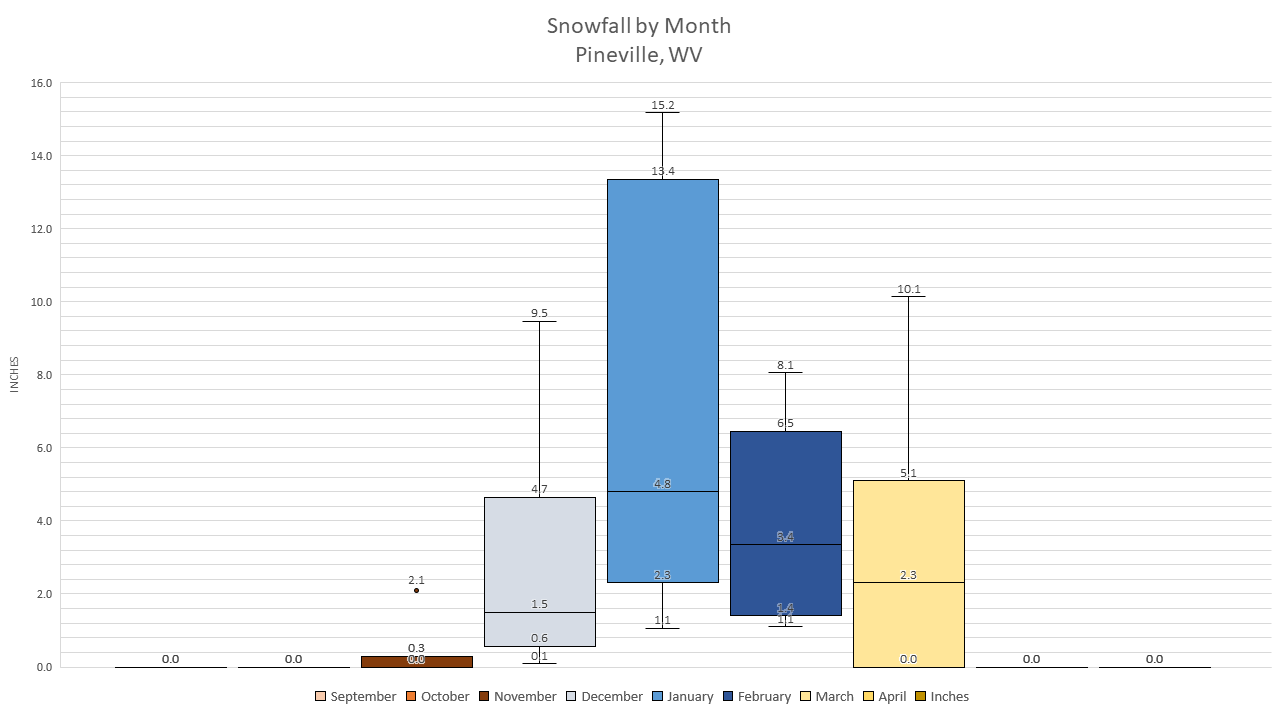
Pineville, WV |
-- |
-- |
-- |
|||
|
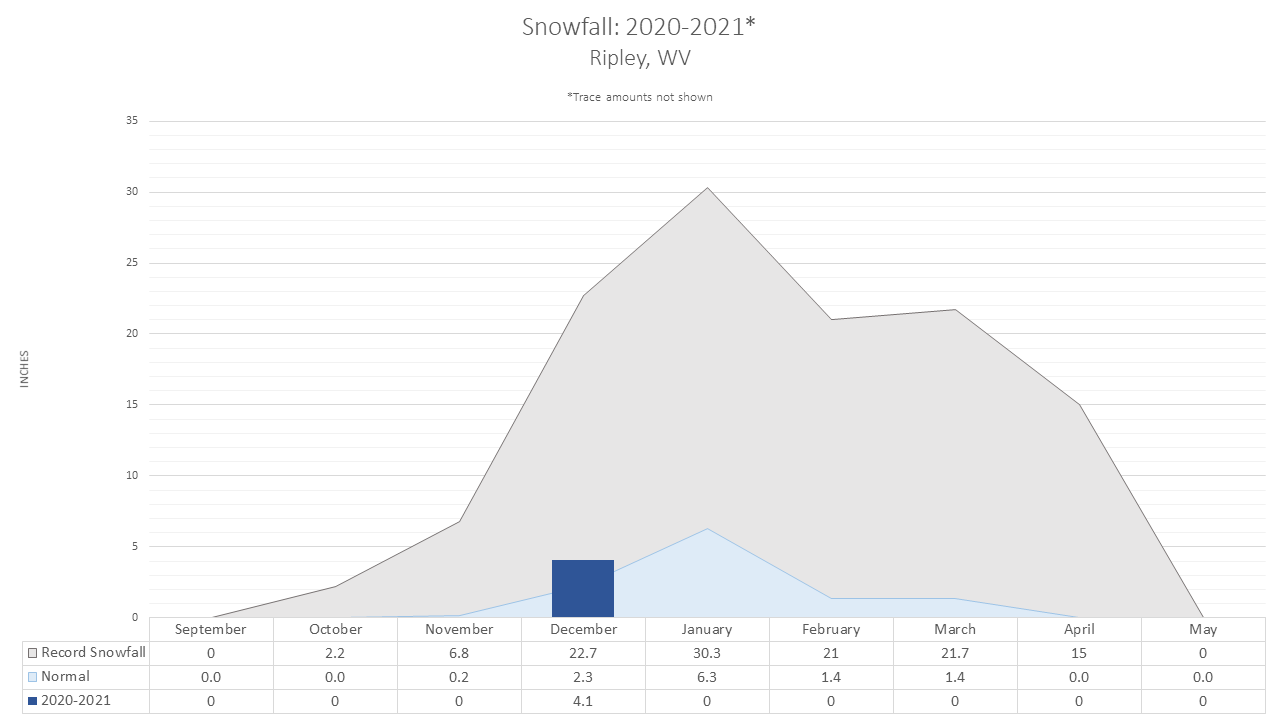
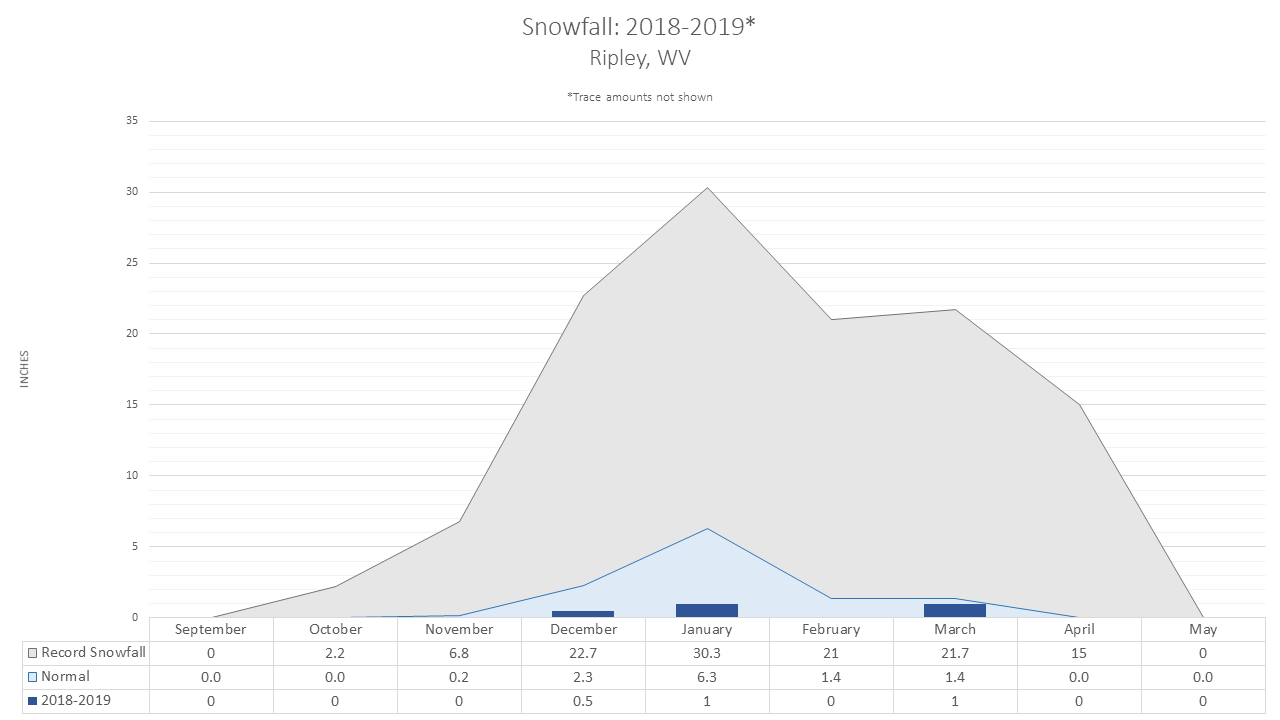
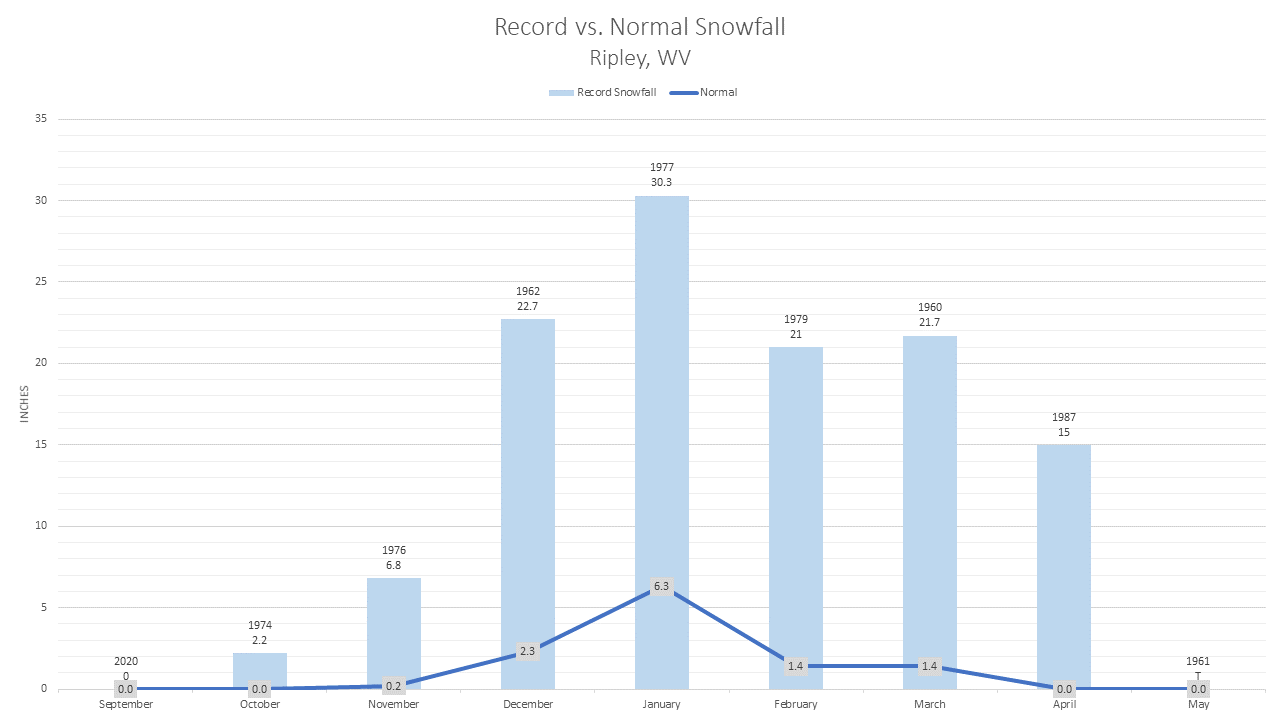
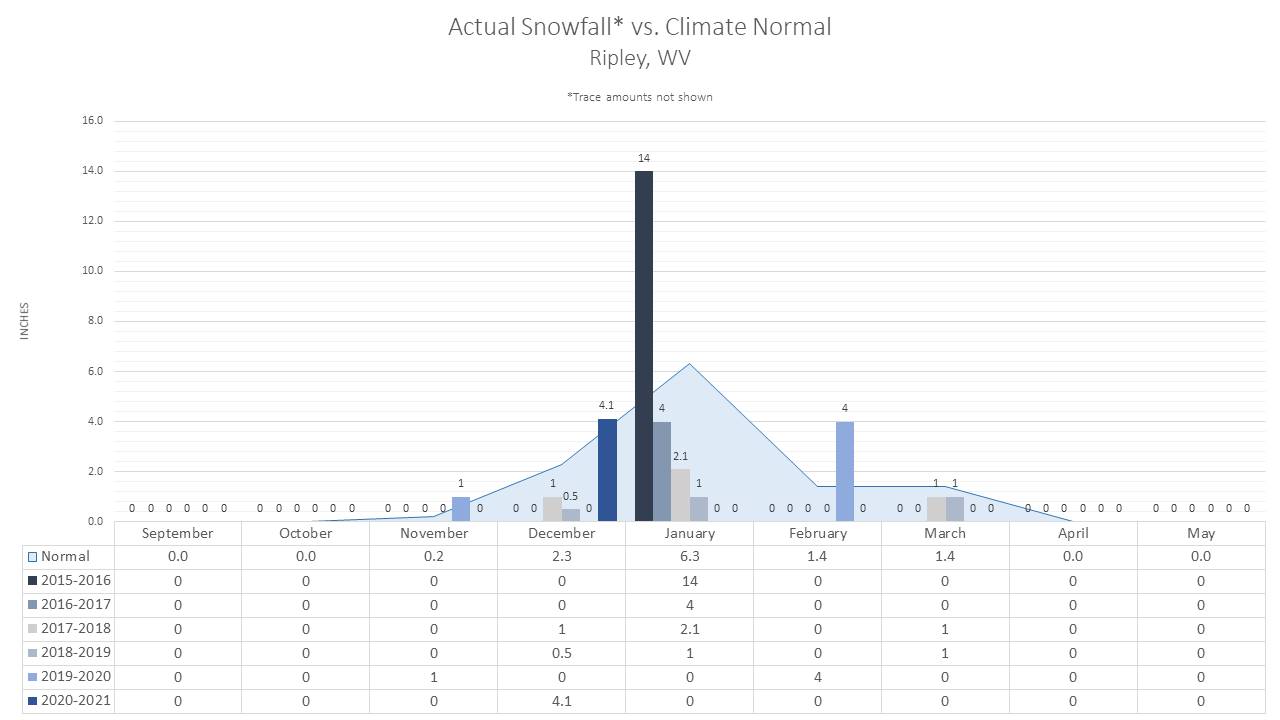
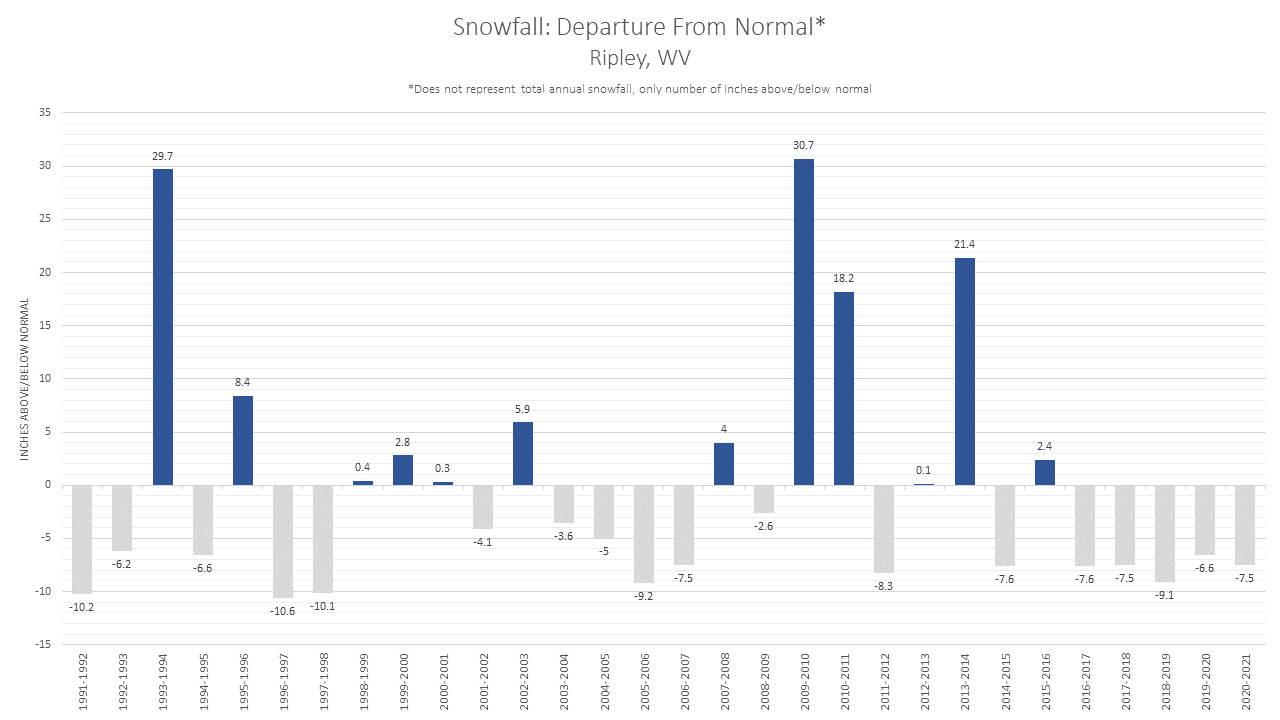
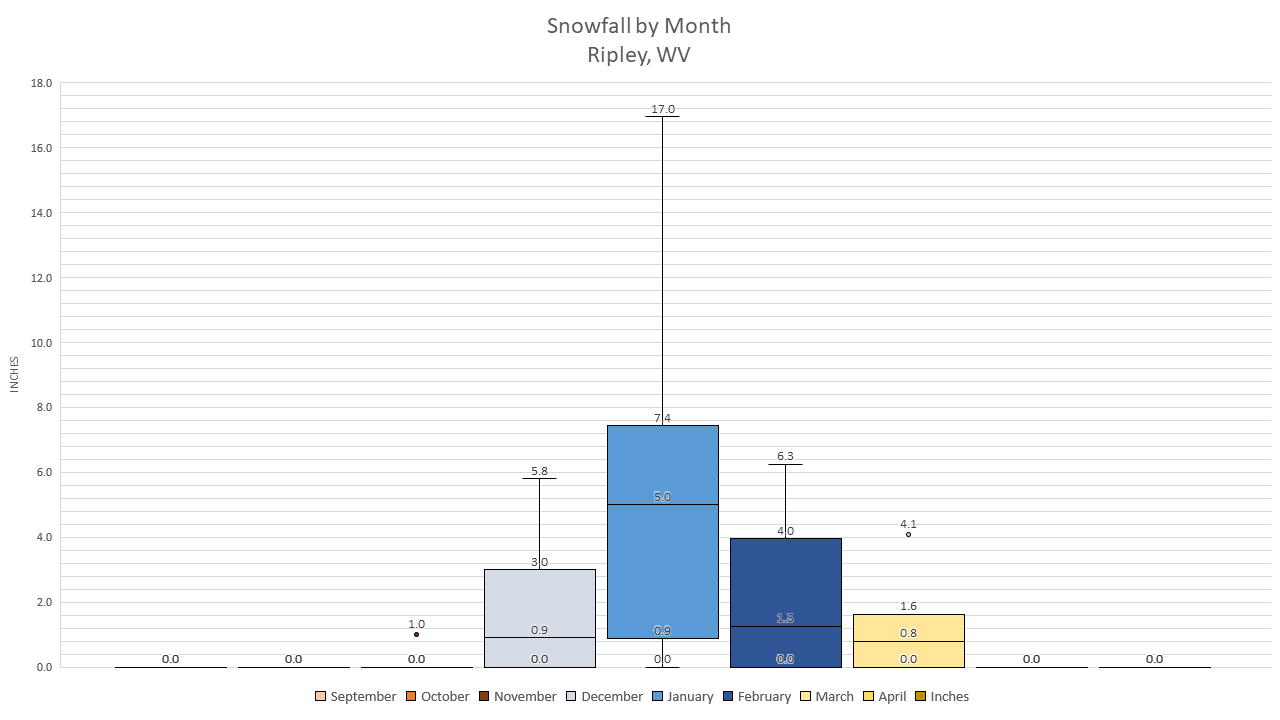
Ripley, WV |
||||||
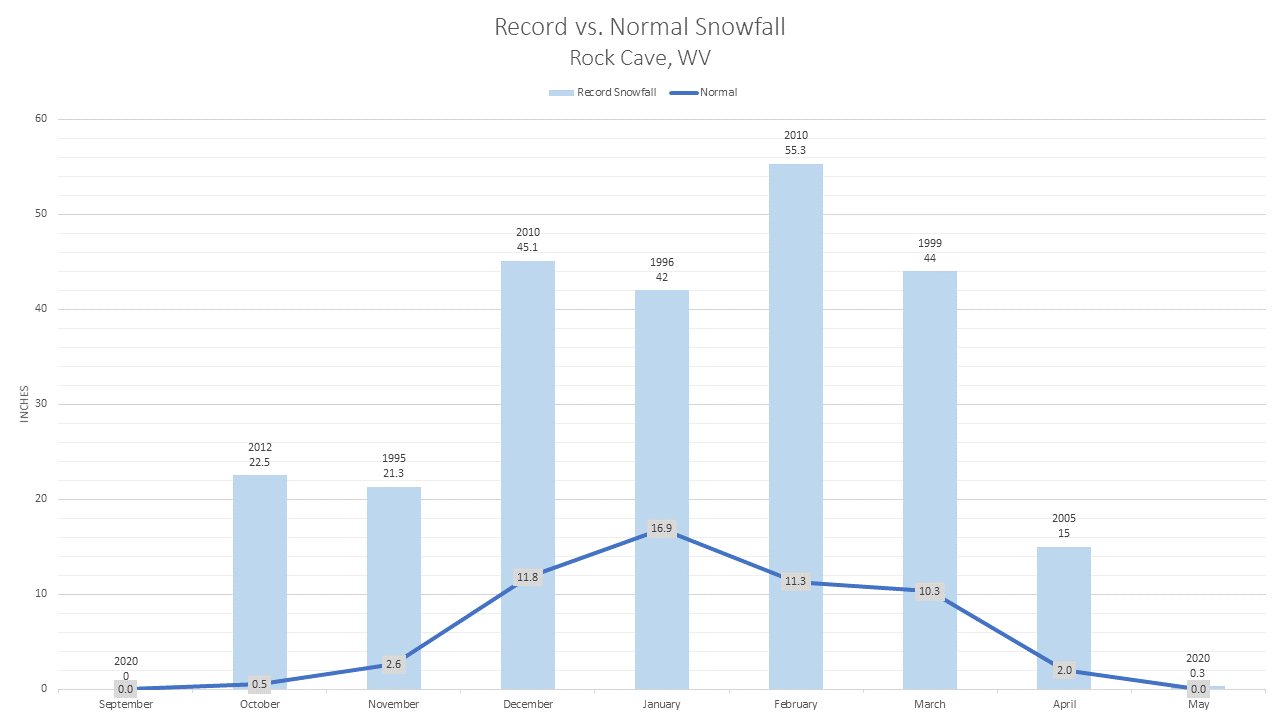
|
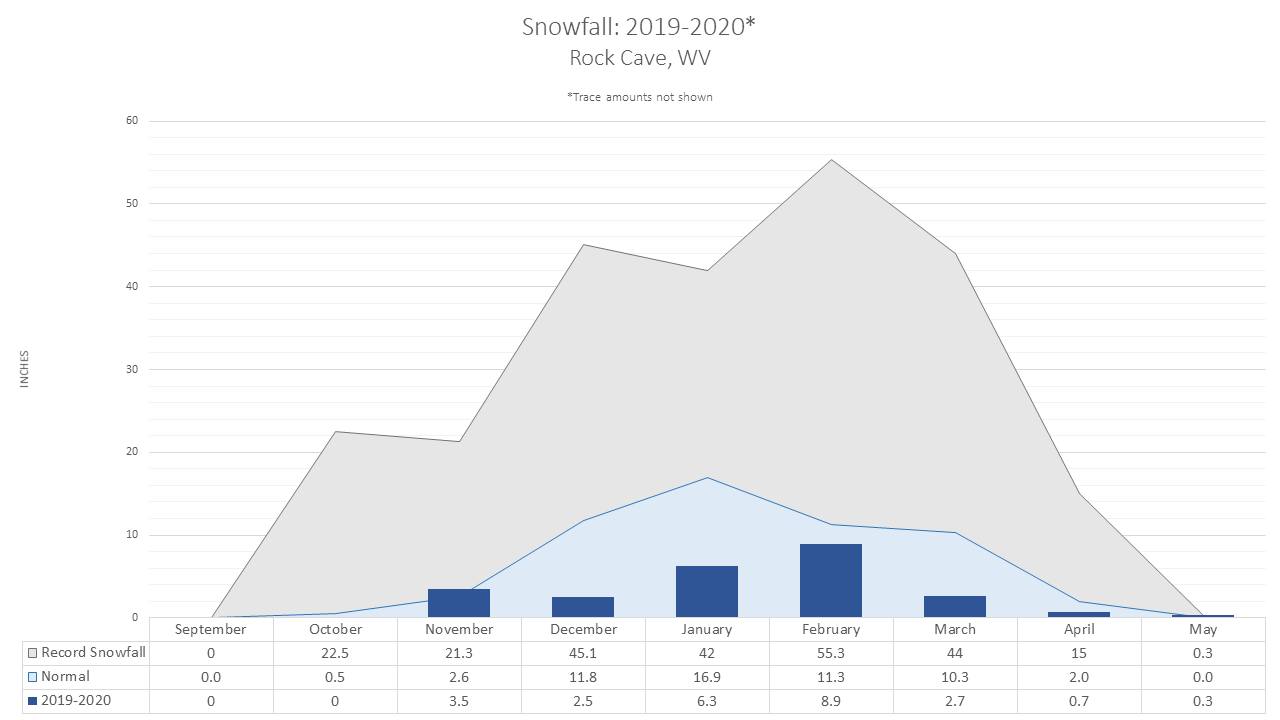
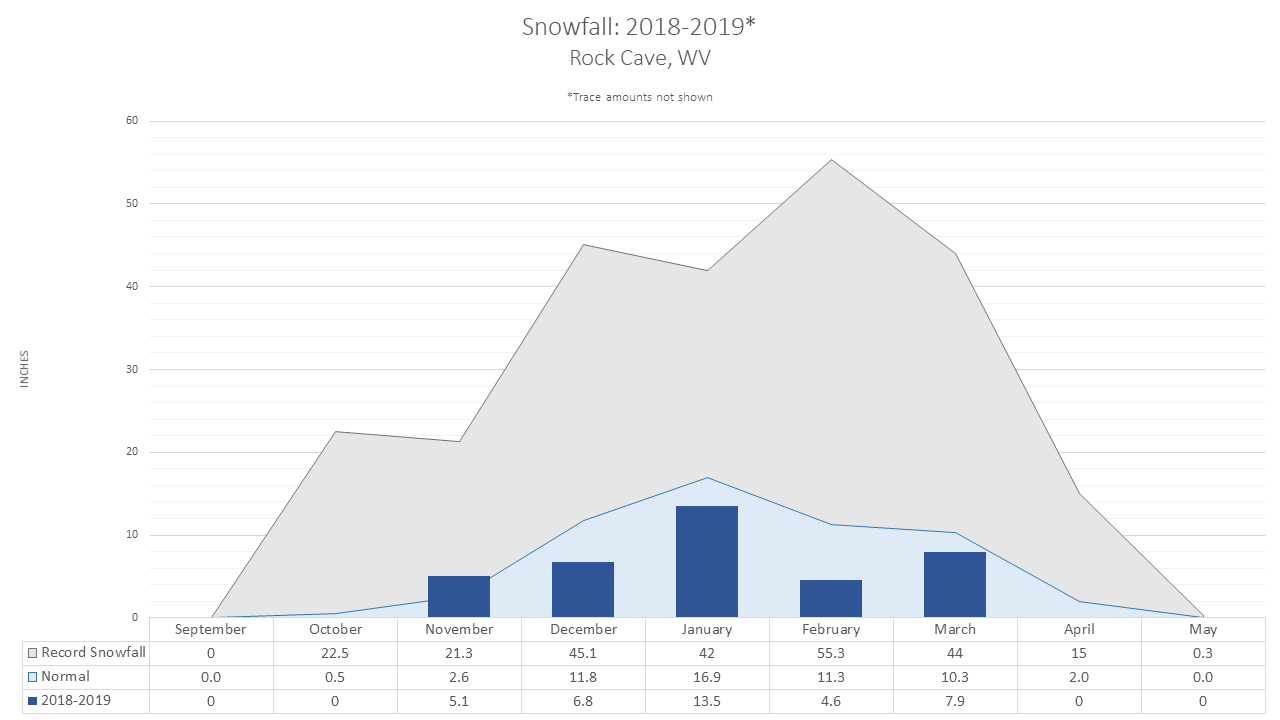
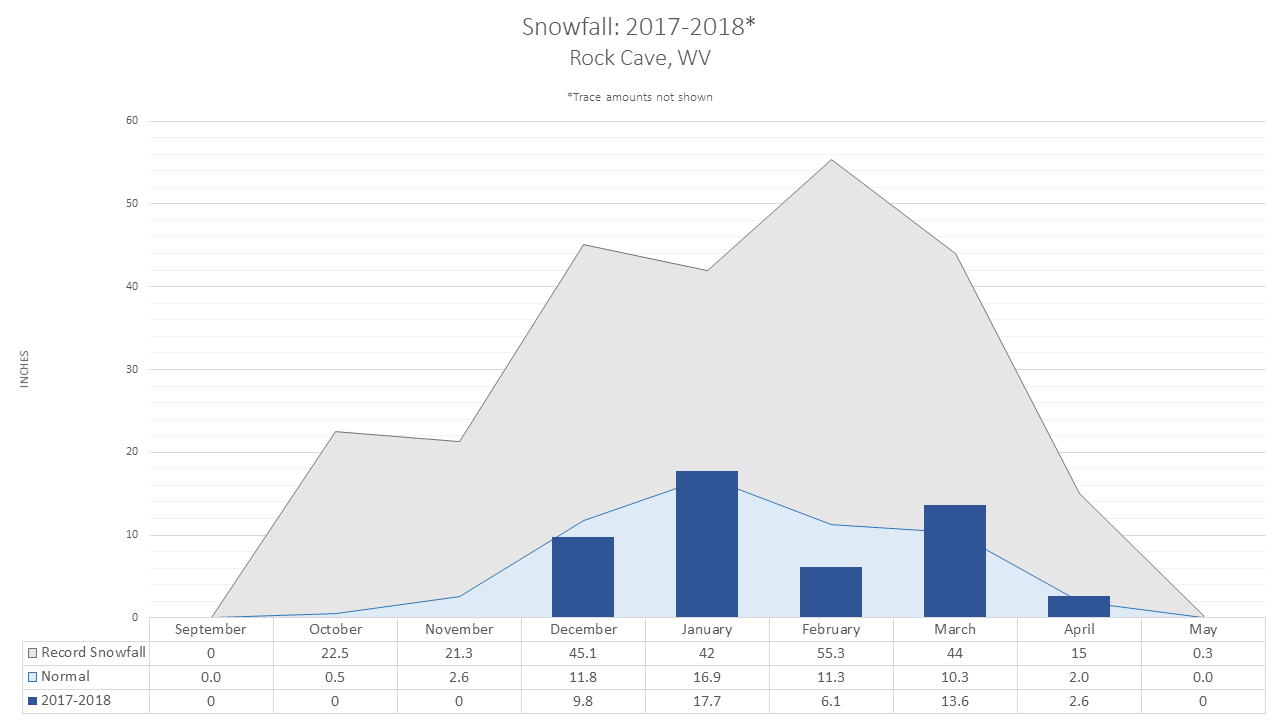
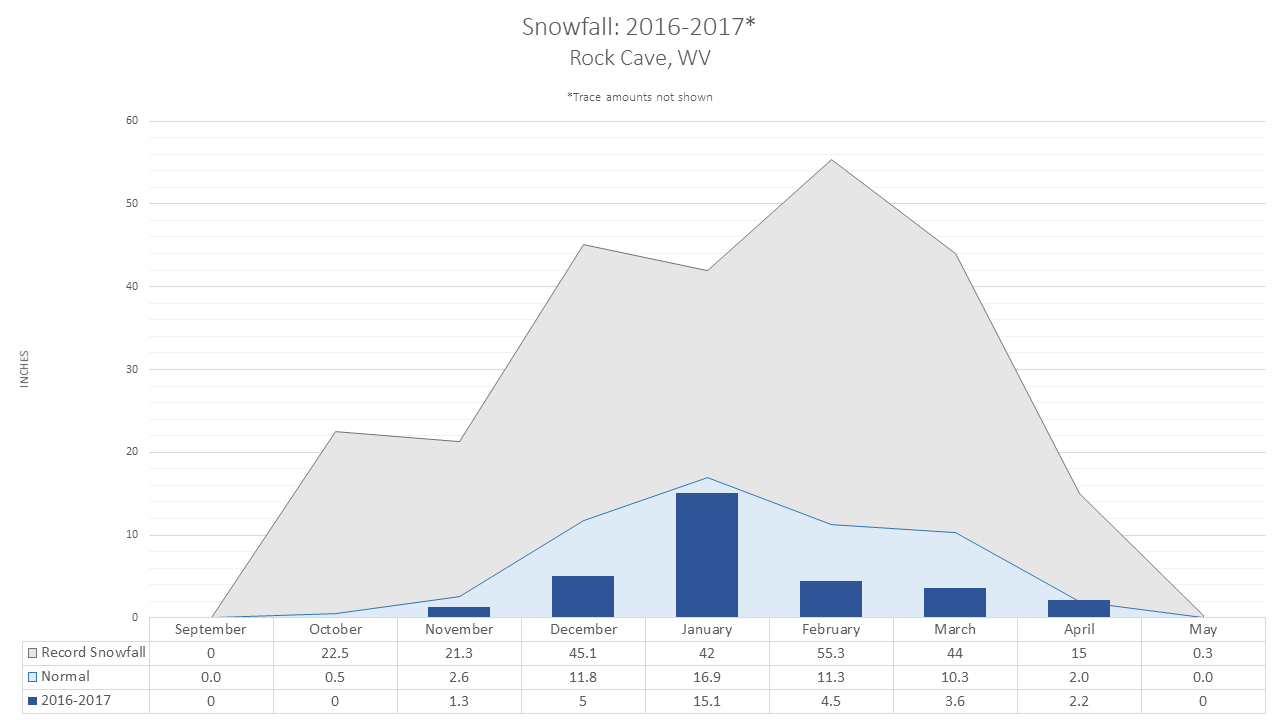
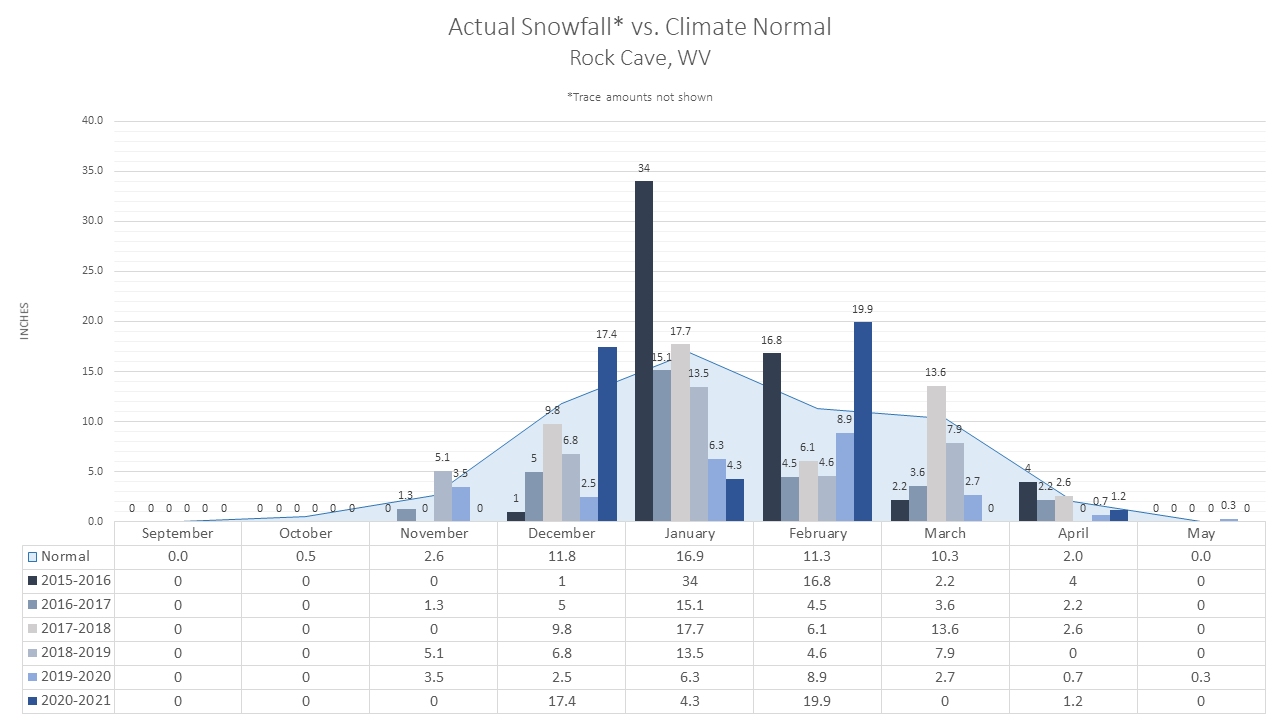
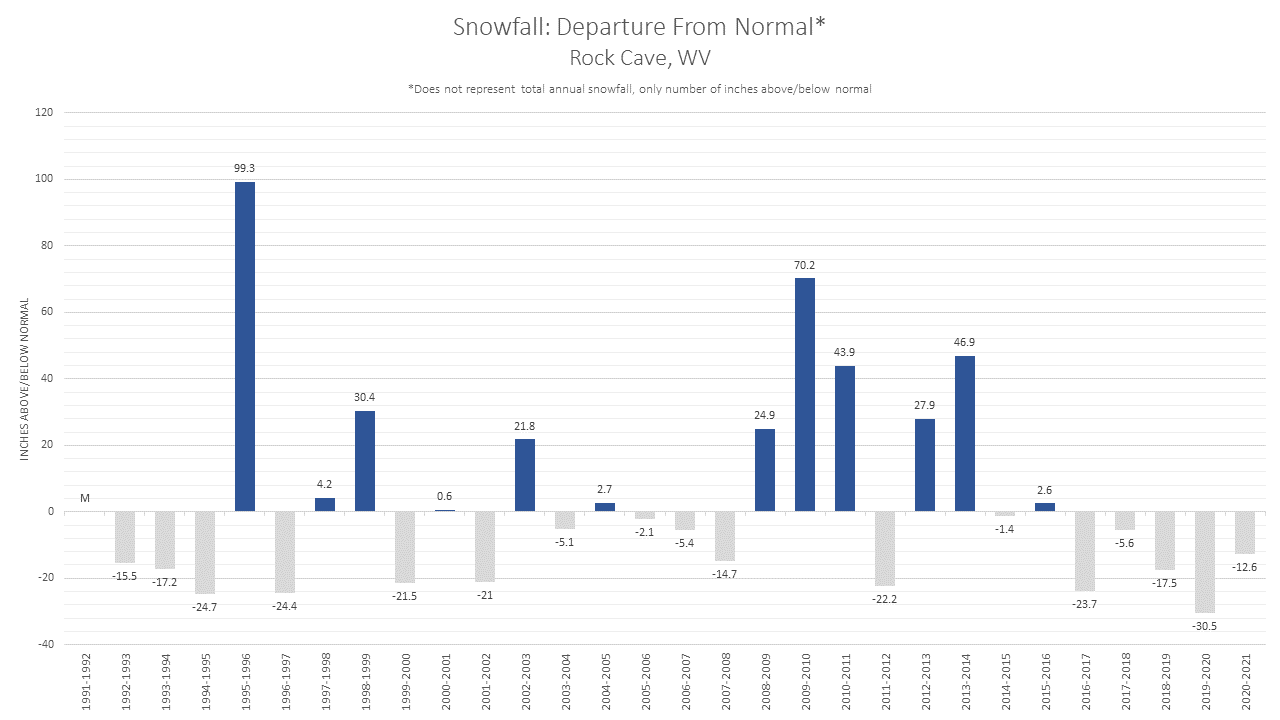
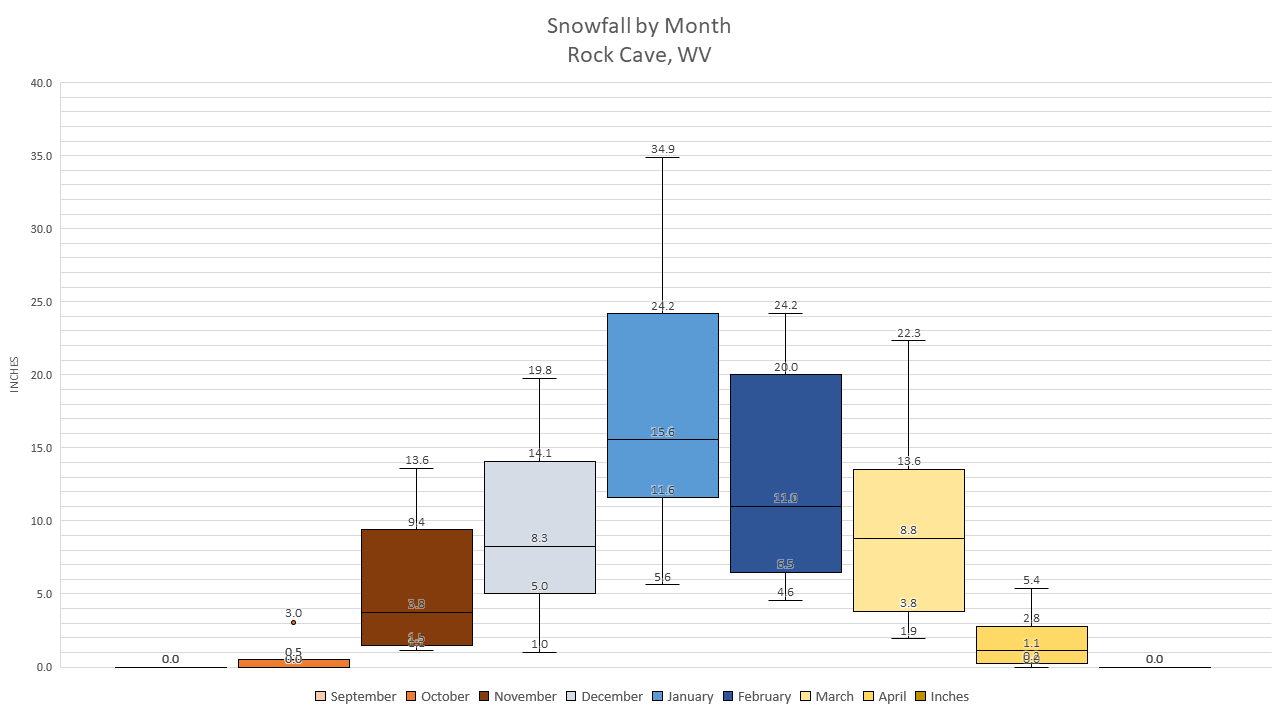
Rock Cave, WV |
||||||
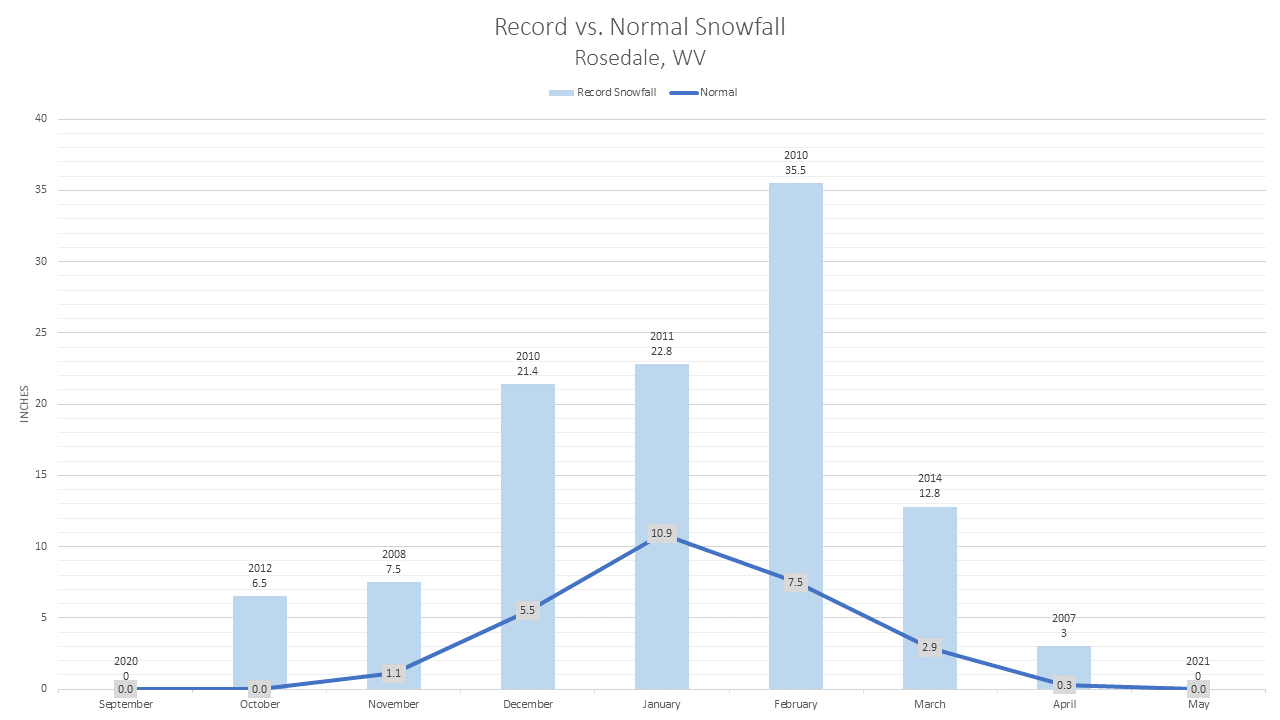
|
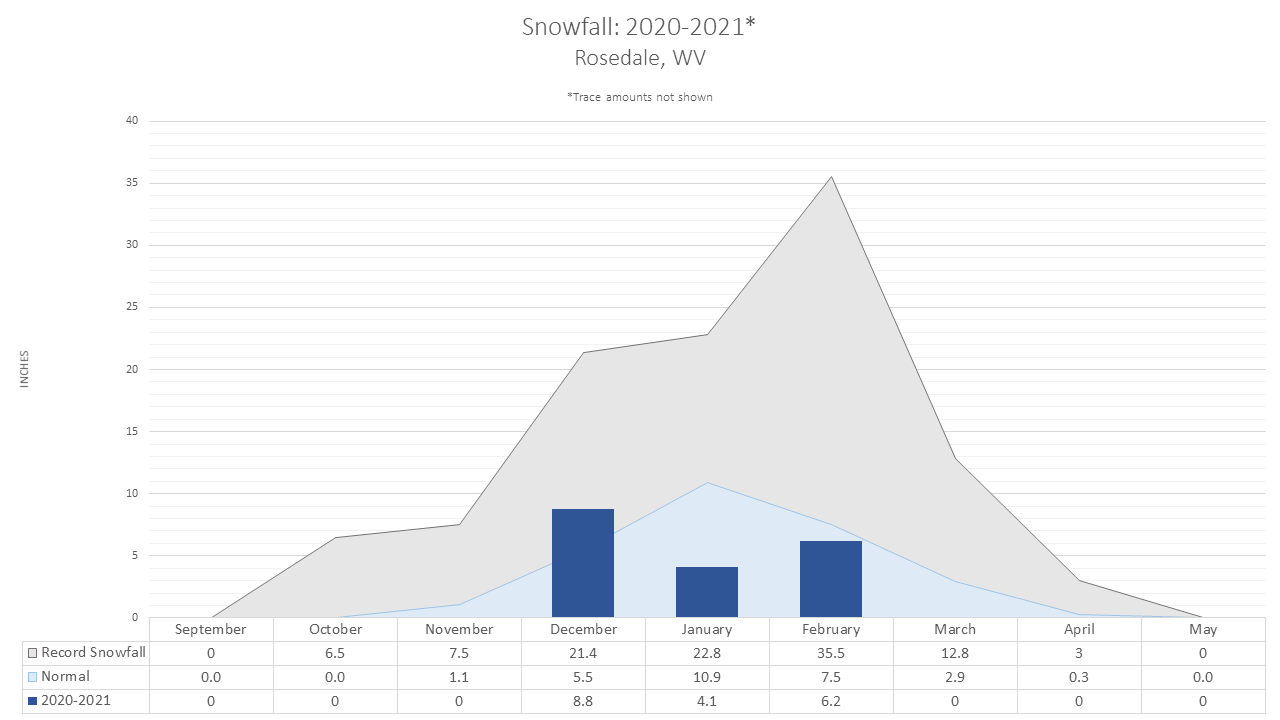
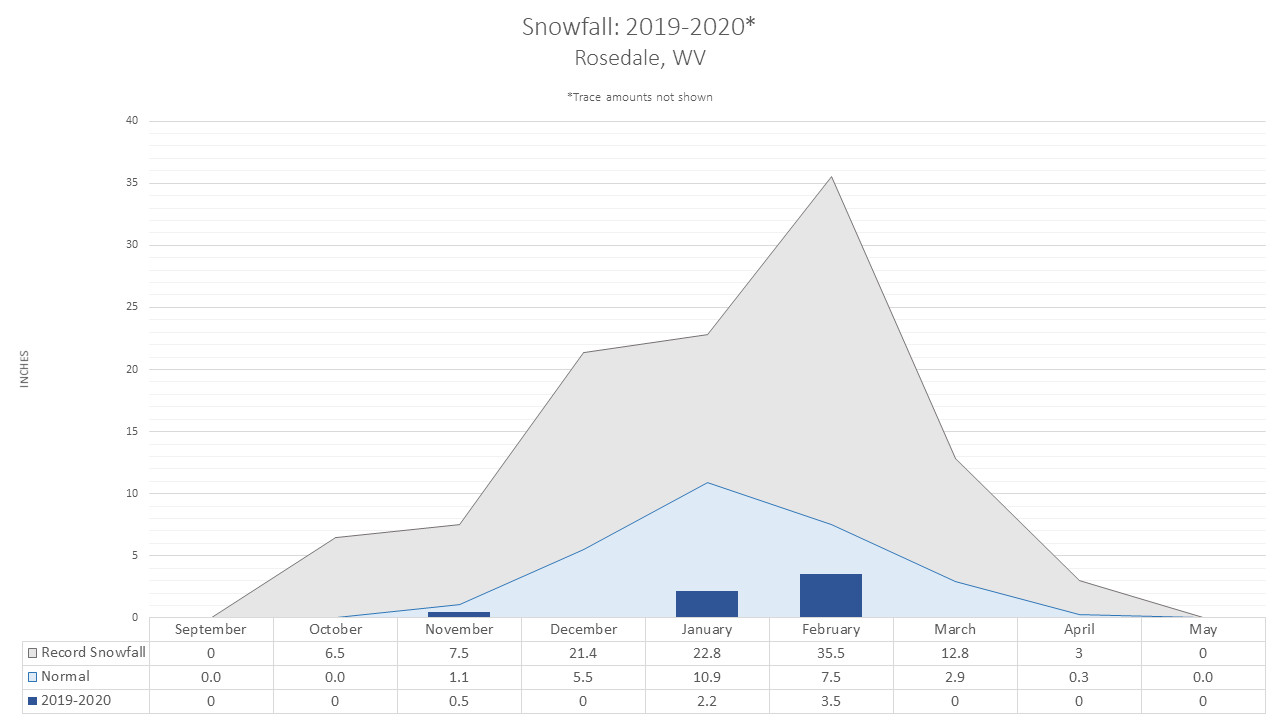
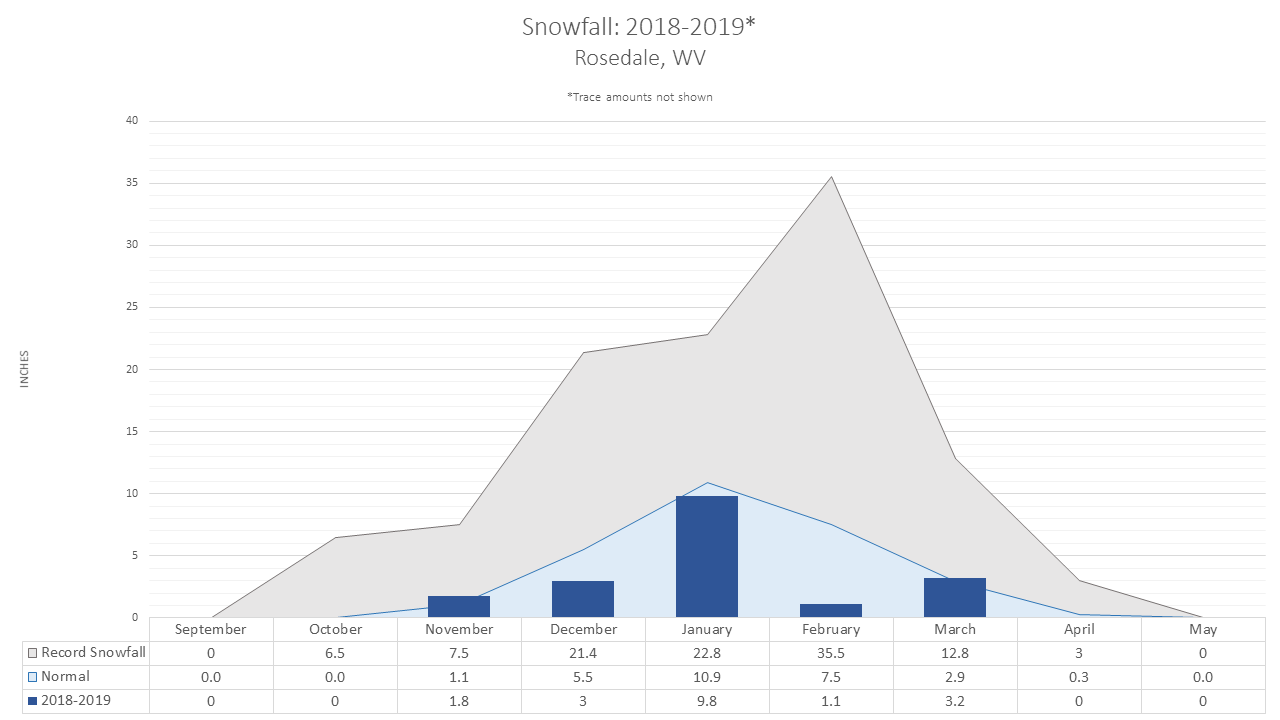
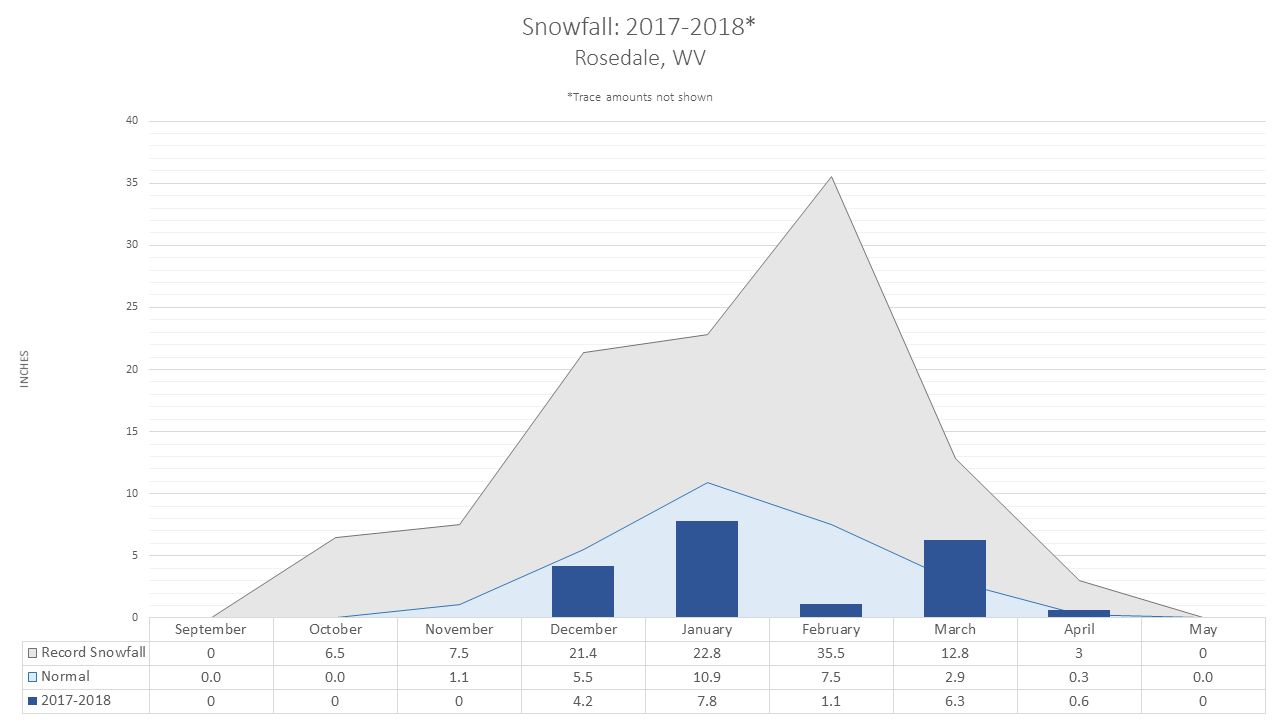
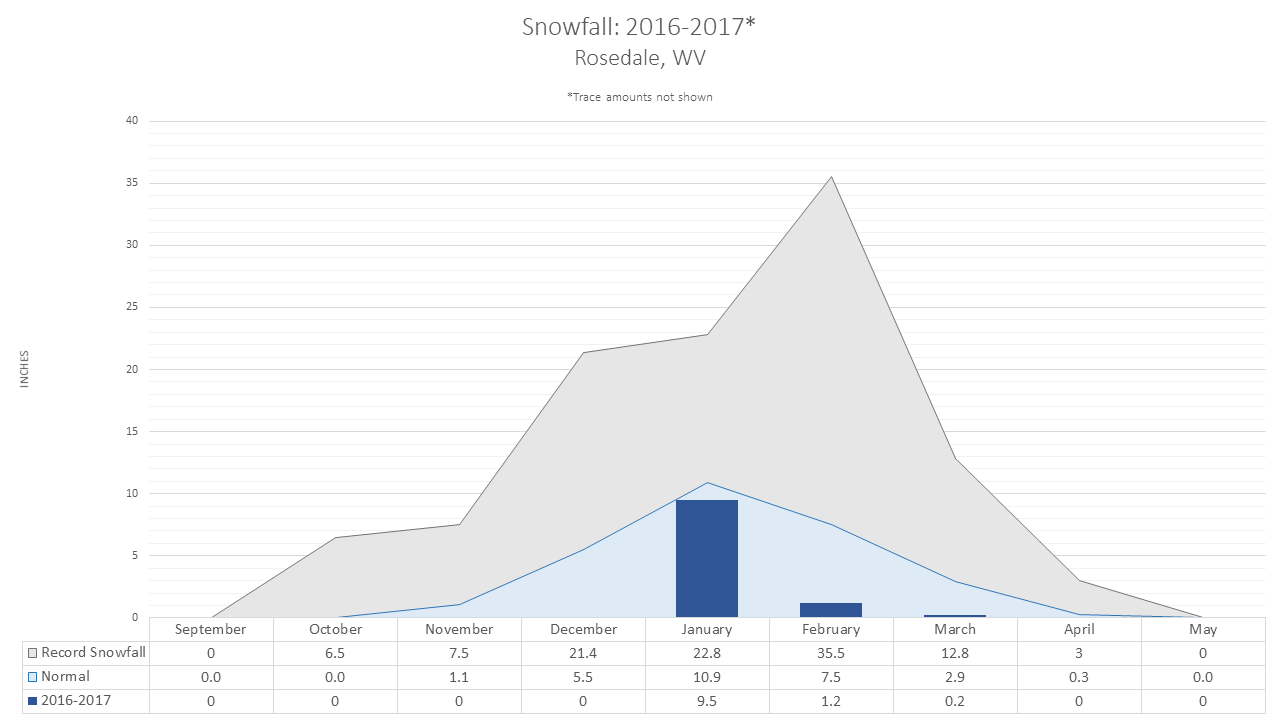
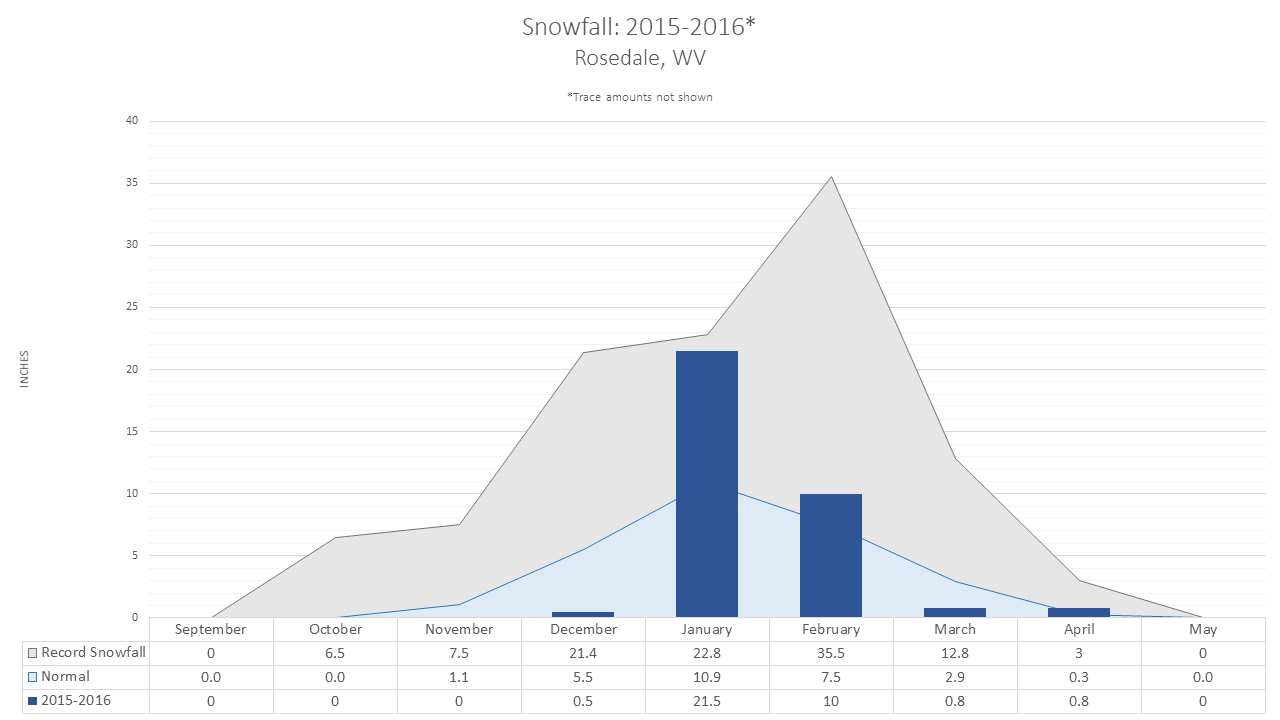
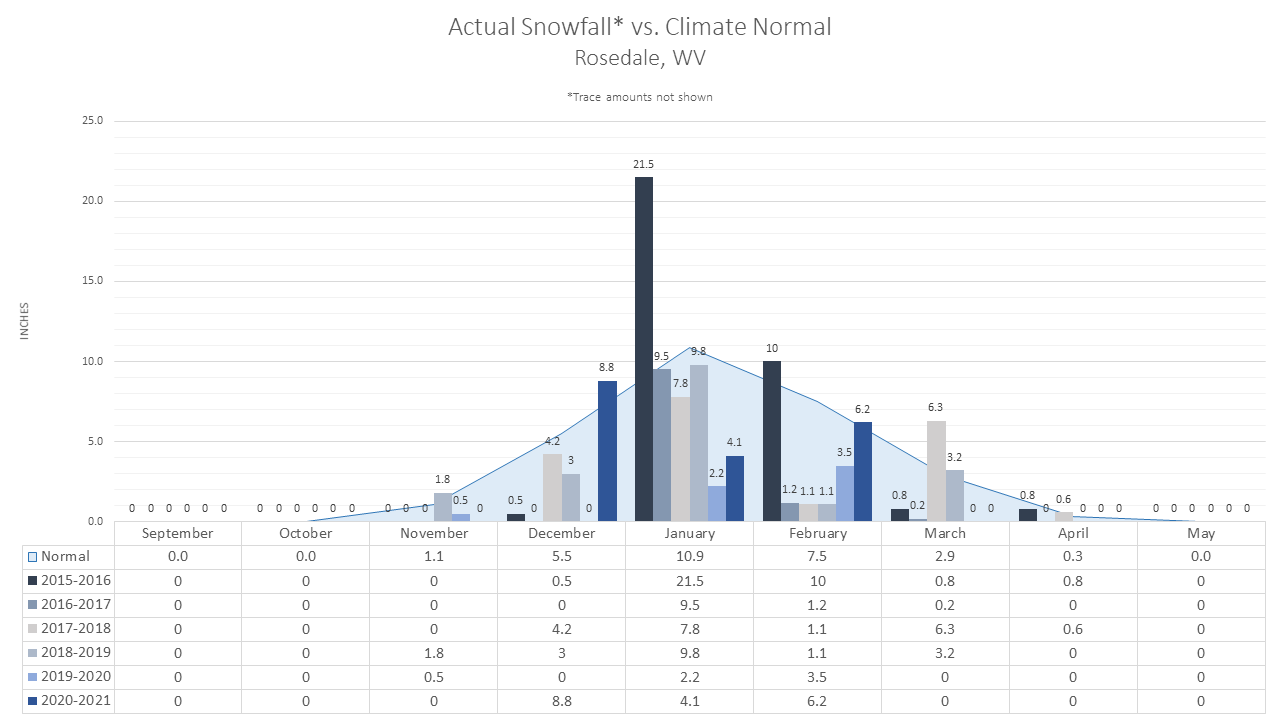
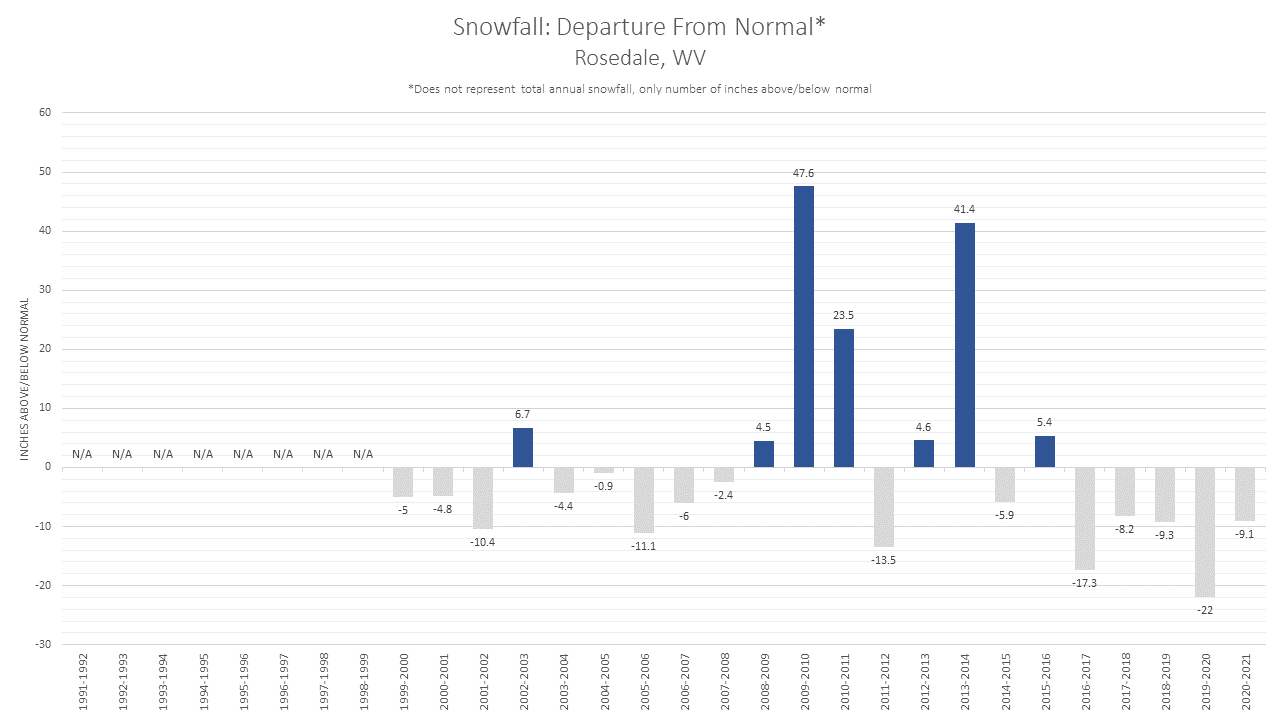
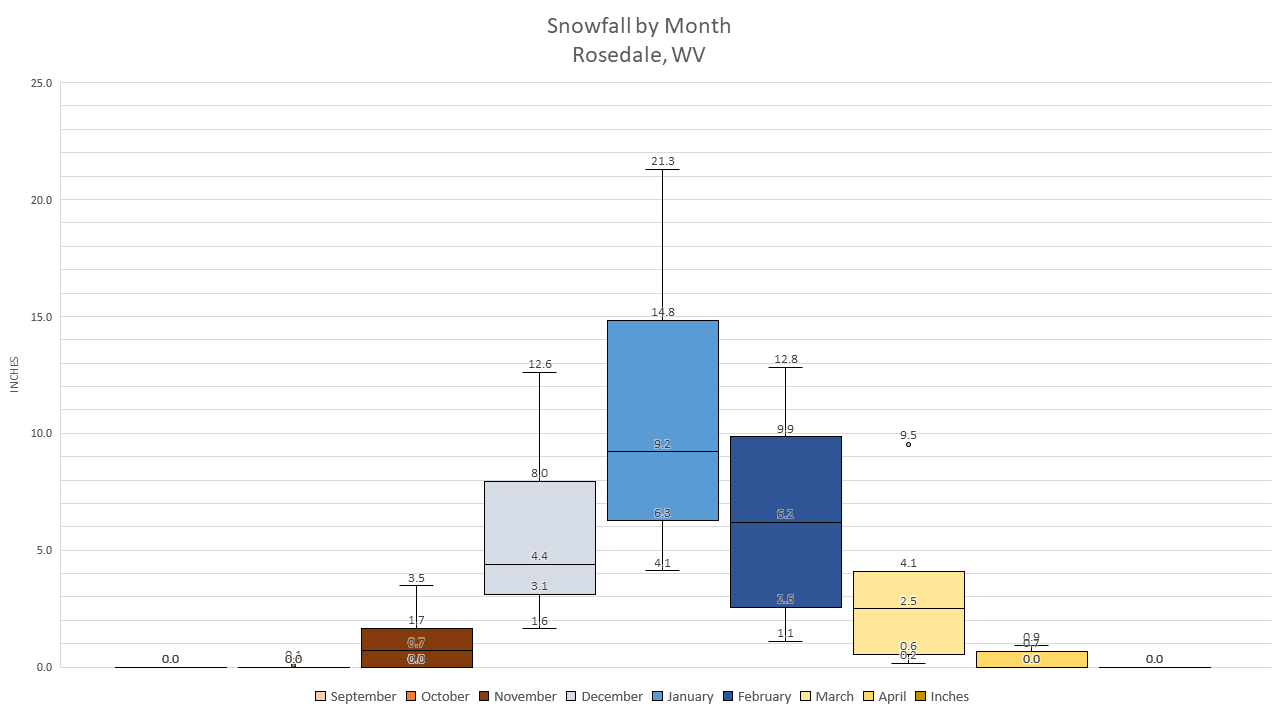
Rosedale, WV |
||||||
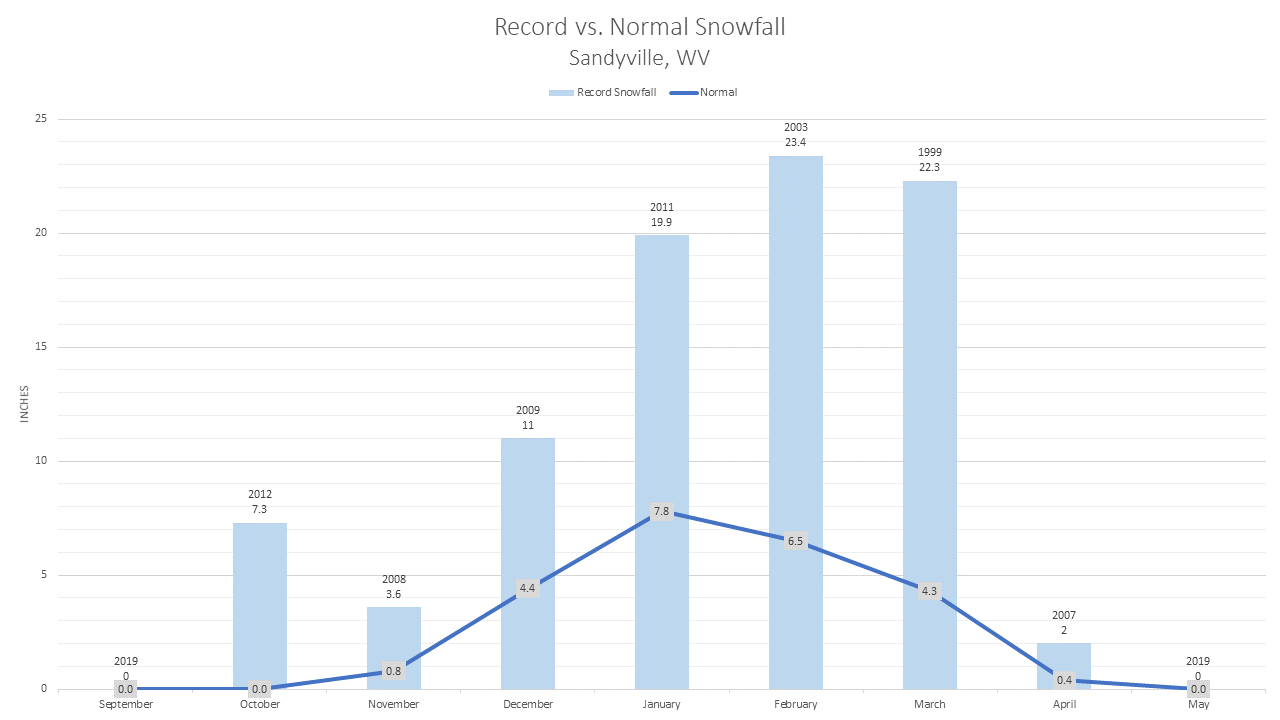
|
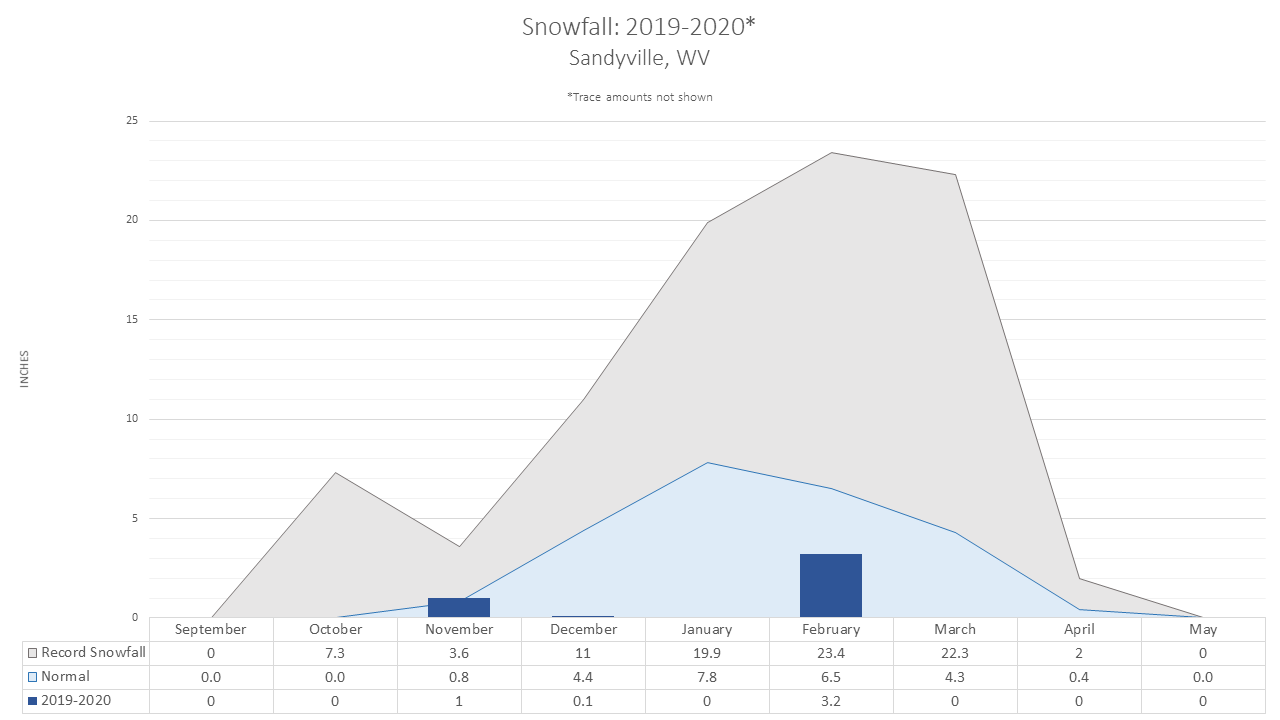
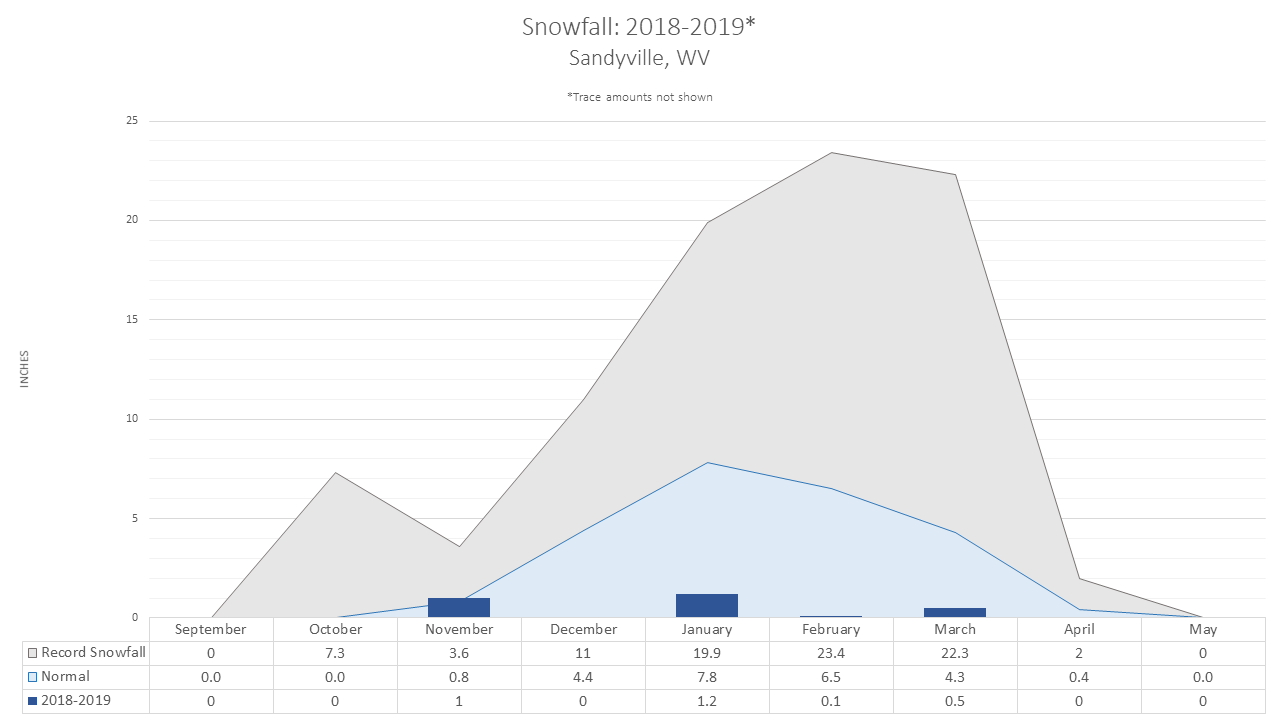
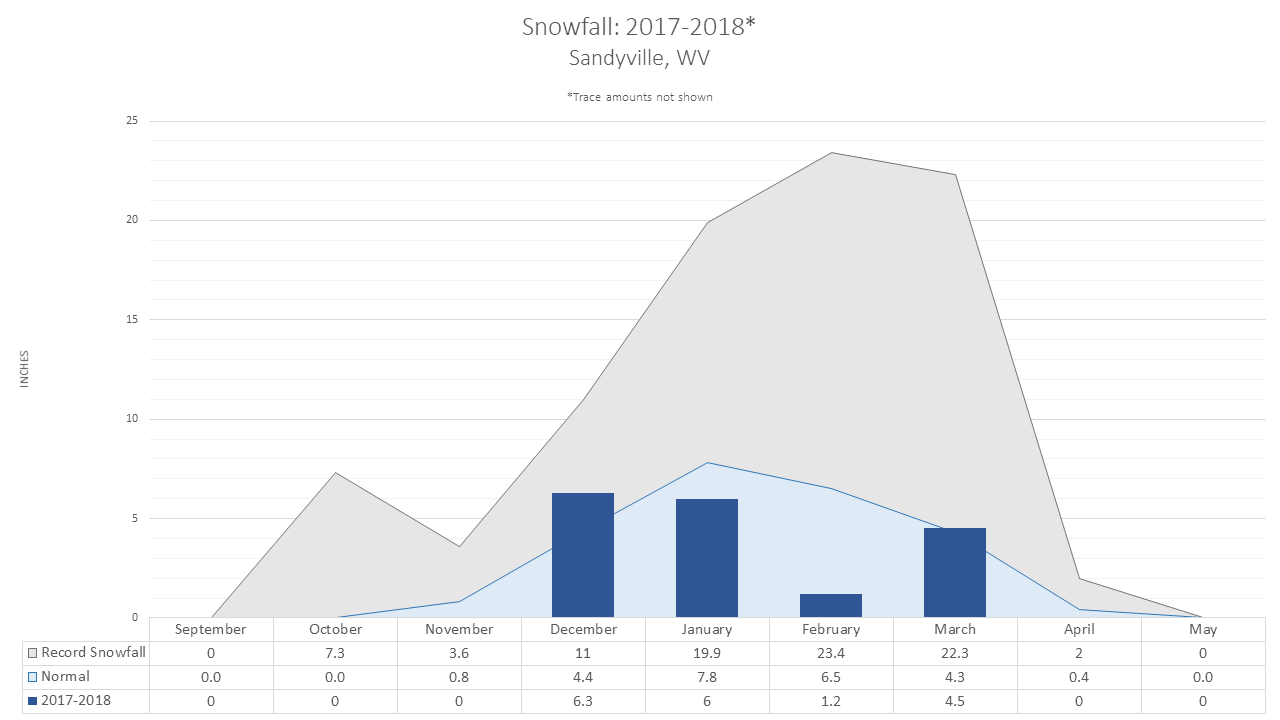
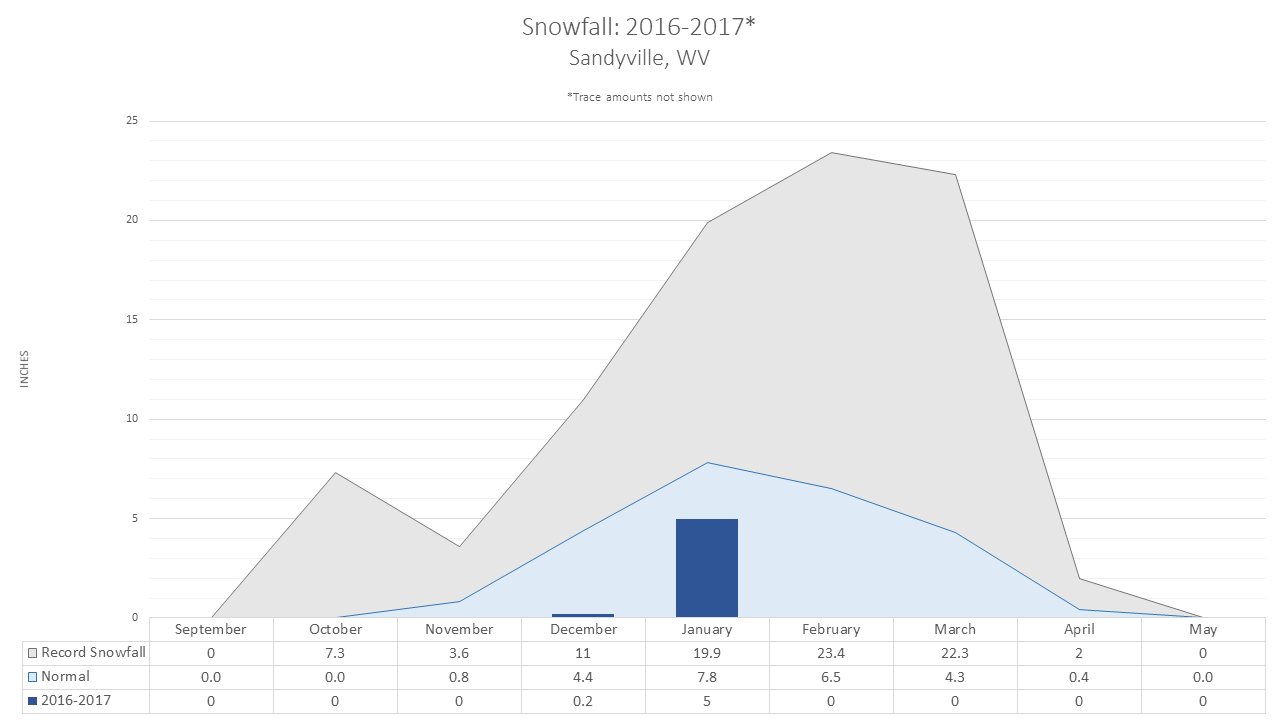
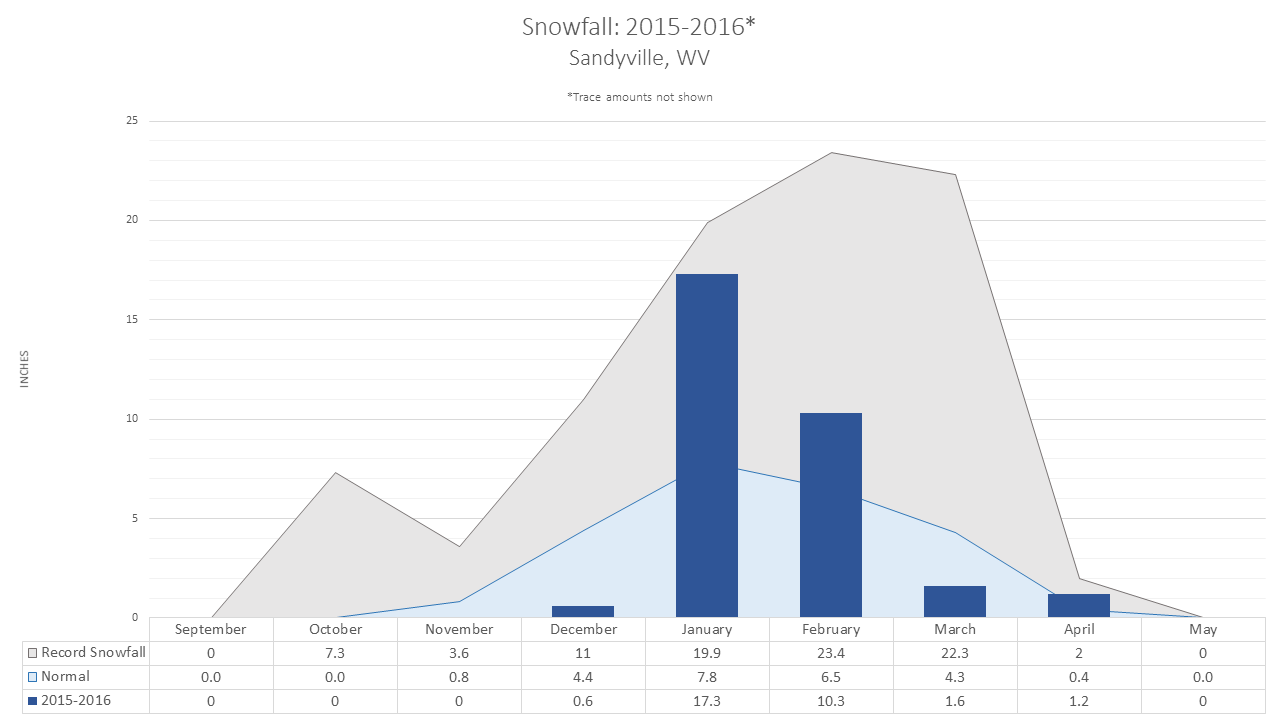
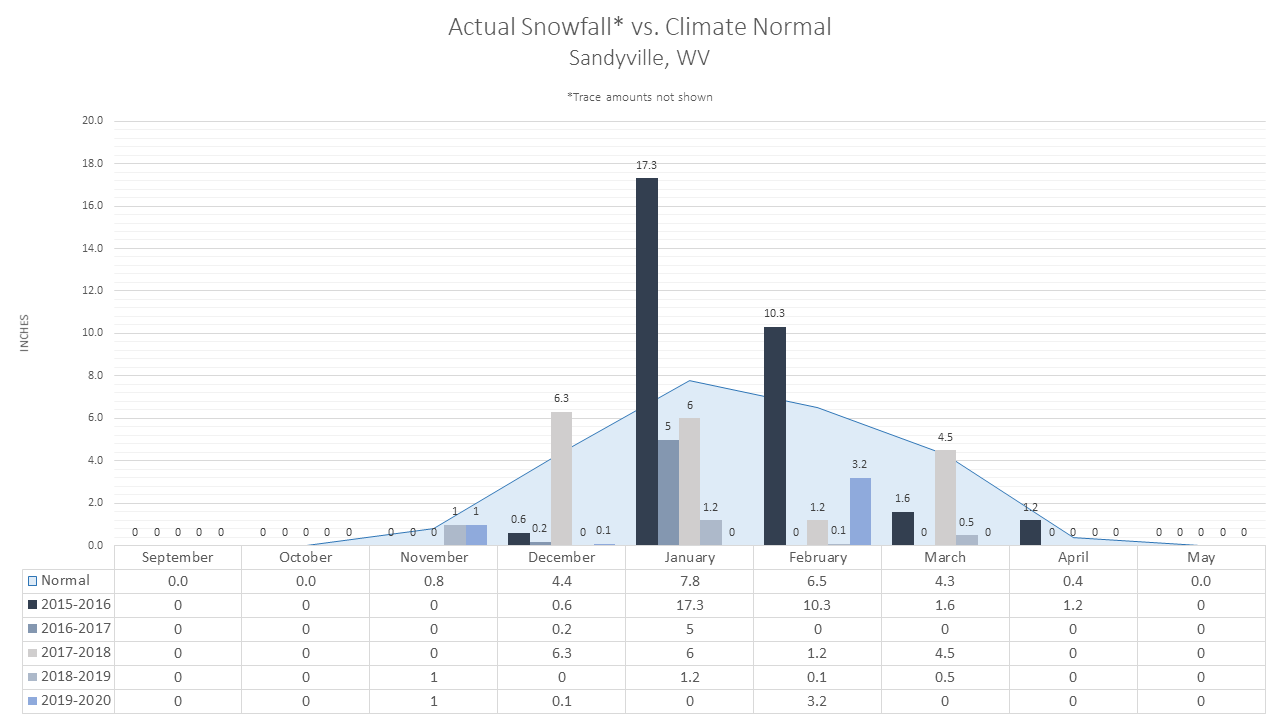
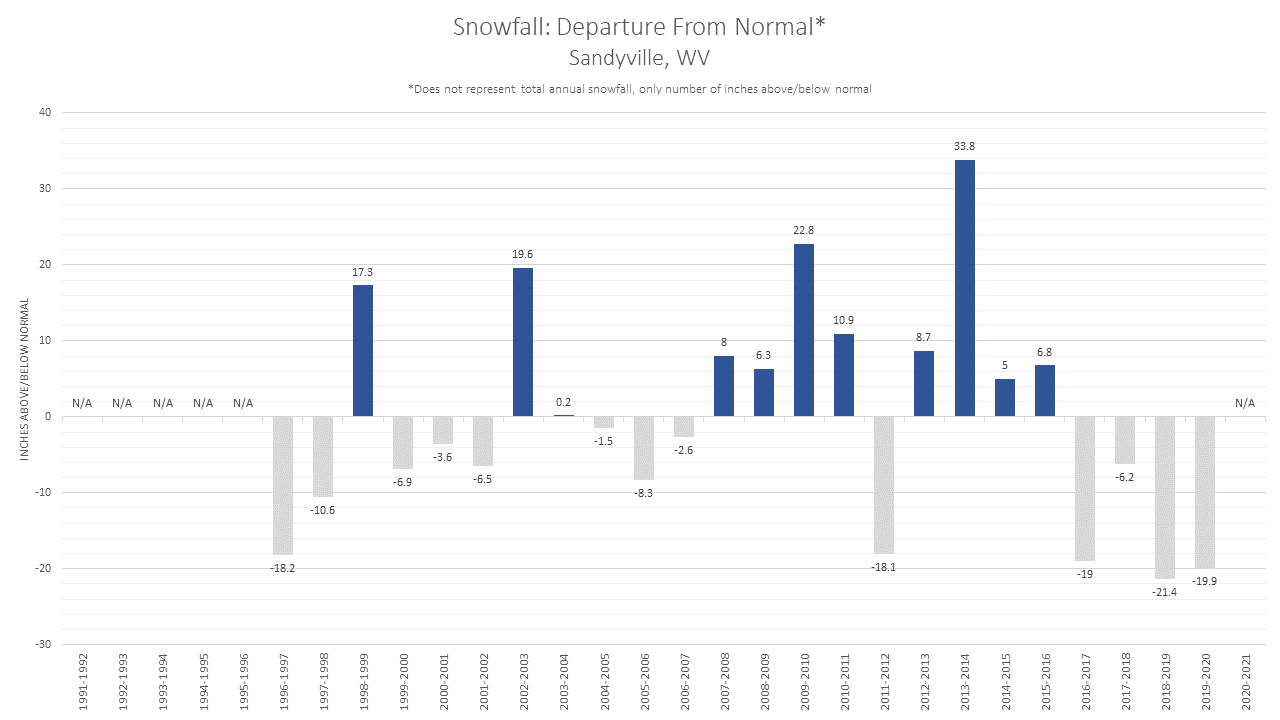
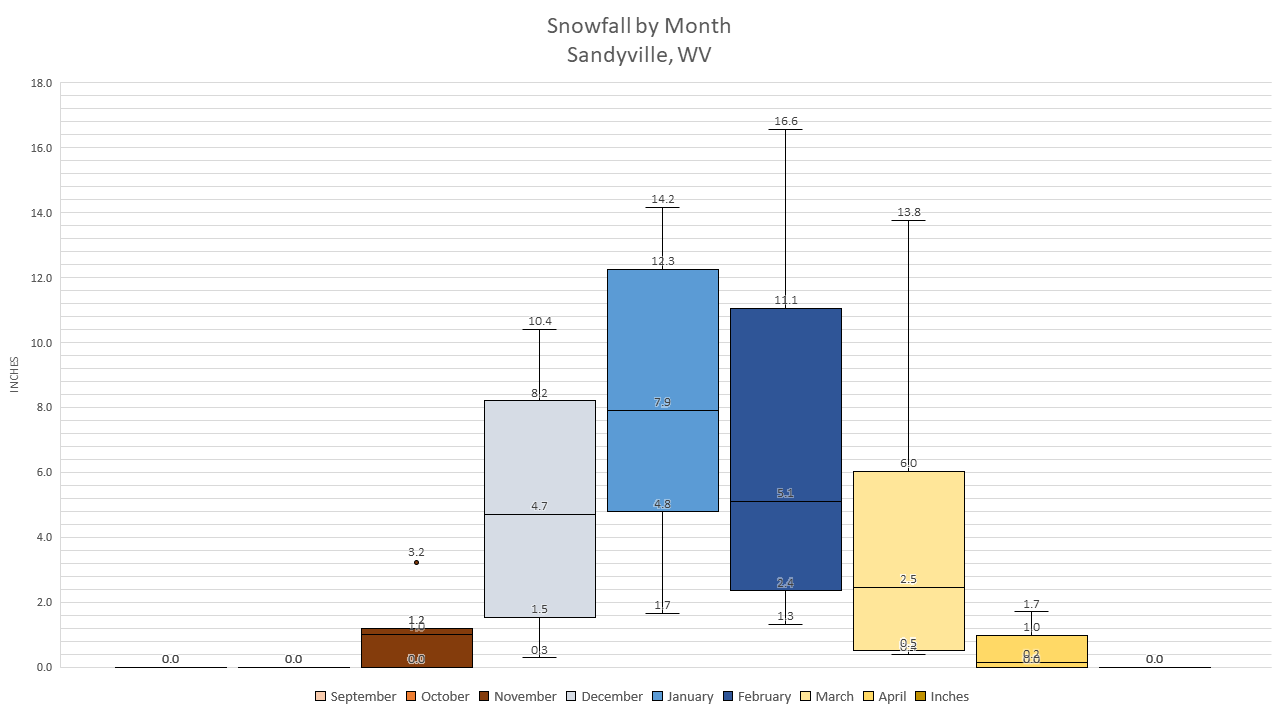
Sandyville, WV |
-- |
|||||
|
Snowshoe, WV |
||||||
|
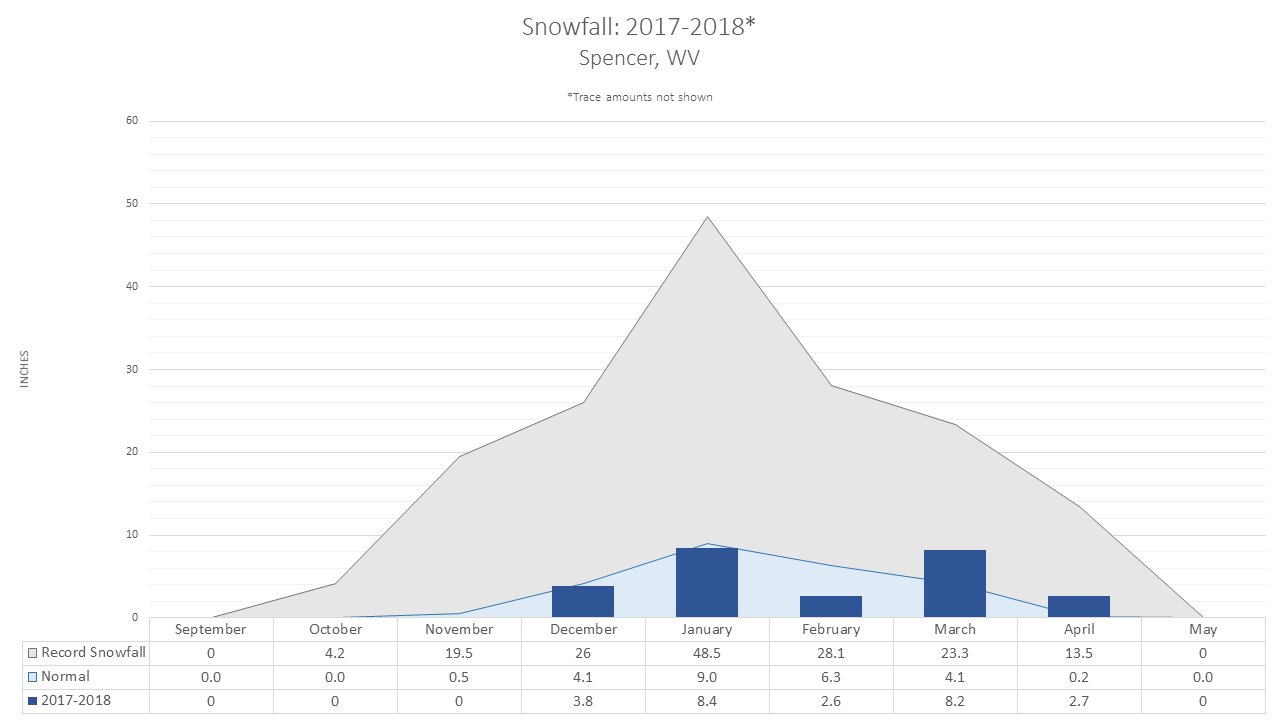
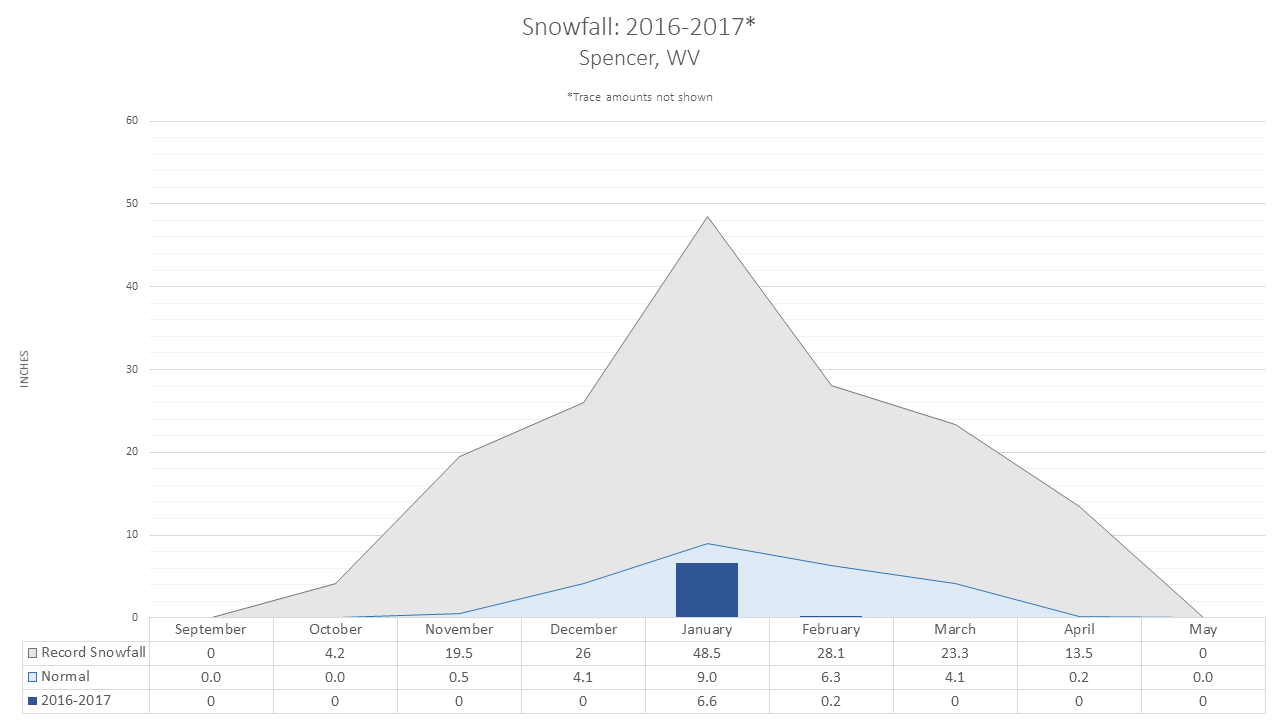
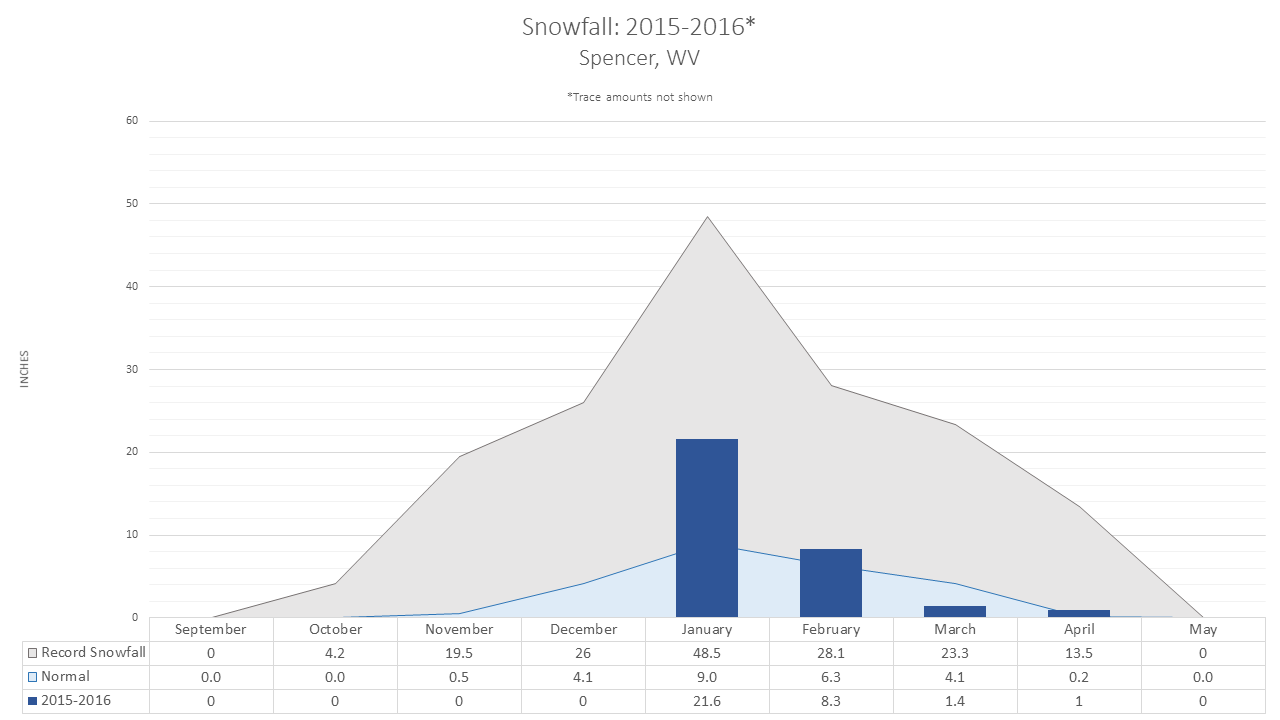
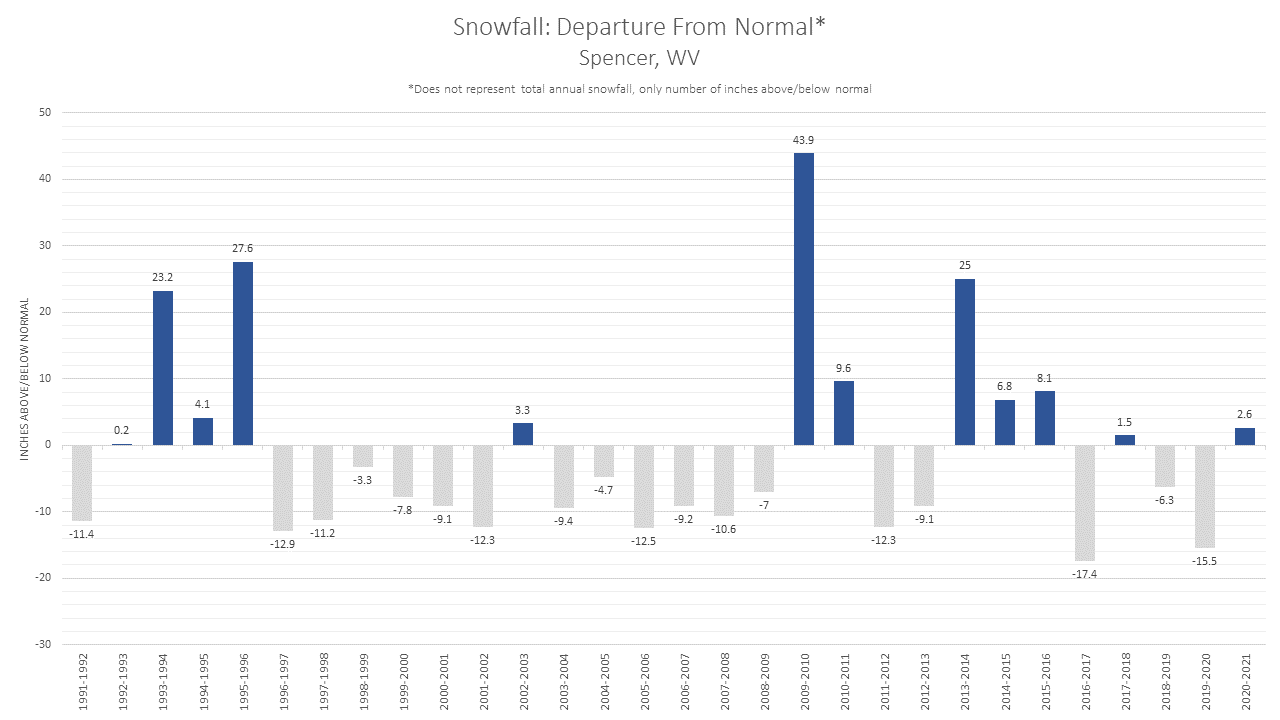
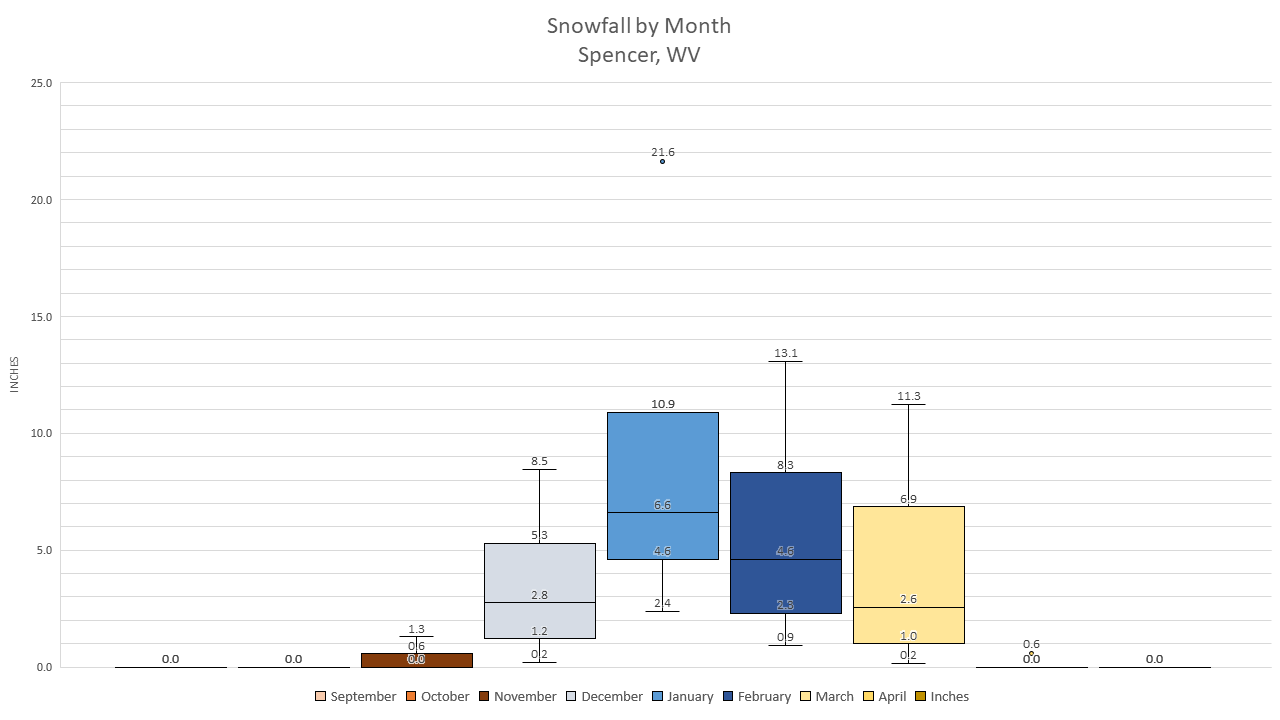
Spencer, WV |
||||||
|
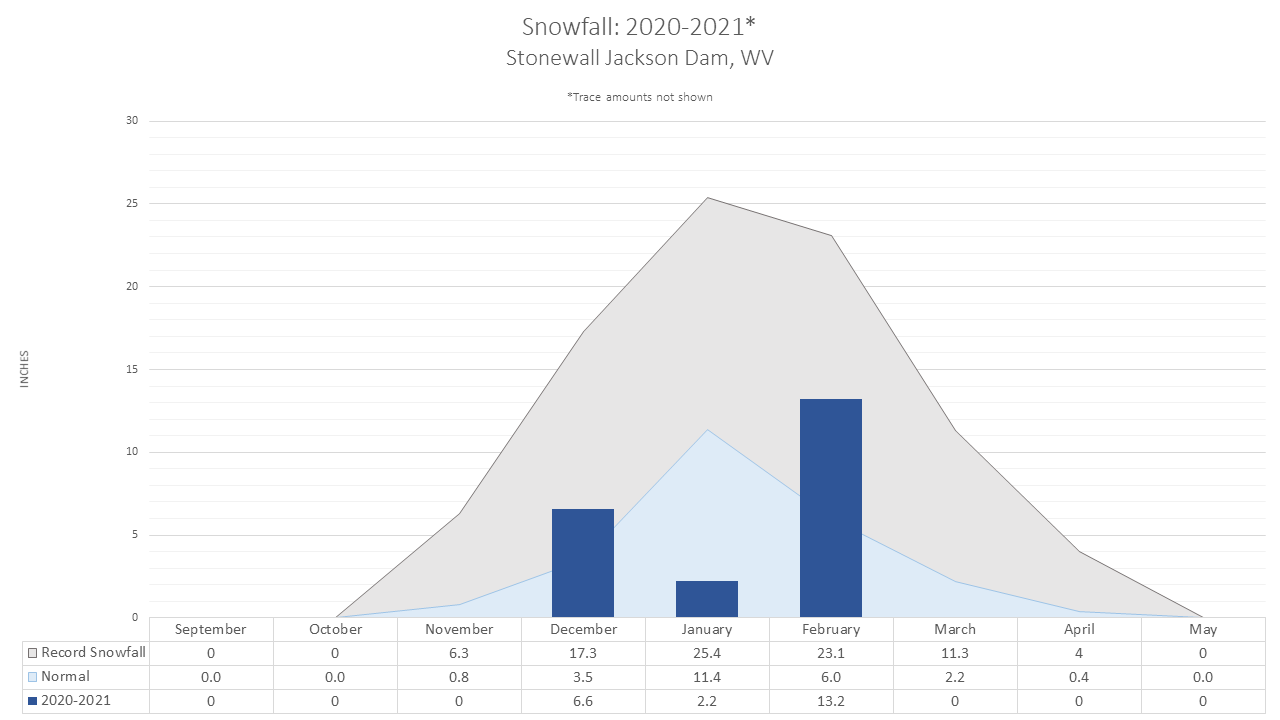
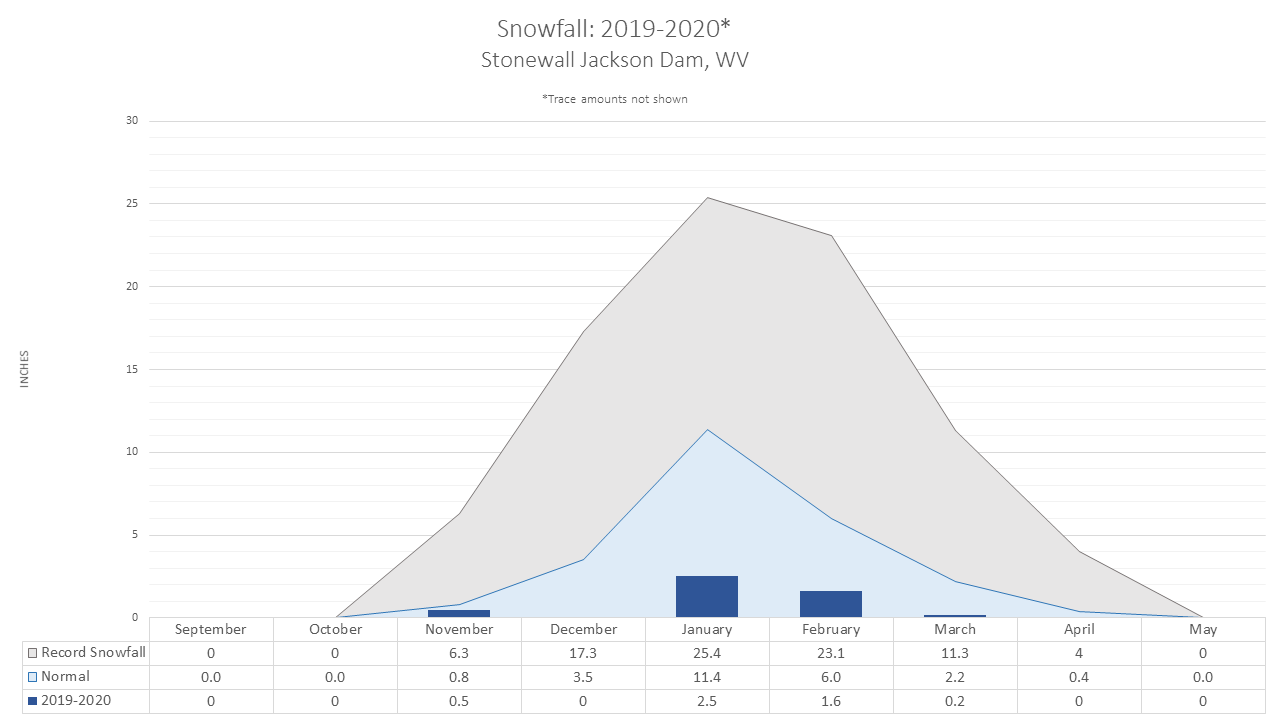
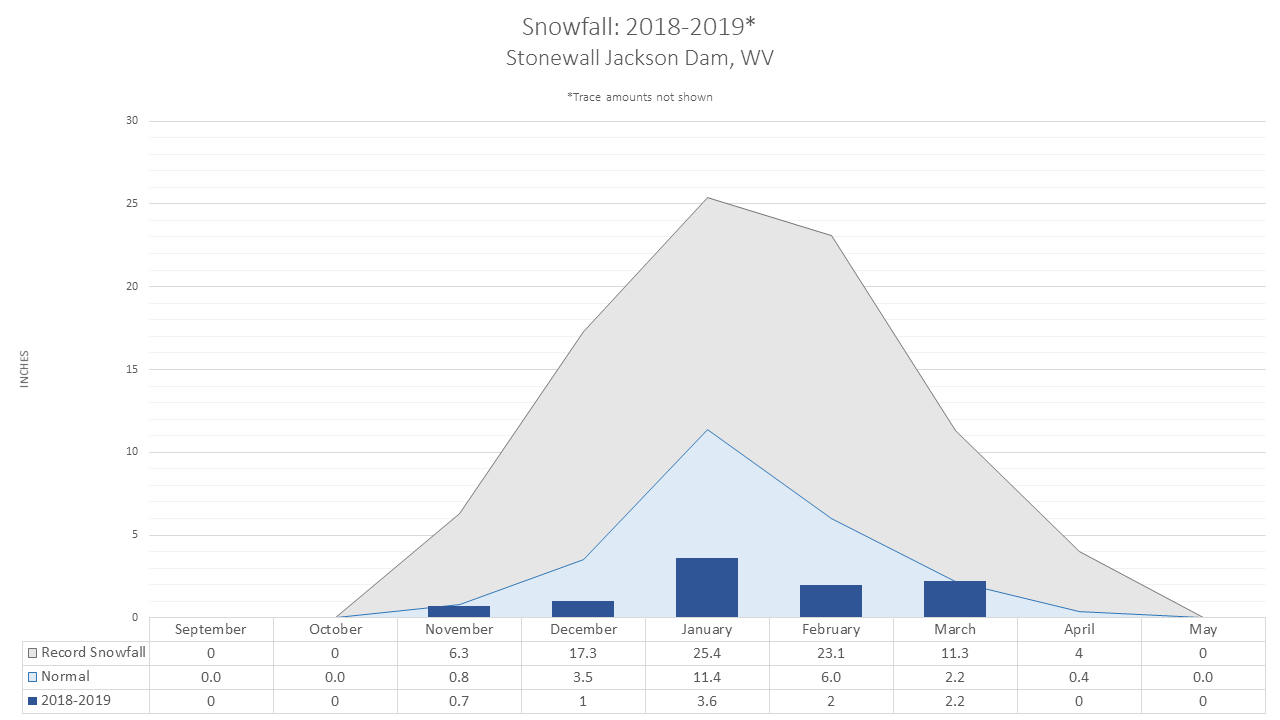
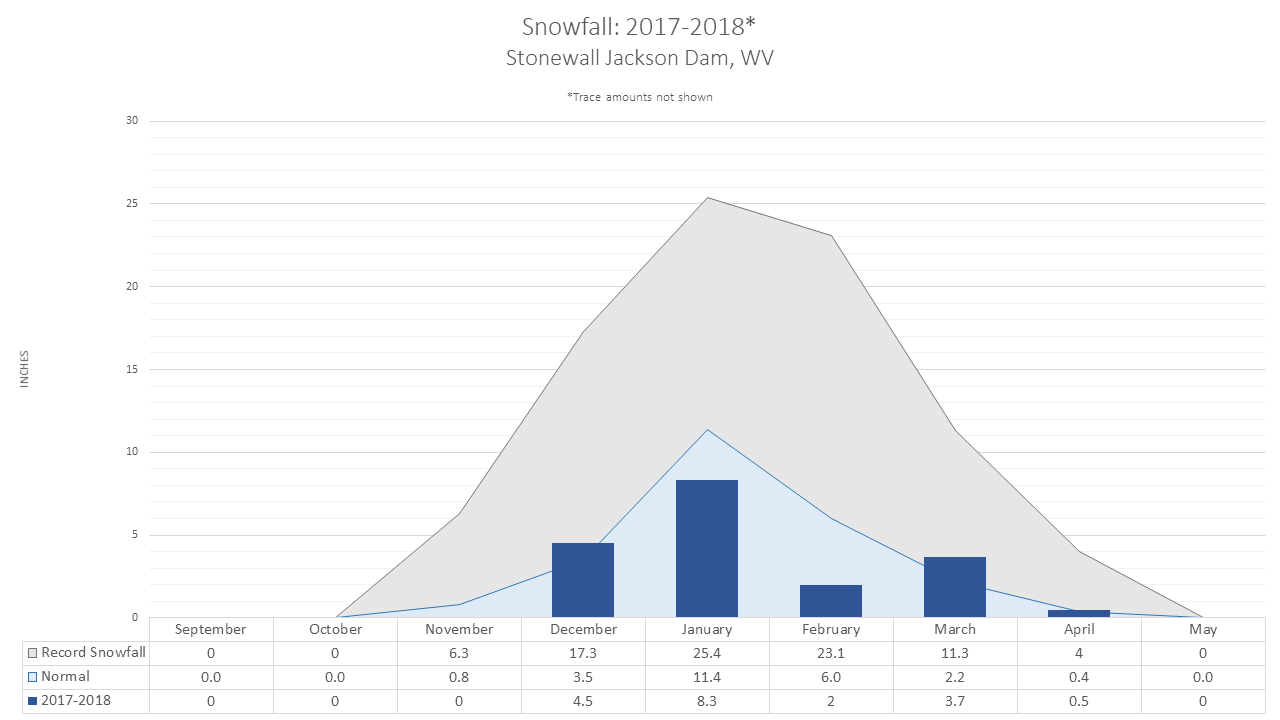
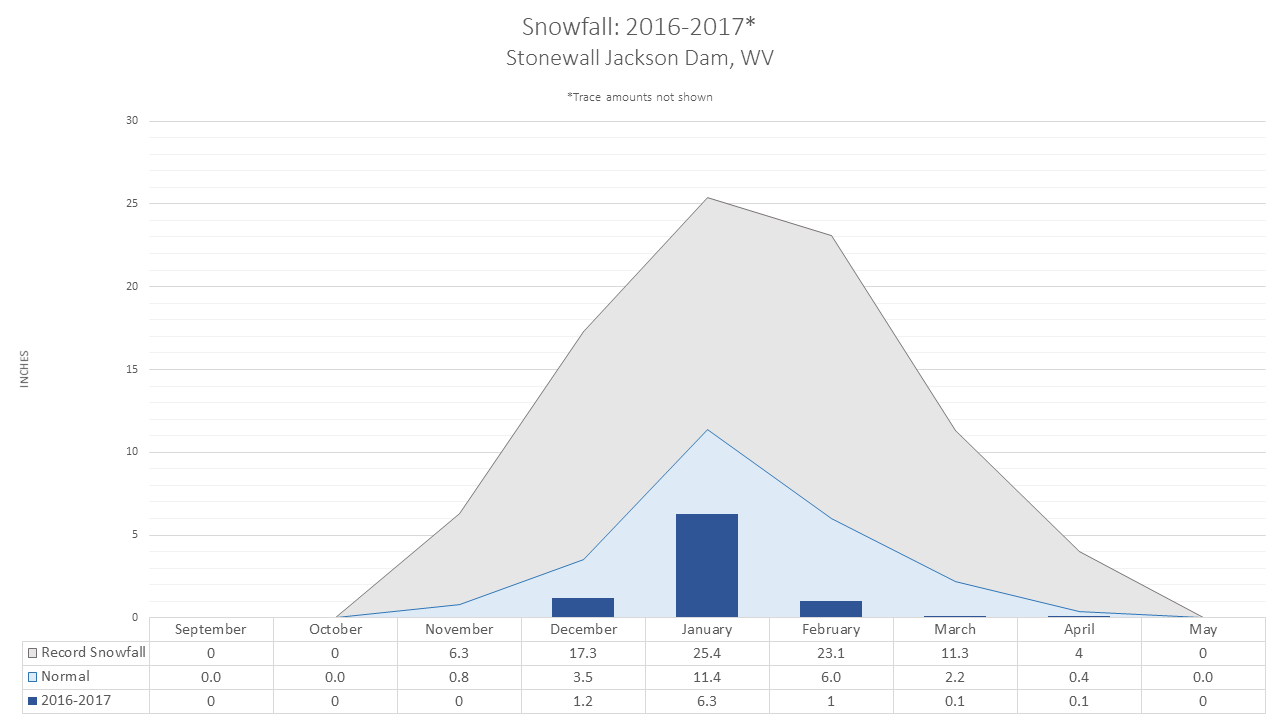
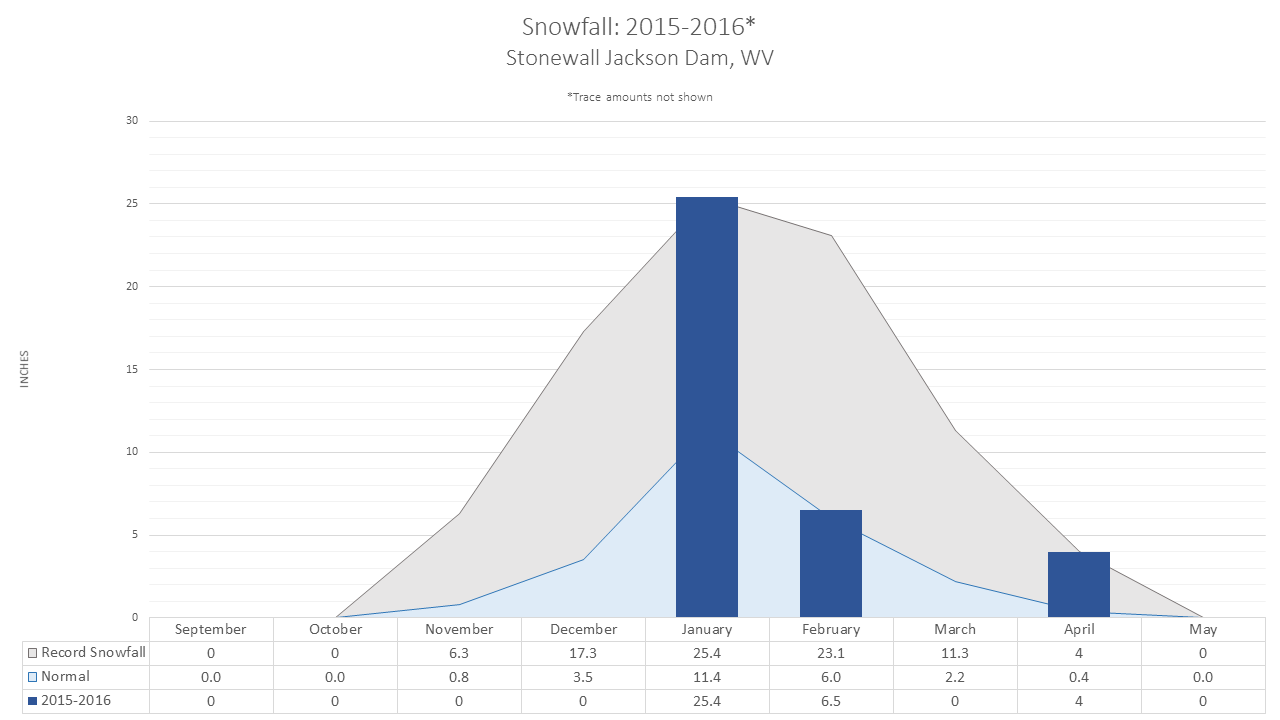
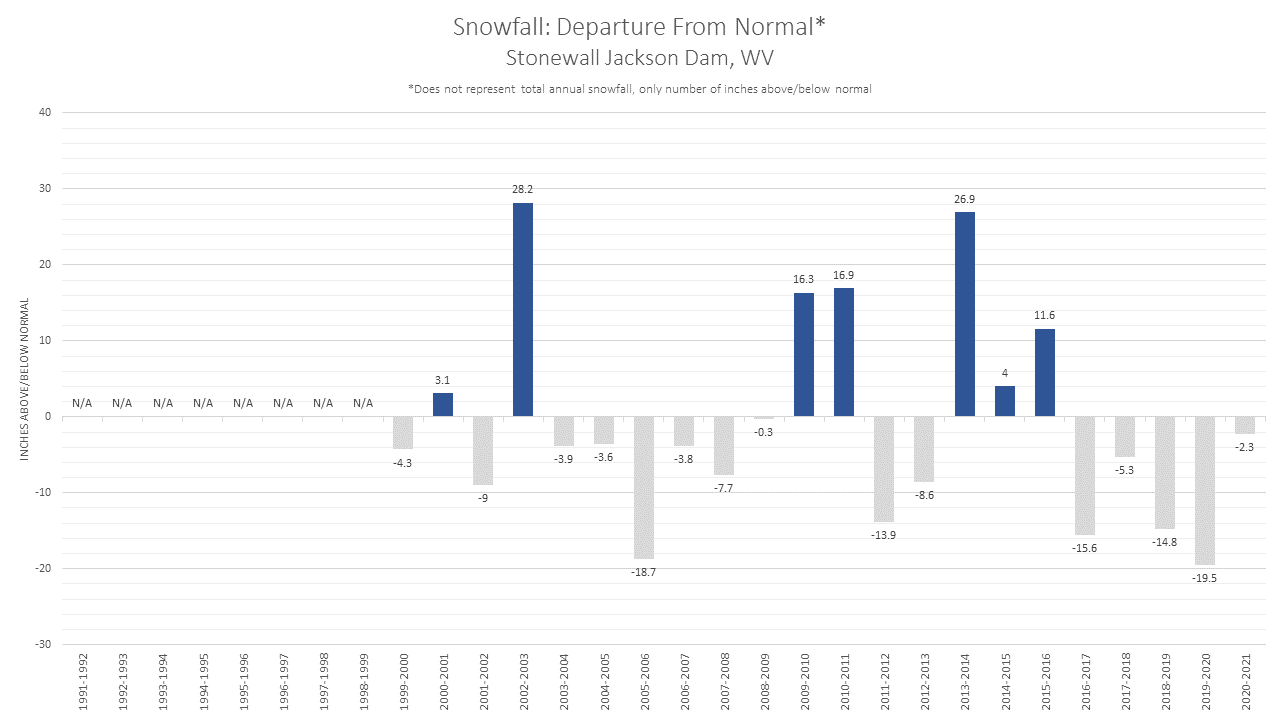
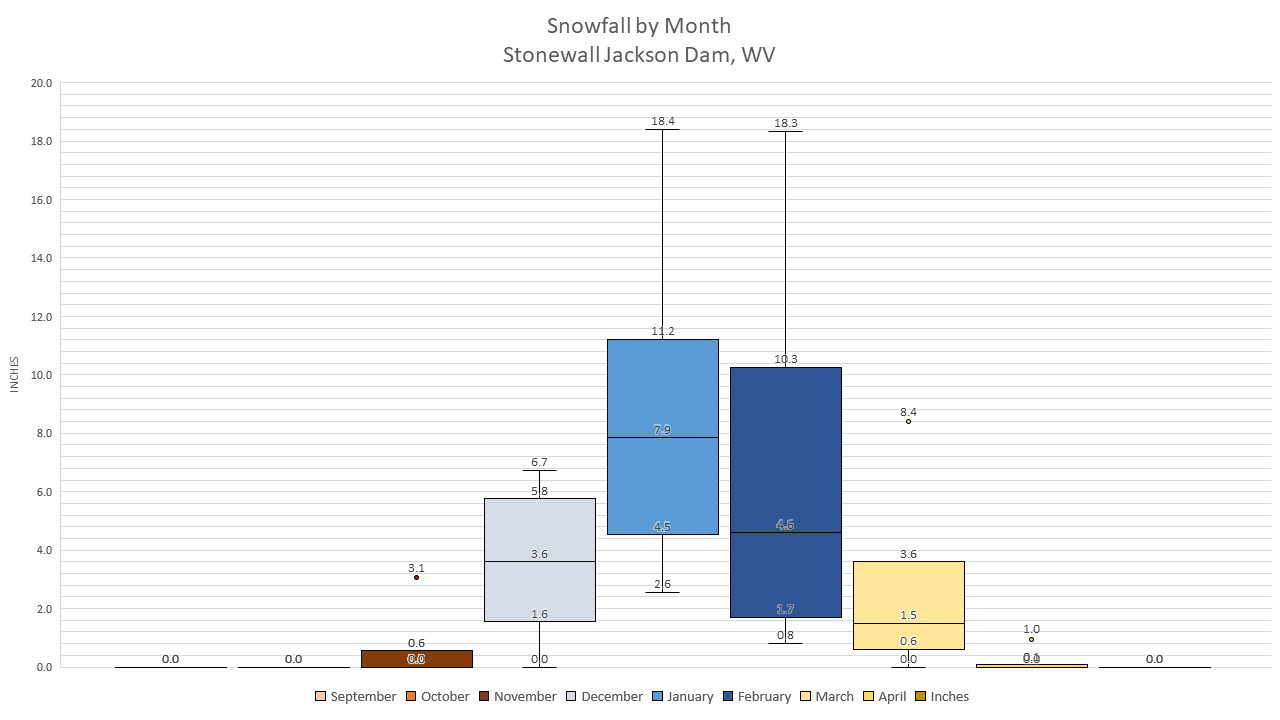
Stonewall Jackson Dam, WV |
||||||
|
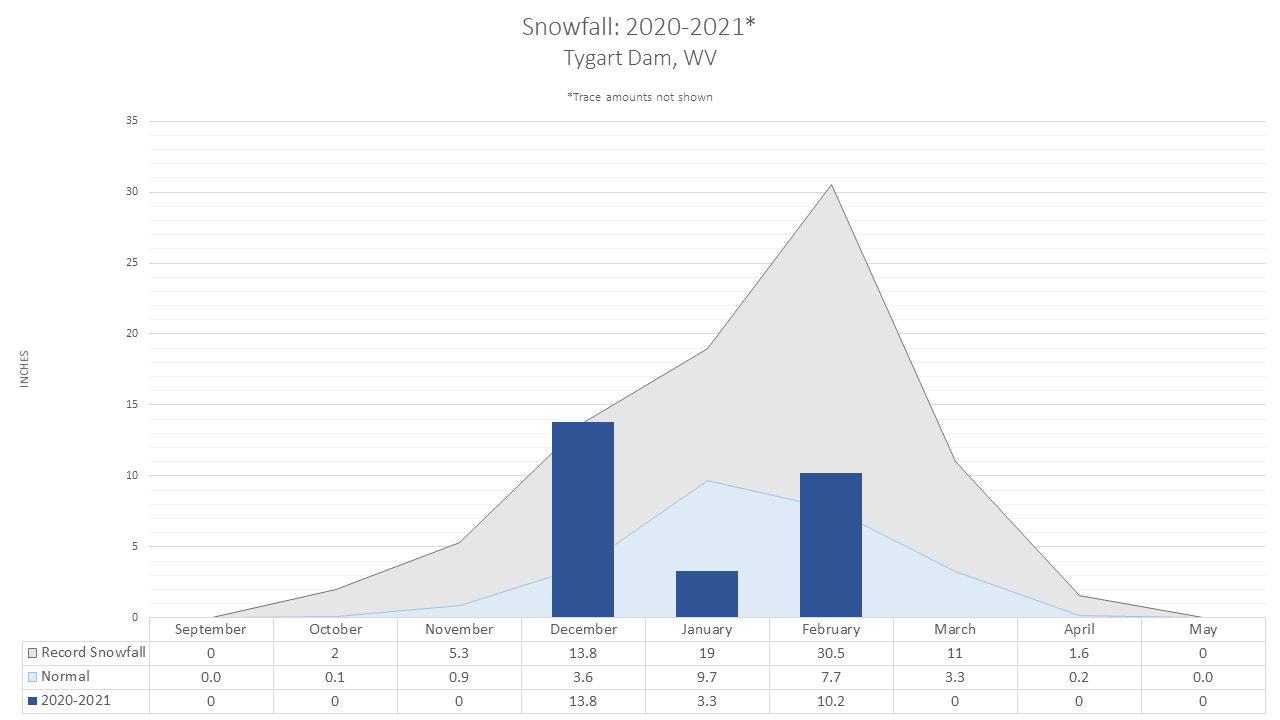
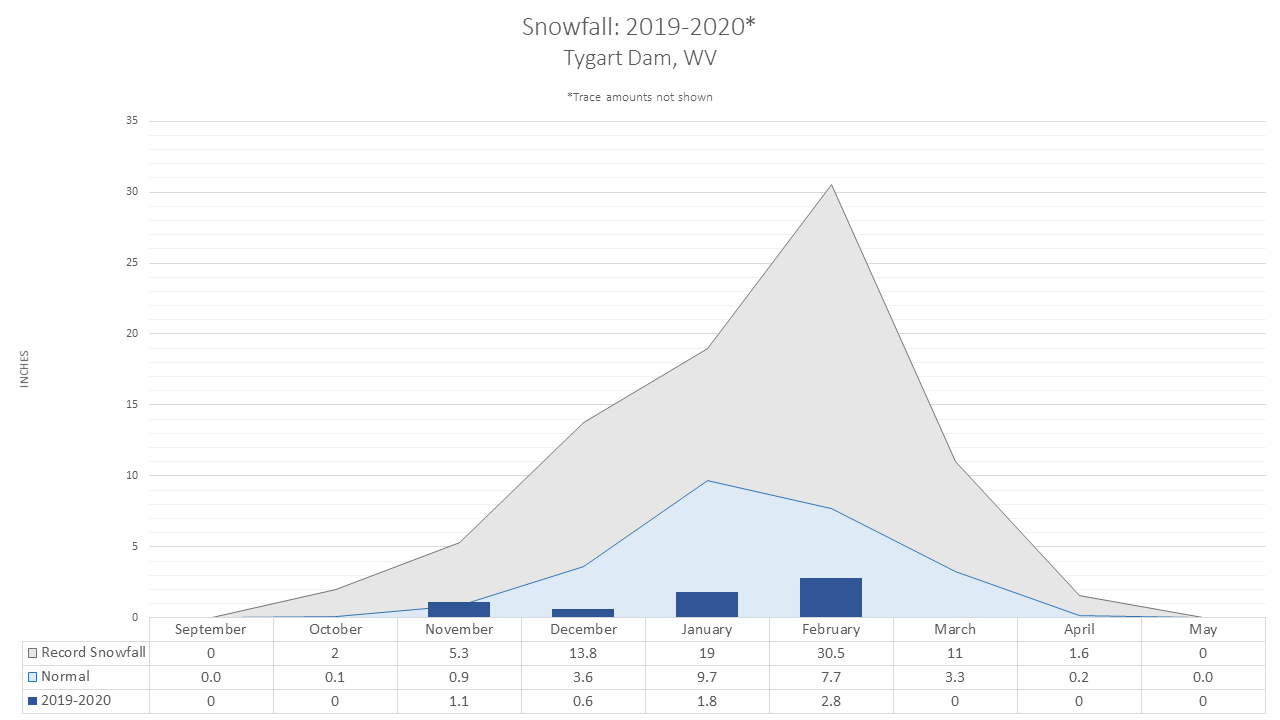
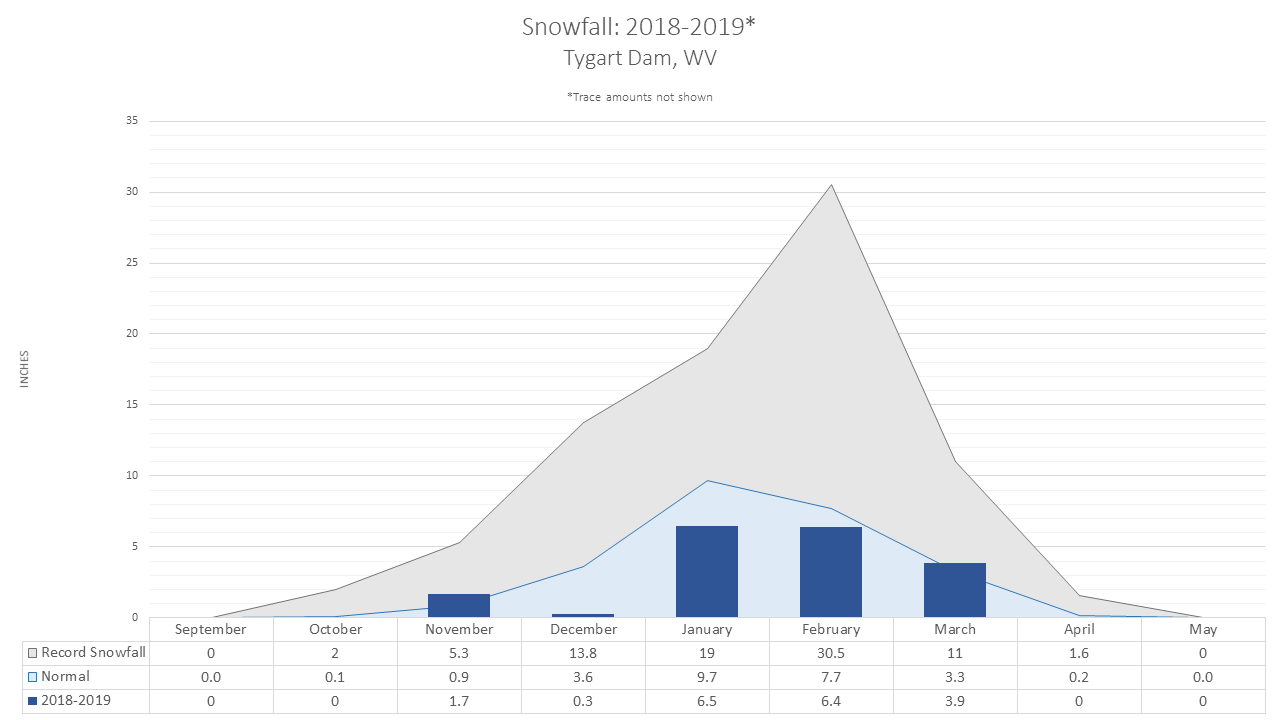
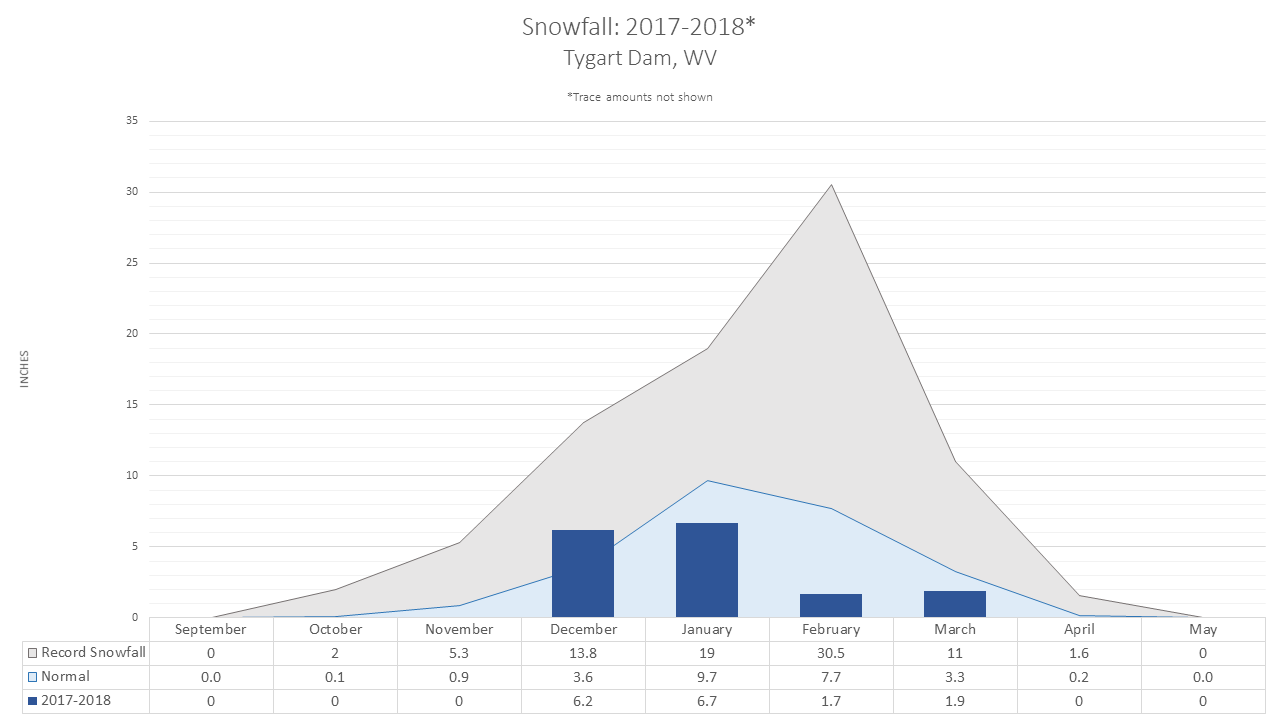
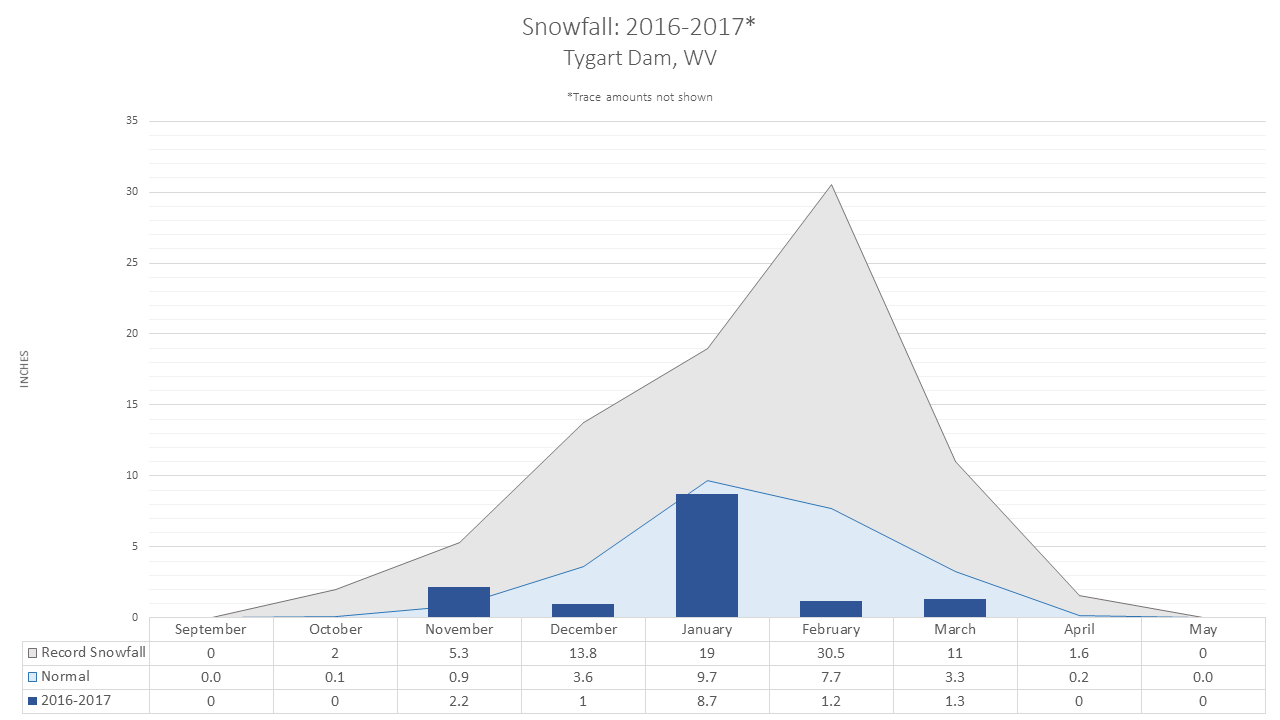
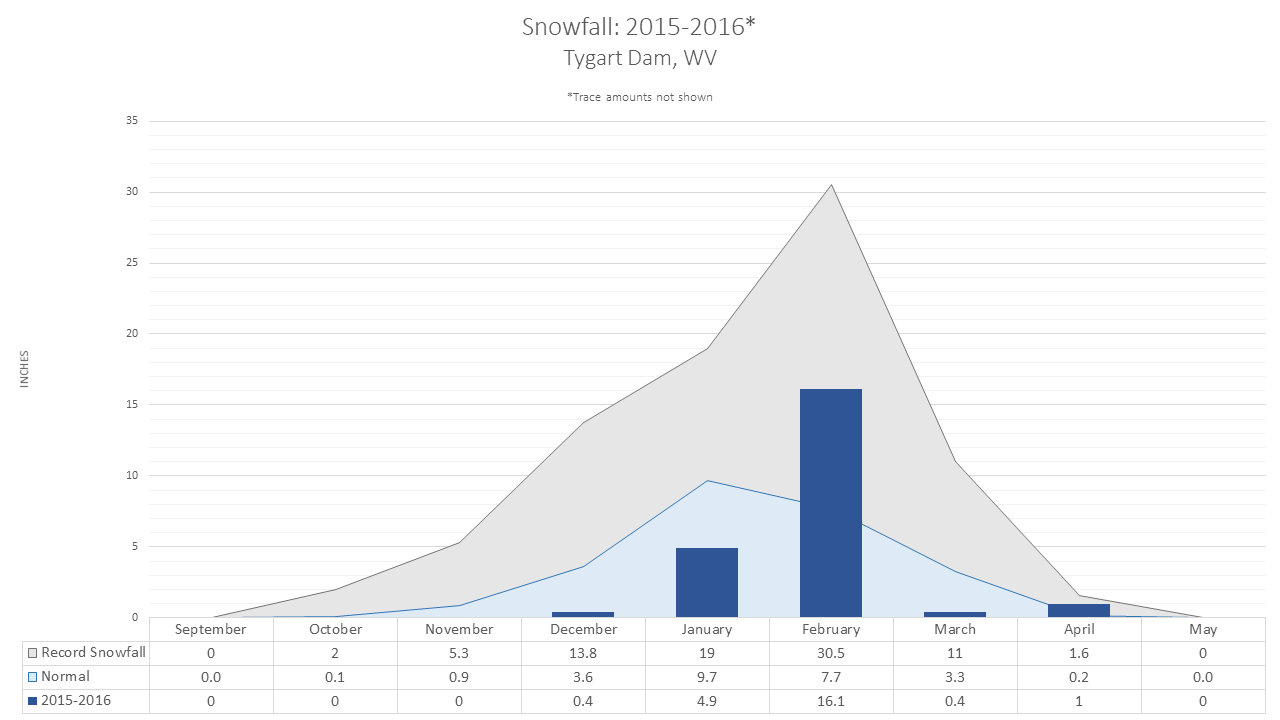
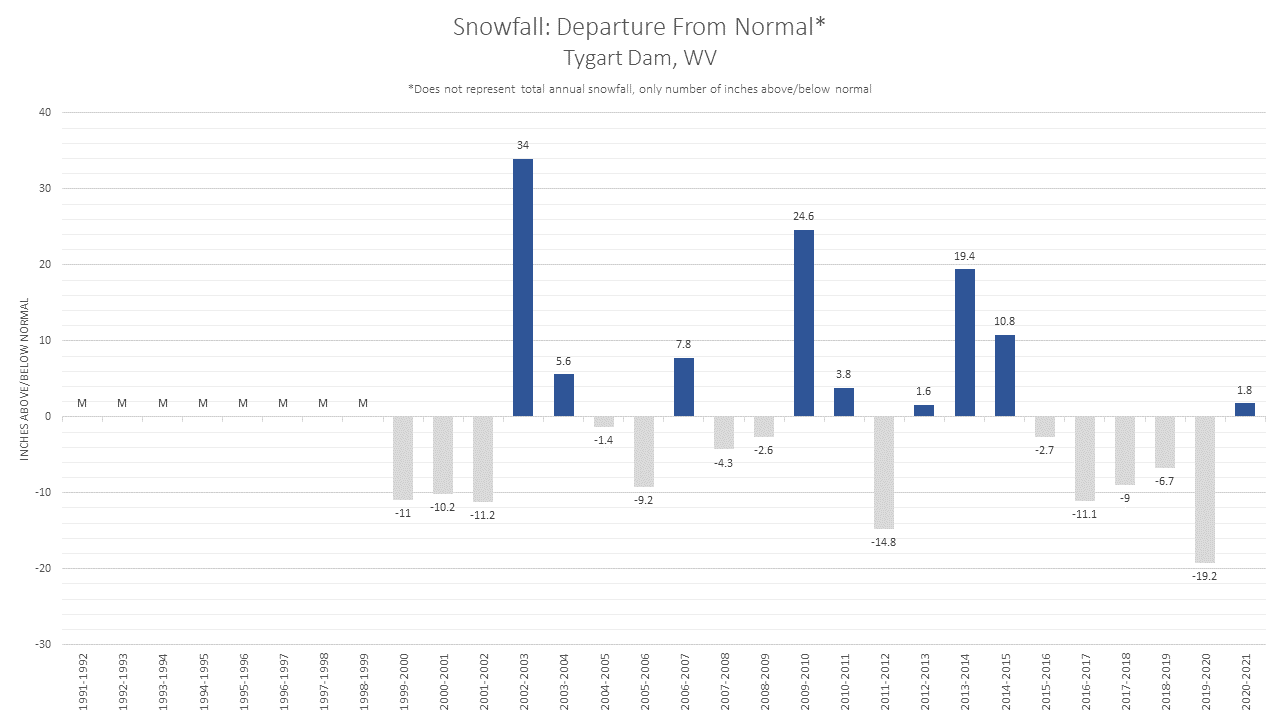
Tygart Dam, WV |
||||||
|
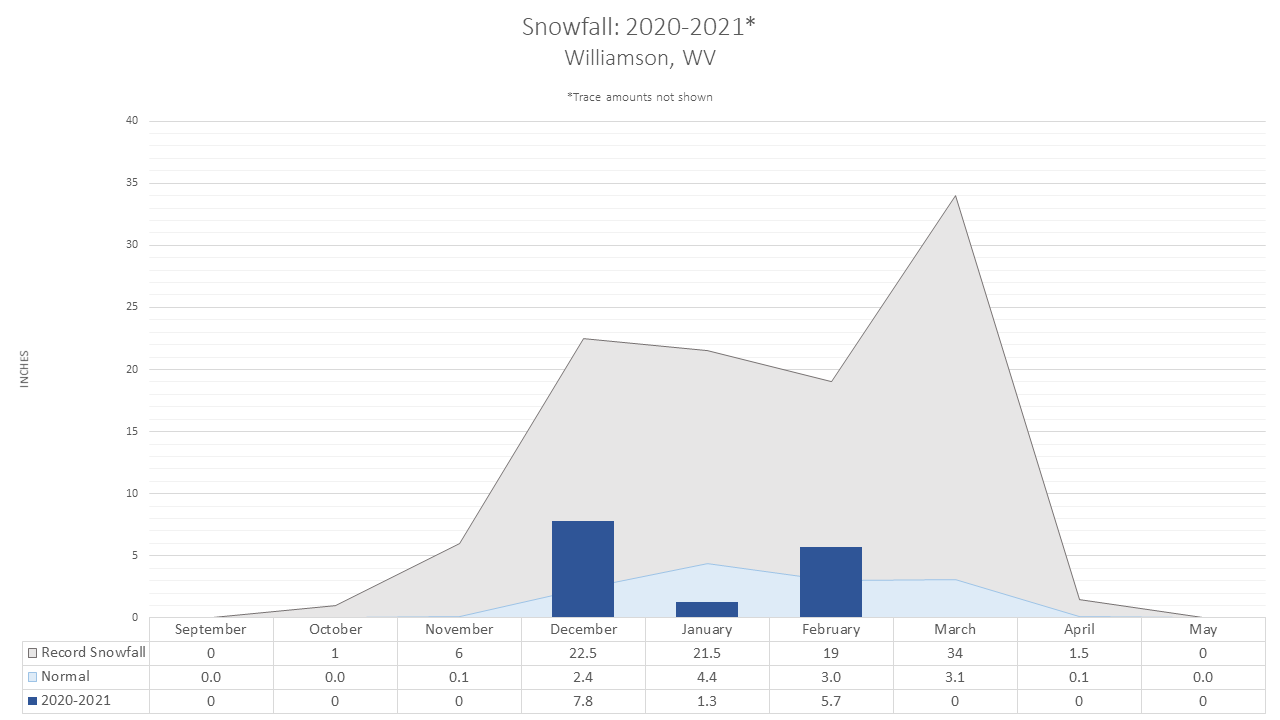
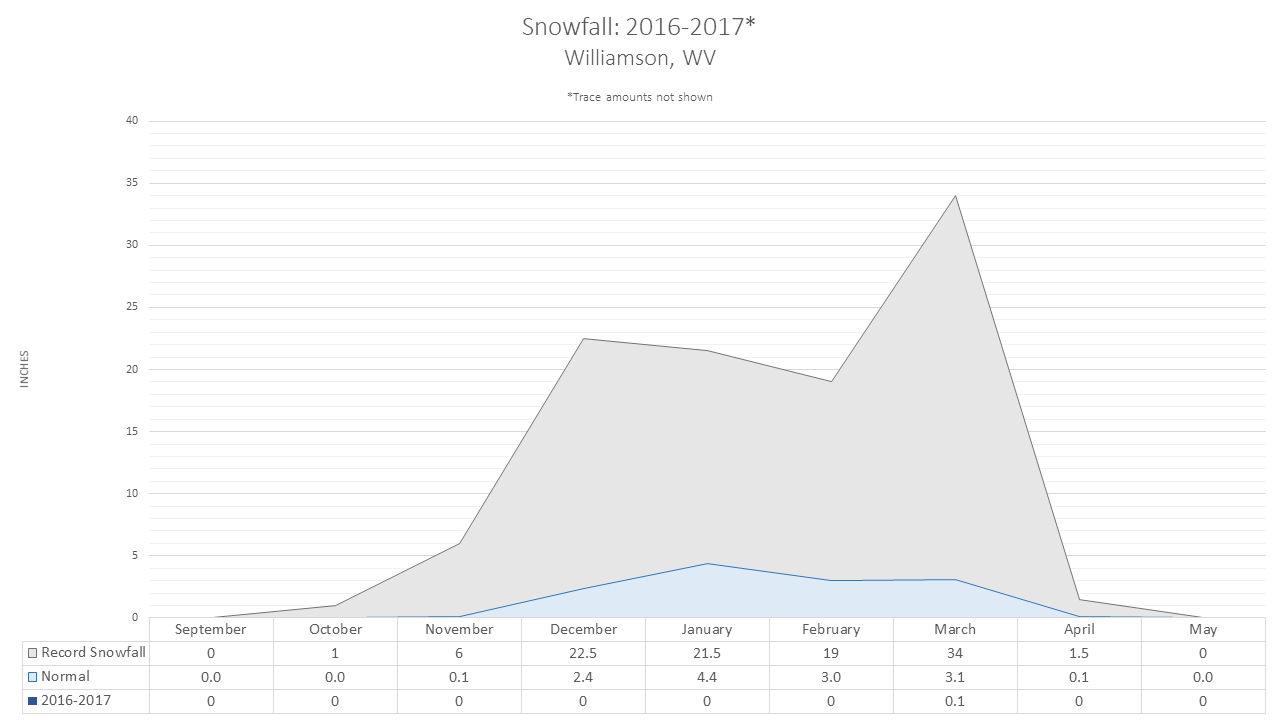
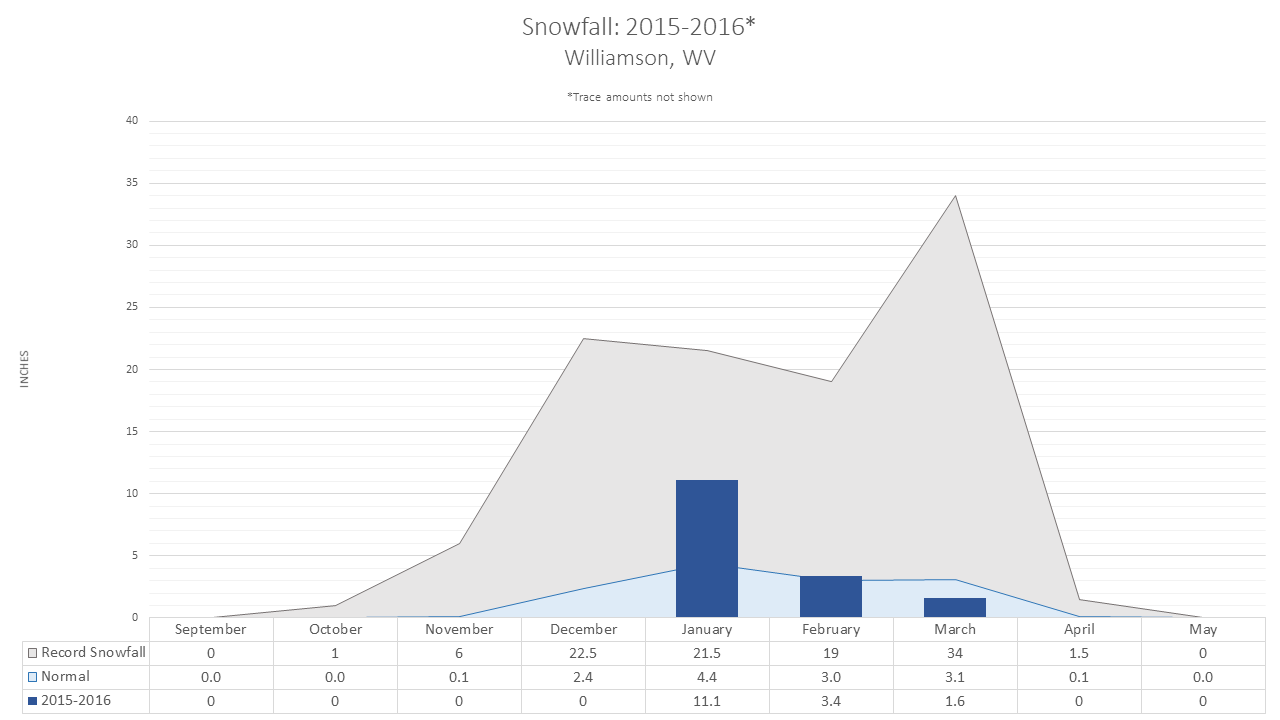
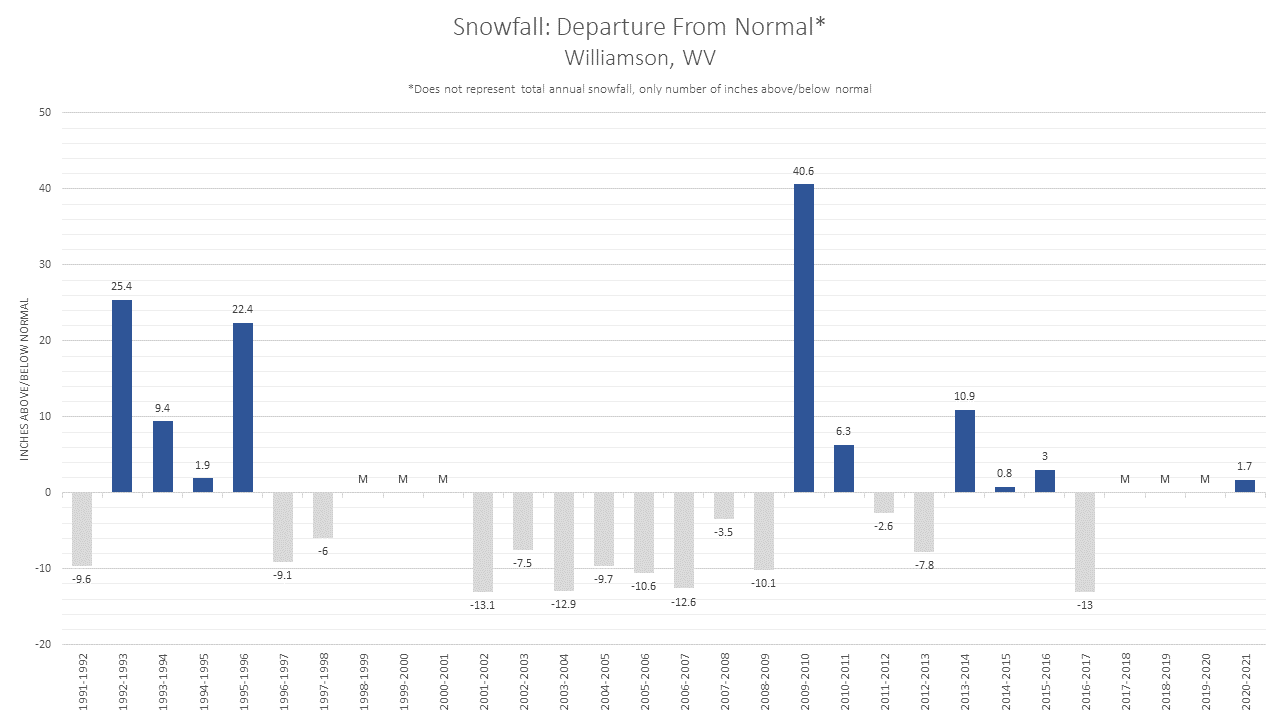
Williamson, WV |
-- |
-- |
-- |
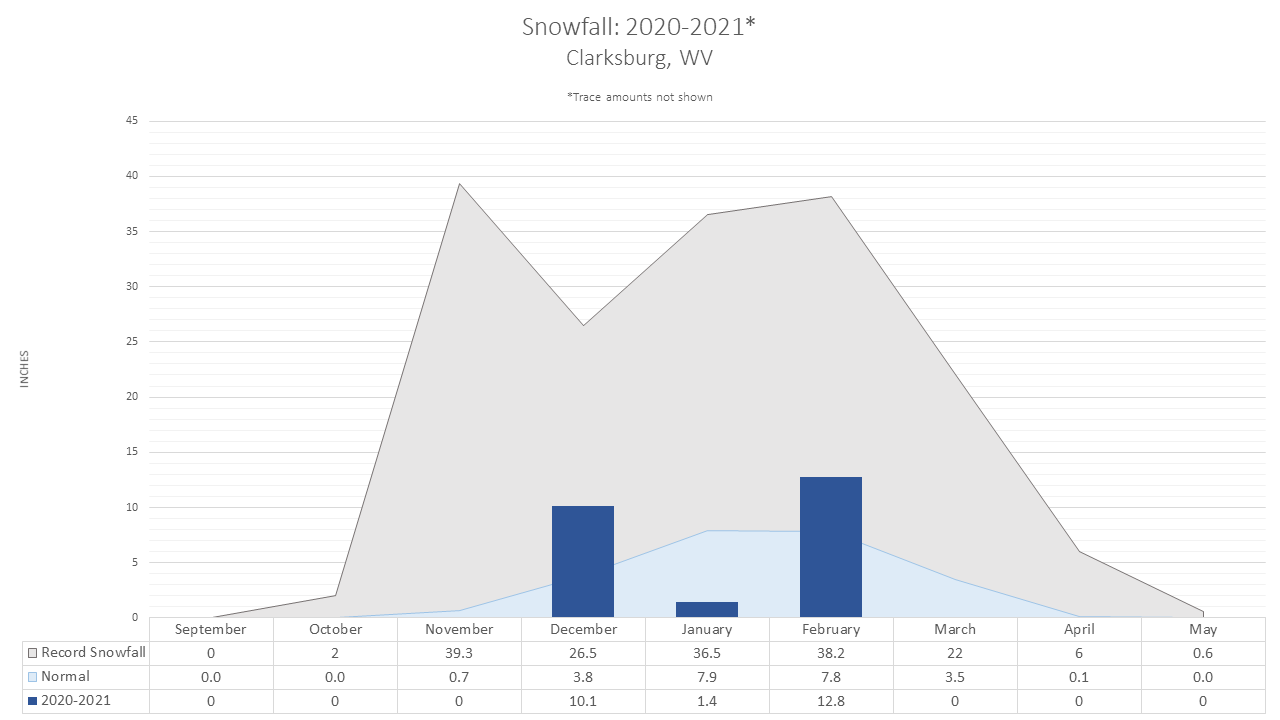
 Snowfall climatology by month has been graphed on box-and-whisker plots for each location studied. These plots differ slightly from typical box-and-whisker plots in that the whiskers are additional percentiles instead of the maximum and minimum. Figure 5, to the left, is a legend showing how to read the plots.
The box and whisker portion of the plot comes from data between 1991 and 2020. This was the climatology period of the study. Each percentile tells how much of the data falls below that number (i.e. 10th percentile – 10% of the data falls below this value, 25th percentile - 25% of the data falls below this value, median - 50% of the data is below and 50% of the data is above this value, and so forth).
Kentucky |
West Virginia |
||
|
Beckley, WV (Raleigh County Memorial Airport) Charleston, WV (Yeager Airport) Elkins, WV (Elkins-Randolph County Regional Airport) |
|||
Ohio |
|||
Virginia |
|||
|
|
|||

