A squall line moved through western portions of Charleston, WV WFO area of responsibility during the afternoon and early evening hours on Tuesday June 14 2005. The line of storms prompted 16 severe thunderstorm warnings and one tornado warning. Fourteen of the sixteen severe thunderstorm warnings verified, while there were no reports of a tornado in Lawrence County, Ohio. Wind gust upwards of 60 mph were recorded with widespread reports of trees and power lines down throughout southeastern Ohio, northeastern Kentucky, and portions of West Virginia along the Ohio River.
A negatively tiled 500mb trough strengthened as it progressed southeastward through the Great Lakes during the midday hours. An associated cold front extended from Lower Michigan south through western Tennessee. Thunderstorms developed over southern Indiana in a moisture rich, highly unstable atmosphere around 12 pm EDT. The visible satellite picture in figure one displays the initial thunderstorm development over Indiana and western Ohio that is ahead of a cold front located in central Illinois. Southwesterly surface winds funneled
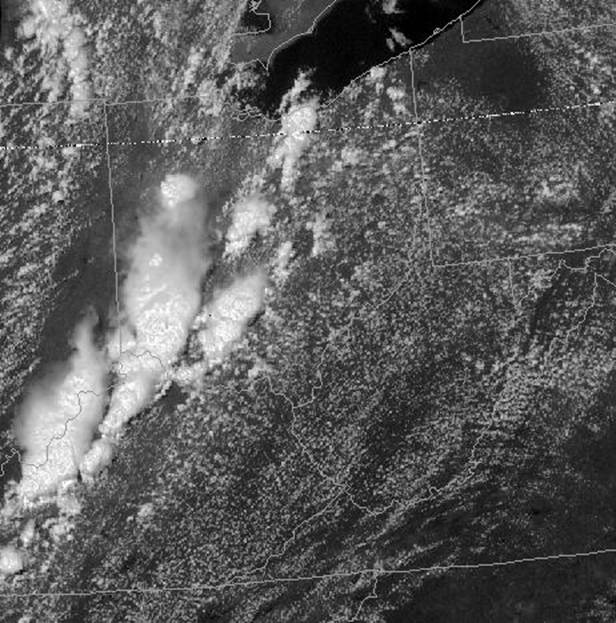
Figure 1 1815z visible picture
MSAS derived surface moisture convergence at 19Z shown in figure three supported a continued propagation eastward of thunderstorms into southern Ohio and northeastern Kentucky. Green colors are areas of moisture convergence, while pockets of blue illustrate places of moisture divergence.
Convective parameters derived from the RUC40 were moderate as illustrated in figure four lifted indexes were about -7C and surface based CAPE was slightly under 2,000 J/KG. Mid level lapse rates (not pictured) approached 7.0C/KM in the 700-500mb layer, while decent shear existed with 0-6km winds of 30-40kts.
Half degree base reflectivity was predominately used for warnings. The lighter
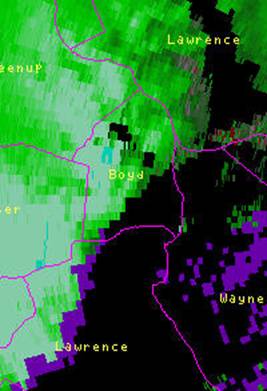
Figure 5 0.5 degree base velocity at 2054
color in eastern portions of Carter, Greenup, and Western Boyd counties are Doppler estimated winds of 55 to 60 knots. A few pixels of blue in Boyd County represent estimated winds in excess of 60 knots. Numerous trees and power line were reported down throughout northeastern Kentucky as a result of the strong winds shown in figure 5.
The half degree base reflectivity at 2149Z
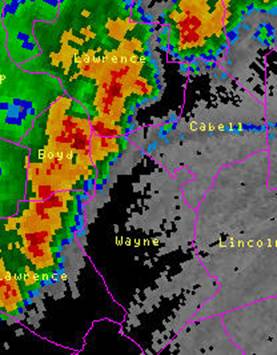
Figure 6 0.5 degree base reflectivity at 2154Z
Figure 6 illustrates low level reflectivity values approaching 68dbz as the squall line crossed the Ohio River. When the line went through the Huntington-Tri state airport (KHTS) in northeastern Wayne County a wind gust of 38 mph was reported. Additional peak wind gust are supplied in Table 1. The apex of the bow traveled farther north into Cabell County where downtown Huntington reported several large tree branches down. At closer examination, an inflow notch can be observed on the border of Lawrence and Boyd counties. This is indicative of strong winds at the surface.
| Location | Maximum wind gust and time (EDT) |
| Athens, OH | 62 mph at 346pm |
| Huntington, WV | 38 mph at 550 pm |
| Parkersburg, WV | 52 mph at 440 pm |
| Charleston, WV NWS Office | 49 mph shortly after 700 pm |
| Charleston, WV Yeager Airport | 32 mph at 723 pm |
When storms passed through the Huntington vicinity at approximately 21Z, the greatest moisture flux divergence values were centered on west central West Virginia (figure 7).
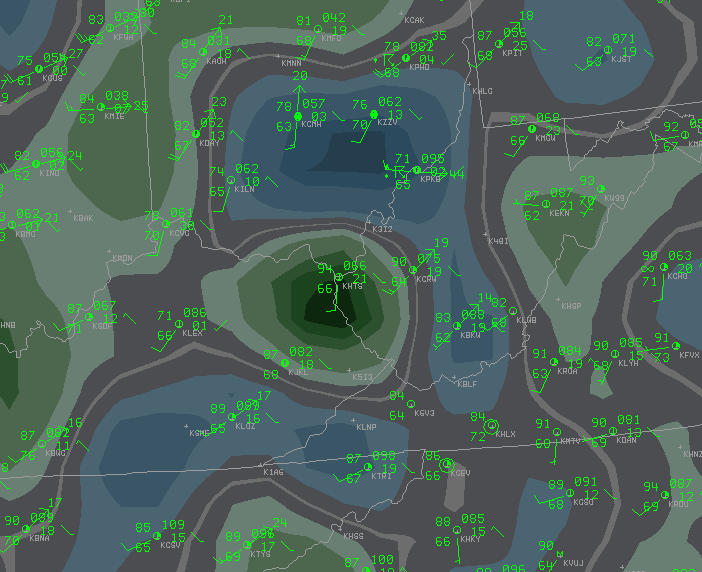
Figure 7 surface moisture flux divergence overlaid with surface observation at
Southwesterly surface winds continued to supply good inflow of moderately unstable air along the leading edge in southern West Virginia. Very warm surface temperatures near 90 degrees mixed out earlier dew points of 70 degrees, however lifted indices off the RUC40 at 21Z (not pictured) still computed numbers of -6C and surface based capes on the order of 2000 J/KG. Notice the area of moisture divergence (shaded blue) over central West Virginia. This pointed to an area unfavorable to maintain strong thunderstorms. Sure enough as the squall line continue to move east into the central West Virginia as weakening trend was noted.
Only pea size hail was reported in the Charleston, WV area during the event in large part due to a high freezing level near 15,000FT and a wet bulb zero of almost 13,000 feet. These values were computed from the 18Z RUC40 sounding over Lawrence County Ohio (figure 8)
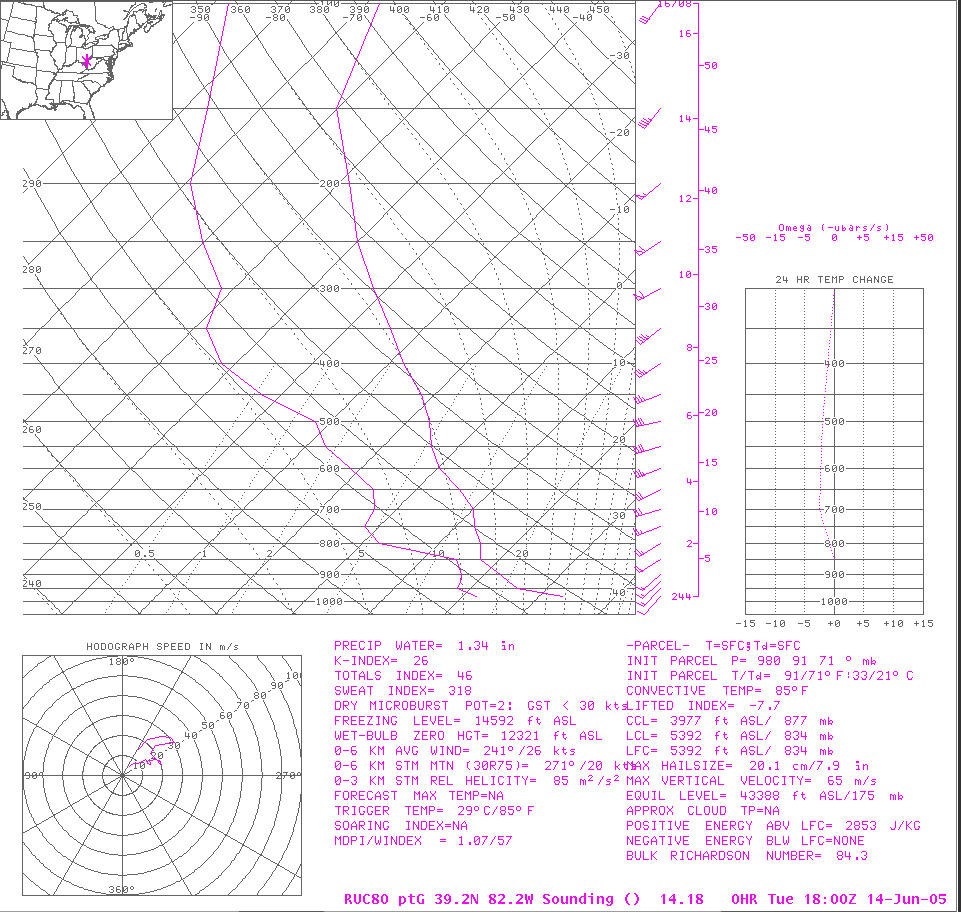
Figure 8 RUC sounding over
As the squall line continued to march eastward into central West Virginia, it got farther away from the surface front that was positioned back in western Ohio at 22Z. In addition, the 500MB short wave resided in Lower Michigan well behind the convection. When the storms were east of a line from Parkersburg to Huntington, 0.5 degree base velocity dropped significantly from 60kts down to 35kts. Yeager Airport in Charleston only reported wind gusts of 32 mph. There was a brief flare up in western Kanawha County as the anemometer at the NWS office 10 miles south of the Yeager Airport gusted to 49 mph.
A graphical display of the wind damage reports from the event is pictured below.
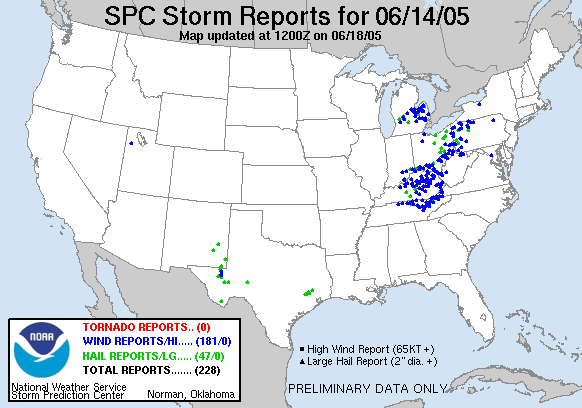
Figure 9 Summary of storm repots for the

