|
Revised March 25, 2010 Introduction NWS/OHD has derived a new gridded precipitation data set for the DMIP 2 western basins. DMIP 2 participants are to use these data to generate streamflow and SWE simulations according to the Modeling Instructions. Data Sources Gridded hourly precipitation files for the period of January, 1987- September, 2006 are produced from National Climatic Data Center (NCDC) daily and hourly Cooperative Observer (COOP) stations and SNOTEL data. The station data and metadata can be found at http://www.ncdc.noaa.gov/ and http://www.wcc.nrcs.usda.gov/snow/ The table in the link below provides a list of the stations used to derived the precipitation grids. Table 1 (March 25, 2010 Note: this table is being revised) Codes to Display Precipitation and Temperature Data We have developed kml codes to display the DMIP 2 gridded precipitation and temperature data in Google Earth. These codes and documentation are available for use by DMIP 2 participants on the following ftp site: ftp://hydrology.nws.noaa.gov/pub/dmip2/Hydro_Data/western_basins/precip/ The file name is: xmrgtokml.dmip2.tar.gz Overview of Derivation Procedure 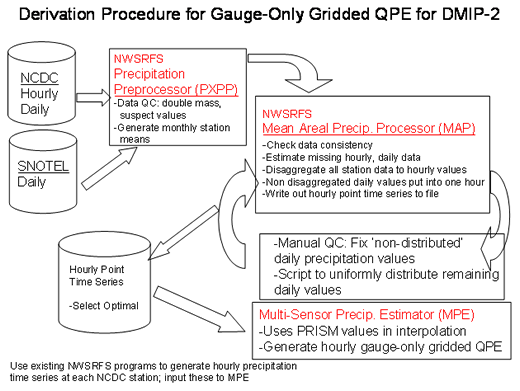
The gridded Quantitative Precipitation Estimates (QPE) values were derived using standard NWS algorithms as shown in Figure 1. More documentation for each of these programs and steps is available via the web links below. The first step involves analysis of the raw NCDC and SNOTEL data using the Precipitation Preliminary Preprocessor (PXPP) program (Anderson, 2002; Smith et al., 2003). The primary purpose of this program is to relate stations that have different periods of record. PXPP also generates long term monthly station means that are used to estimate missing data in mountainous areas. PXPP is also used to perform double mass analysis to check for station data consistency. After PXPP is run to generate monthly means and to perform double mass analysis, the next step is to input the monthly means into the Mean Areal Precipitation (MAP) program (Anderson, 2003; Smith et al, 2003). The basic purpose of the MAP program is to generate historical time series of mean areal precipitation values for model calibration and to be used in NWSRFS ensemble forecasting. For DMIP 2, we exploit an intermediate step within the MAP code wherein complete hourly time series of precipitation are generated at all the stations. In MAP, missing hourly and monthly data are estimated using the monthly means from PXPP. Using the monthly means of each station accounts for orographic influences and other effects. To estimate missing data, the MAP program uses a 1/d2 weighting of data from the closest station in each of 4 quadrants around the station. Daily observations are time disaggregated into hourly values in the MAP program by examining the closest hourly station in each of 4 quadrants surrounding the daily station. If the MAP program cannot find hourly stations with precipitation in the 24 hours preceding the observation time of the daily station, then the entire daily precipitation amount is placed in the final hourly time series for that daily station at the observation time. For example, if a value of 116 mm was recorded for January 21 at the Lake Spaulding station (observation time 00 Z) and could not be time disaggregated, the MAP program would place the entire 116mm at hour 00Z in the hourly time series for the Lake Spaulding station. Daily precipitation observations that cannot be time disaggregated into hourly values are assigned to the hour of the observation time. These non-distributed daily precipitation amounts are subsequently flagged in the output time series. As shown in Figure 1, we use a script to uniformly time-distribute the flagged daily values over a user-defined time span, usually 12 or 24 hours. In the final derivation step, the Multisensor Precipitation Estimator (MPE; Fulton et al., 2006; Kitzmiller et al., 2006; 2007; 2008) is then used to create hourly gridded precipitation fields using the point hourly time series generated by the MAP program. While designed to optimally combine radar, rain gauge, and satellite estimates of precipitation, the MPE program can also generate a gauge-only gridded precipitation field. In this step, single optimal estimation (Seo, 1998) is used in MPE to interpolate the hourly point observations to the 4km grid. MPE then performs a bias correction using the Parameter-elevation Regressions on Independent Slopes Model (PRISM) monthly precipitation climatology grids (http://prism.oregonstate.edu/). We use PRISM grids derived at the 800m grid scale for the period 1971-2000 (Daily et al., 2008). The coordinate system used here is the Hydrologic Rainfall Analysis Project (HRAP) (Greene and Hudlow, 1982). Data Description (Revised March 25, 2010)
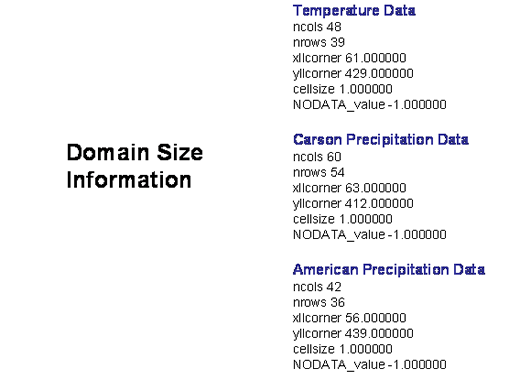
The precipitation data are arranged on the DMIP 2 FTP site in two grids: one covering the North Fork of the American River and the other grid covering the East Fork of the Carson River basin as shown in Figure 2. Please note that the temperature data grid covers both basins. Also, please note that all three grids (two precipitation grids and one temperature grid) cover different geographic extents as shown in Figure 3. However, the same coordinate system is used throughout all the grids. 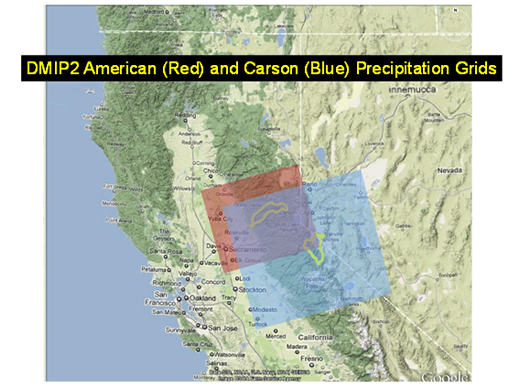
A PowerPoint file is available to illustrate the spatial coverage of these precipitation and temperature data relative to the basin boundaries. Click here to download the file. We will soon provide a Shapefile of the HRAP cell centers converted to latitude-longitude coordinates. Please check back soon for this. Accessing the Precipitation Data Each hourly file is saved in XMRG format. Files from different years are stored in different directories. Click here to obtain data from the ftp site. Partcipants only need to download the data for the years specified in the Modeling Instructions. Participants are advised to see the link below on reading and referencing the data files: Information on how to read and georeference xmrg files Quality Control of the Precipitation Data We followed standard NWS data quality control procedures to prepare the precipitation data for use. First, double mass analysis techniques were used to correct cases of data inconsistencies caused by man-made influences (Anderson, 2002; Smith et al., 2003). Corrections were applied to the precipitation time series when the inconsistencies corresponded to documented station moves or changes in equipment. In all cases, earlier period data were corrected to correspond to the accumulation rates in the later period. The consistency corrections were derived using the PXPP program in Figure 1. In addition, the NCDC daily data were manually examined month-by-month to detect and correct obvious errors. In some cases, we identified and fixed obvious cases in which the observed precipitation was listed on the wrong day. In many other cases, we noticed that the data recorded in the NCDC published monthly paper records differed from the data values downloaded from NCDC. For example, there were many cases in which a daily precipitation value was identified as a missing value of total accumulation (asterisk *) in the published NCDC paper records. However, the code in the actual data downloaded from NCDC was incorrectly set to a simple missing value (-999) or a value of zero. Thus, in some cases there is a mismatch between the values shown in the published NCDC paper records and the data provided to the user. For example, Figure 4 shows two cases for the Lake Spaulding NCDC daily precipitation gauge. On Jan 21, the NCDC published records show that there was an observed precipitation value of 4.59 inches. The asterisk (*) symbol on the preceding days indicates that the 4.59 inches is actually an accumulation over the period from January 18 through the 21st (red outline). Similarly, the value of 5.80 inches on January 26 should be distributed over the period from January 24 through the 26th (blue outline). The asterisk (*) should be represented numerically in the data as a value of -998. However, in this case, the value of -999 is present in the data shown in Figure 5, indicating a simple missing value to be estimated by the MAP program. The correct value of a missing accumulation is -998. 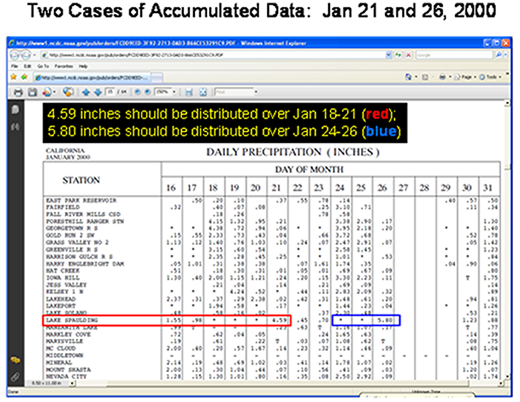
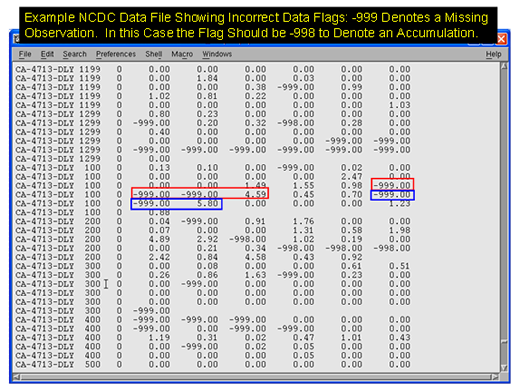
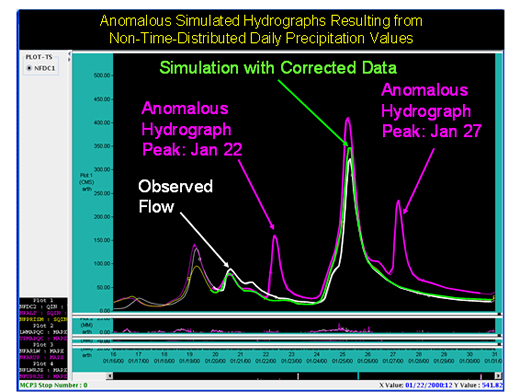
In this particular case, rather than correctly trying to distribute the 4.59 inches and the 5.80 inches over the preceding days, the MAP program will retain these values and instead estimate missing precipitation values for January 18-20 and January 24-25 from surrounding stations. Moreover, the values of 4.59 inches and 5.80 inches cannot be time distributed into hourly values. As mentioned before, in such cases the MAP program will place the entire daily precipitation amount into one hour in the final station hourly time series. Using such erroneous values in station time series will result in anomalous precipitation ‘bull’s eyes’ as shown in Figure 6 and anomalous hydrograph peaks shown in Figure 7. To correct such errors, we manually examined the data for stations in and nearby the basins on a month by month basis. Incorrect values of -999 values were changed to -998. Such corrections resulted in more reasonable simulated hydrographs as shown by the green trace in Figure 7. If after manual data quality control, the MAP preprocessor still cannot time distribute a daily precipitation observation into hourly values, then the daily value is flagged in the hourly output time series. We then use a script to read the hourly time series and uniformly time-distribute all flagged values over a user-defined time span as shown in Figure 1. 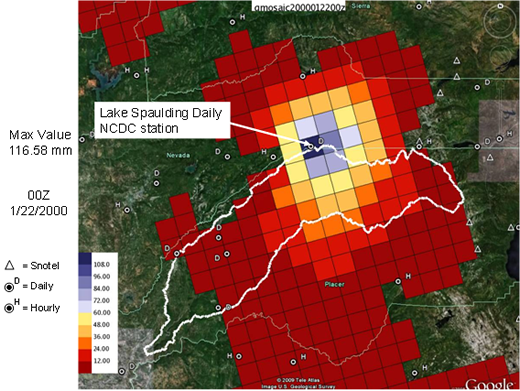
Documentation NWSRFS Calibration MAP Program: NWSRFS Calibration PXPP Program: References Anderson, E.A., 2002. Calibration of Conceptual Hydrologic Models for Use in River Forecasting, NWS publication available at: Daly, C., Halbleib, M., Smith, J.I., Gibson, W.P., Doggett, M.K., Taylor, G.H., Curtis, J., and Pasteris, P.P., 2008. Physiographically sensitive mapping of climatological temperature and precipitation across the conterminous United States. International Journal of Climatology, DOI: 10.1002/joc.1688 Fulton, R., Ding, F., Guan, S., 2006. Automated Real-Time Gauge Quality Control Tools in NWS Hydrological Operations, Enhanced Multisensor Precipitation Estimator and Nowcaster, 20th Conference on Hydrology in January 2006, April 2006 Kitzmiller, D., S. Van Cooten, K. Howard, C. Langston, J. Zhang, H. Moser, R. Kuligowski, D. Kim, Y. Zhang, and D. Riley, 2006. A comparison of evolving multisensor precipitation estimation methods based on impacts on flow prediction using a distributed hydrologic model, Preprints 22nd Conference on Hydrology, New Orleans, Amer. Meteor. Soc., P3.4, January 2006 Kitzmiller, D., F. Ding, S. Guan, and C. Kondragunta, Sources of NEXRAD and multisensor precipitation estimates and their functional characteristics., Preprints, World Environmental and Water Resources Congress 2007, Tampa, ASCE/EWRI, January 2007 Kitzmiller, D., F. Ding, S. Guan, D. Riley, M. Fresch, D. Miller, Y. Zhang, and G. Zhou, 2008. Multisensor Precipitation Estimation in the NOAA National Weather Service: Recent advances, Preprints, World Environmental and Water Resources Congress 2008, Honolulu, ASCE/EWRI., January 2008 Seo, D.-J., 1998. Real-time estimation of rainfall fields using rain gage data under fractional coverage conditions. Journal of Hydrology, Vol. 208, 25-36. Smith, M.B., Laurine, D.P., Koren, V.I., Reed, S.M., and Zhang, Z., 2003. Hydrologic Model Calibration in the National Weather Service. In: Calibration of Watershed Models, Water Science and Application 6. Duan et al., Eds. AGU Press, Washington D.C., 133-152. |
|
Main Link Categories: Home | HL | OHD | NWS |

