Robert W. Maxson1, Milan W. Allen1,
Timothy L. Szeliga1
theta - Image Classification by Comparison of Angles Created
Between Multi-Channel Vectors and an Empirically Selected Reference Vector
Introduction
NOHRSC captures AVHRR data
directly from the NOAA polar orbiting satellites. The 10-bit integer transmission
format is translated to 16-bit as each individual band is extracted. These
data are geometrically corrected, calibrated to percent albedo and temperature,
navigated to find earth location and reprojected to a 30 arc-second latitude/longitude
grid. Full resolution GOES (GVAR formatted) data are purchased from a private
vendor and acquired over a dedicated T1 line. These data are navigated,
calibrated, and converted to McIDAS area format. GOES-East
and GOES-West visible data are calibrated to
albedo. Infrared data are calibrated to temperature and resampled to match
the 1 KM resolution of the visible data using an inverse distance function.
All bands are reprojected to a 30 arc-second latitude/longitude grid.
Multi-spectral scanners, such as those carried on
board the NOAA polar orbiting (AVHRR) and geostationary (GOES) satellites,
image the earth's surface by sampling multiple electromagnetic spectrum
frequency bands. Depending upon the reflective or emissive properties of
the imaged surface, each band may contain information which allows analysts
to classify sub-portions of the image into spectrally distinct categories.
For example, snow may be distinguished from cloud or snow-free land may
be distinguished from water.
It is often impossible to separate one feature from another when only
a single band of the electromagnetic spectrum is examined. For example,
in the visible portion of the spectrum, both snow and clouds are essentially
white. However, when multiple bands are examined simultaneously, the discriminating
power increases dramatically.
Differences emerge which are a consequence of variations in the spectral
response across the spectrum exhibited by different materials. For example,
while snow and clouds appear to be white in the visible spectrum, the clouds
may appear much warmer in the thermal portion of the spectrum.
The ability to discriminate one feature from another depends on two
factors:
- being able to distinguish differences between each feature on the basis
of spectral response
- being able to image these features with sensors sensitive to those
portions of the spectrum in which they are spectrally distinct.
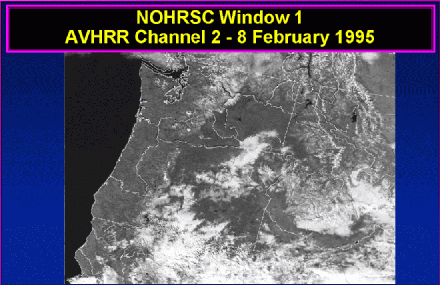
The National Operational Hydrologic Remote Sensing Center (NOHRSC)
in the Office of Hydrology of the National Weather Service has developed
an operational multi-band snow classification algorithm theta designed
to separate snow from cloud, land and water in North America. The theta
algorithm has been used successfully to map the areal extent of snow using
both AVHRR and full-resolution GVAR imagery.
theta assumes multi-band imagery as input. Each row-column coordinate
location in the image is treated by theta as a vector quantity.
The components of each vector are calibrated digital counts for the combination
of bands selected for the analysis. Presently, NOHRSC uses two classification
routines and then differences the two resultant images to map the areal
extent of snow. The first routine uses channels 3, 4, and 5 in AVHRR data
or channels 2, 4, and 5 in GOES data to form a three-space vector algorithm
to identify clouds. The second routine uses channels 1, 2, 3, and 4 in
AVHRR data and channels 1, 2, 4, and 5 in GOES data to form a four-space
vector algorithm to identify the areal extent of both snow and clouds.
Theory
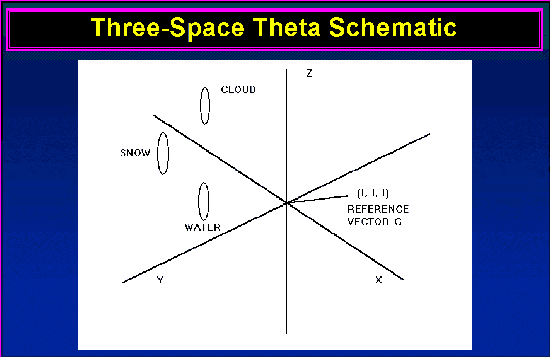
To simplify illustration, the discussion of theta
will be limited to a three-band AVHRR example. However, the theta
algorithm is extensible to n-space for any multispectral sensor. In either
case, we treat the n-band image as a ROW x COL collection of order n
vectors.
At a particular row and column location r,c in the co-registered
image,
we define vector Fr,c as (a i + b j
+ c k) and vector Gr,c as (d i
+ e j + f k).
Vector F is formed by using the values for location r,c for
AVHRR channels 3, 4, and 5 (degrees Kelvin, real values) as the vector
components. Again, the non-zero reference vector G may be positioned
anywhere in space depending on the aim of the classification analysis.
The magnitudes of vectors F and G are (a2
+ b2 + c2)1/2 and (d2
+ e2 + f2)1/2 respectively.
We express the angle between these two non-zero vectors with the following
equation:
 [1]
[1]
where the cosine of the angle between the image vector F and
the reference vector G is expressed as the dot (or scalar) product
of the two vectors divided by the product of their magnitudes. The dot
product of F and G is also a scalar and is equal to ((a
* d) + (b * e) + (c * f)). theta is then found by calculating
the arc cosine of the right hand side of the equation and converting from
radians to degrees.
Members of the same classification category in the image tend to have
similar values in each band and by extension similar theta angles.
Members of different classes will exhibit theta angles which should
align on opposite sides of a threshold angle. The theta algorithm
offers an opportunity to exploit clustering tendencies using an efficient
algorithm for excising a targeted class. The algorithm is fast enough that
near-real time configuration and execution is feasible.
It should be fairly obvious that the success of the algorithm is highly
dependent on a number of factors:
- The selection of bands for that target class. At NOHRSC the selection
of bands was based on known physical properties of snow and clouds.
- The selection of an appropriate reference vector. This too is based
largely on known properties of snow and cloulds and refined by multiple
iterations of the algorithm varying the reference point between executions.
In this example, the reference vector G was initially defined
as vector ( 1, 1, 1 ) and executed on imagery known to contain clouds.
After several empirical shifts of the reference vector, it was discovered
that the vector formed by ( 1, -1, -1 ) yielded the strongest cloud
discrimination.
Three-Space Cloud Identification Algorithm (AVHRR)
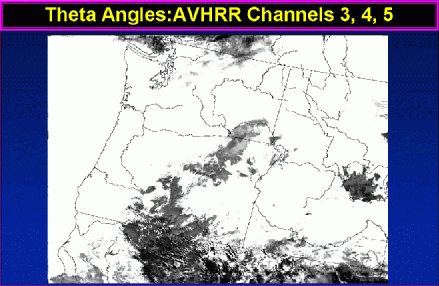
In images created using these techniques, cloud surfaces start at the
minimum theta values found in the synthetic image and end within
one standard deviation of the theta simple mean. Because clouds
are the minimum values in the image it is relatively easy to set the proper
threshold after the image is created by using graphical masking subroutines.
By creating the theta image as a real image, extremely fine adjustments
can be made in setting the single cloud, no-cloud threshold.
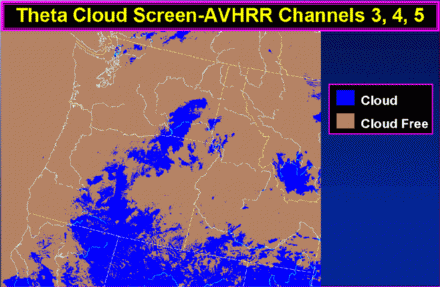
It is interesting to note that this cloud screen detects the presence
of both cirrus and cumulus clouds. Additionally, it is capable of distinguishing
cirrus clouds that overlay the snowpack, a feature that has proven to be
difficult for simple multi-spectral algorithms to resolve.
Cloud and Snow in Four and Five-Space (AVHRR)
The four and five space algorithms use visible and near-infrared data
that must be corrected for variations in solar illumination and sun angle
across each scene. Each AVHRR visible and near-infrared pixel and each
GOES visible pixel is normalized to solar noon using a simple cosine correction.
A scaling factor is calculated for each pixel by computing the cosine between
tha actual sun angle and the sun directly overhead.
As well as the differences created in the various theta images by varying
the position of the reference vector, channel combinations can be changed
to create new images. Further, the technique examined in Case 1, which
is geometrically viewed in three-space, can be extended beyond three-space
into n-space. Two combinations of AVHRR channels have been investigated
and both offer similar results.
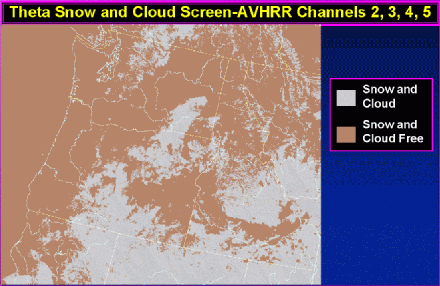
The first approach uses channels 1, 2, 3, and 4 as a four-space vector
and a reference vector (-1,1,1,1). The angle theta is calculated
using equation 1.0 which is extended into n-space. Very strong surface
separation is noted between snow and cloud and all other surfaces (water,
snow-free land). Snow and cloud, in aggregate, are represented by the lowest
values of images created using these combinations. As theta increases,
the next surface to be separated is snow free land, followed by large bodies
of water. The four channel vector combination outlined above can be used
to separate snow and cloud from all other surfaces on the image. The three-space
vector combination used above can then be applied to separate the cloud
from the snow. If desired, large bodies of water can also be segregated
by using this four channel vector technique.
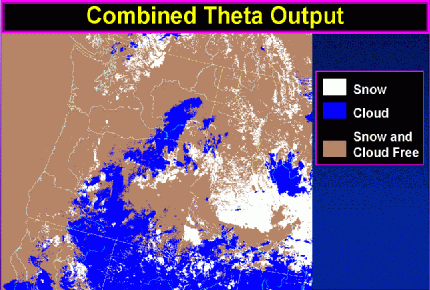
An alternate approach is very similar to the four-space procedure only
now channels 1,2,3,4, and 5 along with a reference vector of (1,1,1,-1,1)
are inserted in to the original equation. When this combination is used,
the output is nearly identical to that used with the four channel procedure
.
Comments on GOES Imagery
The method of image classification that has been described was originally
developed using AVHRR image data. Once it proved to be useful for those
data the similarities in the spectral response of AVHRR sensors and those
flown on the next-generation GOES satellites (GOES-8
and GOES-9) allowed the technique to be extended
for use on full resolution GOES data. The successful implementation of
these algorithms with GOES data permits NOHRSC to map on a near daily basis,
the extent of cloud cover notwithstanding.
Comparison of the AVHRR channels to GOES channels

Note that these crude comparsions are only applicable for next-generation
GOES satellites .
Also, be aware that channel 1 GOES data is approximately one kilometer
in resolution, which closely matches all the AVHRR channels in resolution.
The remaining GOES thermal channels have an approximate nadir resolution
of four kilometers. GOES satellites do not have a near-infrared sensor
in the .75 - 1.10 µm range, corresponding to AVHRR band 2.
Limitations
The technique described is based on the fact that
different physical surfaces will behave differently given the same solar
input and will therefore reside in different spatial regions formed in
vector space. These spatial regions can be simply differentiated by examining
the angle formed between the multiple channel pixel vector and a common
unit vector. The classification routine is less effective in the presence
of cloud shadows and under estimates the areal extent of snow in heavily
forested areas.
The NOHRSC snow-mapping algorithms are not automated and require the
analyst to set two thresholds for each image classification. Additionally,
the analyst must resolve mixed pixel regions subjectively. Further, this
routine is a daylight-only classification technique.
Conclusion
The NOHRSC snow classification routine is a subjective technique that
isolates surfaces of interest by examing the angle formed between a multi-channel
vector and a unit reference vector. It is easy to code and runs very quickly.
Two intermediate images are formed, one that isolates cloud and the other
that isolates snow and cloud in combination. The analyst must set thresholds
for each of these images. The two intermediate images are then differenced
to determine the overall areal extent of snow.
Future plans will integrate this snow mapping technique with other snow
classification algorithms to form a more automated, spatially-based snow
classification system.
Go back to top
1 National Operational Hydrologic Remote Sensing Center
Office of Hydrology, National Weather Service
1735 Lake Drive West
Chanhassen, Minnesota 55317-8582
Telephone (612)361-6610, Facsimile (612)361-6634
email: {Bob.Maxson,Milan.Allen,Tim.Szeliga}@noaa.gov
www: http://www.nohrsc.nws.gov