FAQs related to...
1. PRECIPITATION FREQUENCY DATA SERVER (PFDS)
1.1 I need help with navigating the PFDS.
PFDS provides a point-and-click web portal for precipitation frequency estimates and supplementary products. For help with navigating the PFDS, please see Section 5 of the NOAA Atlas 14 documents or send an e-mail with your question to HDSC.questions@noaa.gov.
2. NOAA ATLAS 14 PRODUCTS AVAILABLE ON THE PFDS
2.1 What NOAA Atlas 14 products are available for download from the PFDS?
For in-depth help with description and interpretation of NOAA Atlas 14 products that are available on the PFDS, please check the NOAA Atlas 14 document that is applicable for your area. All documents are available for download from the PF Documents page. NOAA Atlas 14 documents also describe the development of each product in sufficient depth to allow the knowledgeable user to understand the basis of the estimates and their scope and applicability. Documents for all volumes are similar in layout, coverage and depth, but methods used in precipitation frequency analysis may be region specific.
2.2 How do I obtain a hard copy of NOAA Atlas 14 products?
NOAA Atlas 14 precipitation frequency estimates and supplementary products are delivered entirely in a digital format; they can be downloaded from the PFDS.
2.3 Do you publish annual maximum series data used to calculate NOAA Atlas 14 precipitation frequency estimates?
The Time Series page provides access to the final, quality controlled annual maximum series (AMS) data used in NOAA Atlas 14 precipitation frequency analysis for each volume. For consistency, all AMS data are published as constrained values (even if they captured true-interval maximum amounts). Correction factors have to be applied to the published AMS data in order to estimate unconstrained values. For more information on conversion from constrained to unconstrained amounts, please see Section 4.5 of the applicable NOAA Atlas 14 document.
2.4 What is the easiest way to get NOAA Atlas 14 precipitation frequency estimates from the PFDS?
That depends on what you need:
- For a specific location, data can be retrieved from a page that displays an interactive map of a relevant state or through scraping (see answer to next question).
- Data applicable for a specific volume can be accessed: 1) via pull-down menu, 2) via web browser (see GIS Grids for more information).
- Merged estimates from NOAA Atlas 14 Volumes from contiguous US states that have NOAA Atlas 14 coverage (except Texas) can be obtained from the NOAA Atlas 14 CONUS product. More information on this product is available on the Storm Analysis page.
2.5 Can I get NOAA Atlas 14 data through web scraping?
NOAA Atlas 14 data for a selected location can be obtained through web scraping by generating the URL link with the following information: a) latitude (in decimal degrees; negative number should be entered for southern hemisphere latitude), b) longitude (in decimal degrees; negative number should be entered for western hemisphere longitude), c) type of precipitation ("pf" for precipitation or "rf" for rainfall), d) data type ("depth" or "intensity"), e) time series type ("pds" or "ams"), f) units of the estimates ("english" or "metric").
For example, if PDS-based estimates in inches are needed at 37.4000ˆ°N, 119.2000ˆ°W, the following links should be used: https://hdsc.nws.noaa.gov/cgi-bin/new/cgi_readH5.py?lat=37.4000&lon=-119.2000&type=pf&data=depth&units=english&series=pds
2.6 Why do I see inconsistencies in some NOAA Atlas 14 estimates at boundaries of different NOAA Atlas 14 volumes?
Due to a funding approach for NOAA Atlas 14 which necessitates that work is done at different times in volumes based on state boundaries, some differences in estimates between volumes at project boundaries are inevitable (see Section 5 of any NOAA Atlas 14 document). These differences are generally more pronounced for rarer frequencies and shorter durations. The estimates from different volumes have been merged and blended along volume boundaries for the use in the frequency analysis of historical storm events (see Storm Analysis page for more information).
2.7 Rainfall intensity or depth is sometimes expressed as a function of duration and frequency. Where can I find these equations and related coefficients in NOAA Atlas 14?
We don't supply those equations or coefficients for use with NOAA Atlas 14. The grids of estimates available from our site are provided as a more precise alternative to summarizing the estimates using traditional equations. We have spatial grids of the estimates for each duration-frequency pair over the NOAA 14 domain. The grids are freely available for download in a variety of common formats.
2.8 Considering the significant uncertainty associated with 500- and 1000-year precipitation frequency events, why have you decided to publish them in NOAA Atlas 14?
The 1000-yr_responses.pdf document provides the responses to an email soliciting opinions from users of NOAA Atlas 14 products on the uses and understanding of 500-year and 1,000-year estimates. We found that there is enough demand for the estimates for us to continue to publish them and that some of our users extrapolate our estimates even further. However, we do intend to expand upon our discussion of the high uncertainties of these estimates and to provide more statistical uncertainty information.
2.9 Is there a copyright protection on using NOAA Atlas 14 products from the PFDS, or can I include one in a publication without obtaining explicit permission from NOAA?
All NOAA Atlas 14 products can be freely used; we only ask that you reference them appropriately. Please note that the reference for NOAA Atlas 14 changes from volume to volume and it is indicated on the first page of the related document. For example, the reference for Volume 10 products is as follows:
Perica, S., Pavlovic S., St. Laurent M., Trypaluk C., Unruh D., Martin D, Wilhite O. (2015). NOAA Atlas 14 Volume 10 Version 2, Precipitation-Frequency Atlas of the United States, Northeastern States. NOAA, National Weather Service, Silver Spring, MD.
2.10 The NOAA Atlas precipitation frequency estimates differ from some of the other resources that I have. Which are more accurate? Which should I use?
You may want to consult your client or the governing regulatory agency with regards to which precipitation frequency resource to use. Our precipitation frequency estimates have been endorsed by the Federal Advisory Committee on Water Information's (ACWI) Subcommittee on Hydrology and are de-facto national standards.
2.11 When will NOAA Atlas 14 precipitation frequency estimates be available in my state?
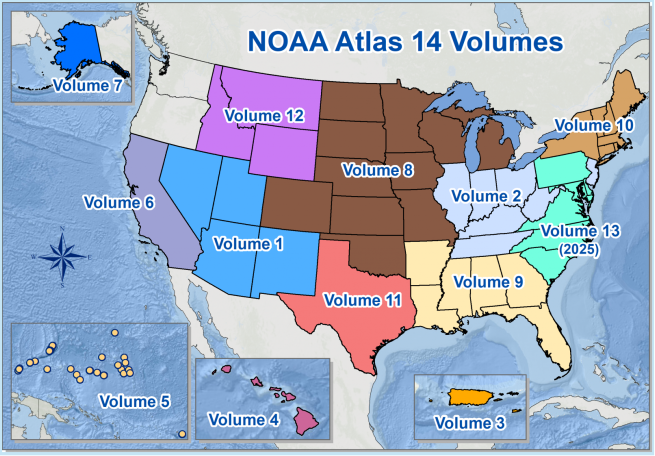
Funding for NOAA Atlas 14 work comes from external sources. For recent volumes, most of the funds have come from the Federal Highway Administration, State Departments of Transportation and U.S. Army Corps of Engineers. Typically, several states are updated as a group to reduce costs. Figure below shows the states or territories associated with each Atlas 14 volume. To date, precipitation frequency estimates have been updated for AZ, NV, NM, UT (Volume 1, 2004), DC, DE, IL, IN, KY, MD, NC, NJ, OH, PA, SC, TN, VA, WV (Volume 2, 2004), PR and U.S. Virgin Islands (Volume 3, 2006), HI (Volume 4, 2009), Selected Pacific Islands (Volume 5, 2009), CA (Volume 6, 2011), AK (Volume 7, 2011), CO, IA, KS, MI, MN, MO, ND, NE, OK, SD, WI (Volume 8, 2013), AL, AR, FL, GA, LA, MS (Volume 9, 2013), CT, MA, ME, NH, NY, RI, VT (Volume 10, 2015), TX (Volume 11, 2018), and MT, ID, WY (Volume 12, 2024). HDSC is currently working on developing the NOAA Atlas 14 Volume 13 that covers the states of DE, MD, NC, PA, SC, VA and Washington D.C.
 In 2022, NOAA received federal funding under the Bipartisan Infrastructure Law to revise and update NOAA PF estimates nationwide. Please visit the NOAA Atlas 15 Informational Page for detailed information on NOAA Atlas 15, currently in development: https://water.noaa.gov/about/atlas15. For all inquiries regarding NOAA Atlas 15, please send an email to HDSC.questions@noaa.gov.
Please visit the NOAA Atlas 14 website site for detailed information on NOAA Atlas 14: https://www.weather.gov/owp/hdsc. For all inquiries regarding NOAA Atlas 14, please send an email to HDSC.questions@noaa.gov.
In 2022, NOAA received federal funding under the Bipartisan Infrastructure Law to revise and update NOAA PF estimates nationwide. Please visit the NOAA Atlas 15 Informational Page for detailed information on NOAA Atlas 15, currently in development: https://water.noaa.gov/about/atlas15. For all inquiries regarding NOAA Atlas 15, please send an email to HDSC.questions@noaa.gov.
Please visit the NOAA Atlas 14 website site for detailed information on NOAA Atlas 14: https://www.weather.gov/owp/hdsc. For all inquiries regarding NOAA Atlas 14, please send an email to HDSC.questions@noaa.gov.
3. PRECIPITATION FREQUENCY ANALYSIS METHODS AND DEFINITIONS
3.1 What is the difference between Annual Exceedance Probability (AEP) and Average Recurrence Interval (ARI)?
The frequency of the event can be expressed in terms of annual exceedance probability (AEP) or average recurrence interval (ARI). AEP is the probability associated with exceeding a given amount for a specified duration and at a given location in any given year at least once; the inverse of AEP provides a measure of the average time between years in which a particular value is exceeded at least once; the term is associated with analysis of annual maximum series (AMS). ARI represents average time between cases of a particular precipitation magnitude for a specified duration and at a given location; the term is usually associated with the analysis of partial duration series (PDS). When used with the AMS-based frequency analysis, ARI does not represent the "true" average period between exceedances of a given precipitation magnitude, but the average period between years in which a given precipitation magnitude is exceeded at least once. Those two average periods can be considerably different for more frequent events. Differences in magnitudes of corresponding frequency estimates from the two series are negligible for ARIs greater than about 10-15 years, but notable at smaller ARIs (especially for ARI ≤ 5 years). Because the PDS can include more than one event in any particular year, the results from a PDS analysis are considered more reliable for designs based on frequent events. To avoid confusion, in NOAA Atlas 14, we use term AEP with AMS frequency analysis and ARI with PDS frequency analysis. The term "frequency" is interchangeably used to specify the ARI and AEP.
3.2 What is a 100-year rainfall event and how often is it exceeded?
A 100-year rainfall event (or more accurately the 100-year rainfall amount for a specified duration and at a given location) is an amount that on average is exceeded every 100 years, so its average recurrence interval ARI is 100 years. Similarly, it has 1% (or 1/100) AEP chance of being exceeded in any given year (AEP = 1/100). Sometimes it is useful to know what the chance is that this amount will be exceeded over a longer period. The calculator on the page https://www.weather.gov/epz/wxcalc_floodperiod can help you estimate that probability. For example, a 100-year amount for a specified duration has 26 % chance of occurring in a 30-year period at a given location.
3.3 Why do 1000-year (100-year) events happen so often?
When talking about the frequency of a n-year event, the following elements should be specified: duration, location and area size. The same amount of rainfall can be categorized as a 1000-year event or a 10-year event, depending on duration, location and areal extent. For example, for New York City, 5 inches of rain would be a 1000-year event if it fell during 60 minutes, or a 25-year event if it fell during 6 hours. Also, while 5 inches of rain in 60 minutes is a 1000-year event for NYC, it is only a 100-year event for Miami, Florida. Similarly, a 100-year estimate for a given duration is not the same for a particular location in NYC and across the whole NYC area. Thus, speaking about the 1000-year event regardless of duration at which it occurs, or the area size it covers, or a location where it occurs, may suggest that these events occur more frequently than expected. The Australian Bureau of Meteorology article Why do 100-year events happen so often? explains well the concept of a 100-year event and our perception of it happening too often.
3.4 How can I calculate exceedances for a storm event?
To calculate exceedances for a given storm event, you can compare observed precipitation amounts to corresponding precipitation frequency estimates. For this type of analysis, we typically do comparison for the range of durations and select one or two critical durations that show the lowest exceedance probabilities for the largest area for which we create AEP maps. Since the beginning and ending of the worst case period are not necessarily the same for all locations, the AEP maps do not represent isohyets at any particular point in time, but rather within the whole event. In our analysis the underlying data are grids of observed precipitation data and precipitation frequency estimates at 30-arc second resolution for a range of durations and AEPs. Whenever possible, gridded precipitation data are developed for a range of durations from measurements collected from rain gauges reporting at the time when the map is created. Rain gauges are usually from the National Centers for Environmental Information's- NCEI's Climate Data Online. The NCEP's multi-sensor Stage IV QPE Product and radar-based NEXRAD are used when rain gauges do not provide sufficient information to depict spatial patterns. Gridded precipitation frequency estimates normally come from NOAA Atlas 14. For more information on our methodology or to see annual exceedance probability maps that we created for selected storm events, please visit the Storm Analysis page.
3.5 May I use your estimates directly as an input to a watershed model?
That depends on a size of your watershed area. Point precipitation frequency estimates from NOAA Atlas 14, are representative only for a limited area around the point and therefore cannot be used in many applications that require areal estimates. The areal reduction factor (ARF) is a concept that has been widely used in engineering design to convert point precipitation for a specified duration and frequency into average precipitation over an area for the same duration and frequency. Typically, ARFs are presented as a set of curves showing the variation of ARF with area, duration, and average recurrence interval. Although many ARF methods have been proposed in recent years, a single set of ARF curves from the Technical Paper No. 29 (U.S. Weather Bureau, 1958) is still commonly used in engineering design. Due to the significance of the ARF products for several federal agencies, we started an assessment of different ARF methods in relationship to NOAA Atlas 14 with the goal of developing a tool that would allow for automatic calculation for areal estimate for a watershed delineated on the fly. Due to lack of resources, we had to put all related activities on hold for the foreseeable future.
3.6 How do you address impacts of nonstationarity on precipitation frequency estimates?
With funding support from the Bipartisan Infrastructure Law (BIL), NOAA is developing and implementing NOAA Atlas 15, the future authoritative source and national standard for precipitation frequency information. NOAA Atlas 15 will be implemented nationwide while accounting for trends and represents a shift from a stationary assumption (i.e. extreme precipitation does not change over time) to a nonstationary assumption. Please visit the NOAA Atlas 15 website for detailed information on NOAA Atlas 15, currently in development: https://water.noaa.gov/about/atlas15. For all inquiries regarding NOAA Atlas 15, please send an email to atlas15.info@noaa.gov.
4. PROBABLE MAXIMUM PRECIPITATION (PMP)
4.1 I do not see any information on current PMP projects in your Quarterly Progress Reports. Are you currently working on updating PMP estimates anywhere in the USA?
Since the late 1940s, the NOAA’s National Weather Service has provided PMP guidance and at the request of various federal agencies and with funding provided by those agencies. This funding has diminished and gradually ceased, and as a result the NWS could not continue the PMP activities.
With the 2022 Bipartisan Infrastructure Law (BIL), NOAA received the first-ever direct Federal funding to update PMP estimates for the entirety of the United States. To assure that the best science is applied to this important task, NOAA is first sponsoring a study by the National Academies of Science, Engineering, and Medicine called "Modernizing Probable Maximum Precipitation Estimation." Please see the project website for more information and a way to sign up for project updates.
5. GENERAL PRECIPITATION QUESTIONS
5.1 Where can I find historical rainfall information?
Beyond NOAA Atlas 14 annual maximum series data provided at Time Series page, this site does not have or provide historical weather and climate information. You can obtain historical weather and climate information from:
|

