
Hazardous heat will continue across the Southern Plains, Gulf Coast and Desert Southwest through the weekend. Additional heat will build into the Great Basin and Northern Plains this weekend. A stalled front is expected to bring periods of heavy to excessive rainfall and flooding from the Tennessee Valley to the Southeast U.S on Friday. Read More >
Overview
This page provides a variety of information related to drought.
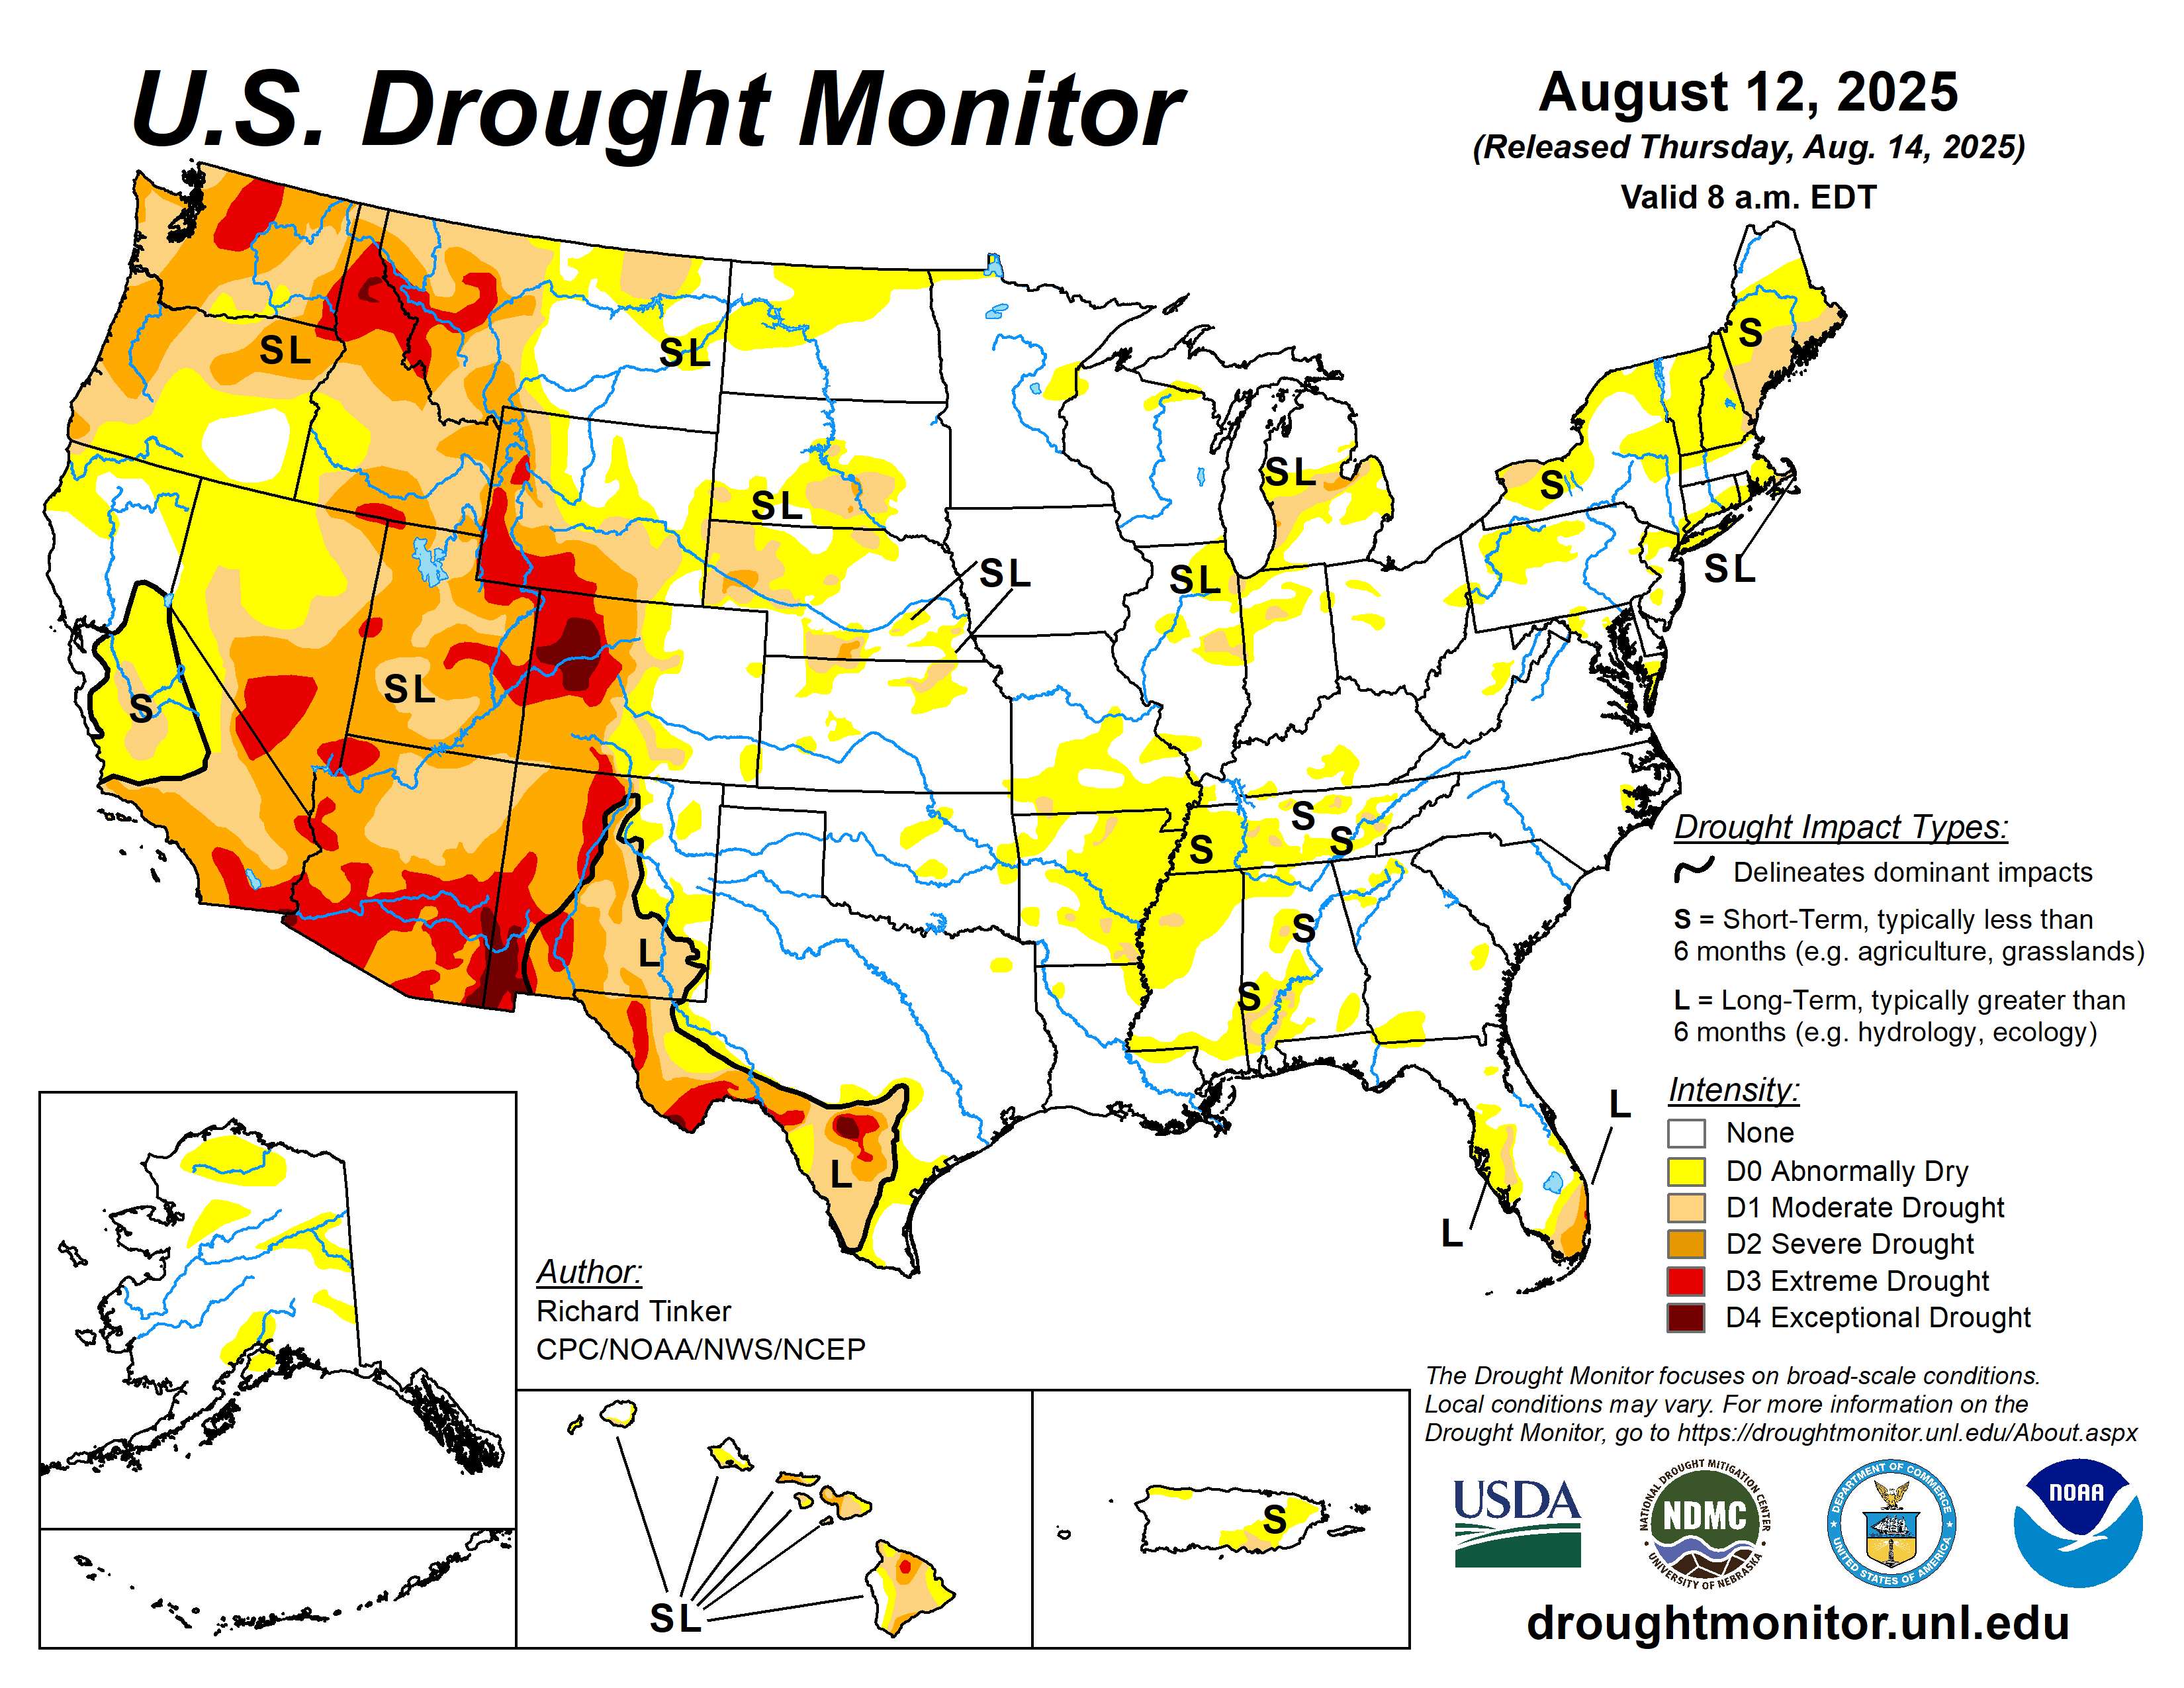
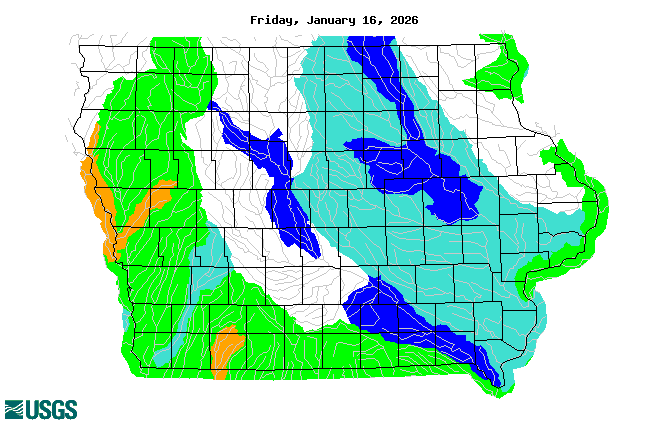
Current Drought Maps
  |
The categories of drought are defined as follows: Abnormally Dry (D0) - Going into drought: short-term dryness slowing planting, growth of crops or pastures; fire risk above average. Coming out of drought: some lingering water deficits; pastures or crops not fully recovered. Moderate Drought (D1) - Some damage to crops, pastures; fire risk high; streams, reservoirs, or wells low, some water shortages developing or imminent, voluntary water use restrictions requested. Severe Drought (D2) - Crop or pasture losses likely; fire risk very high; water shortages common; water restrictions imposed. Extreme Drought (D3) - Major crop/pasture losses; extreme fire danger; widespread water shortages or restrictions. Exceptional Drought (D4) - Exceptional and widespread crop/pasture losses; exceptional fire risk; shortages of water in reservoirs, streams, and wells, creating water emergencies. |
||
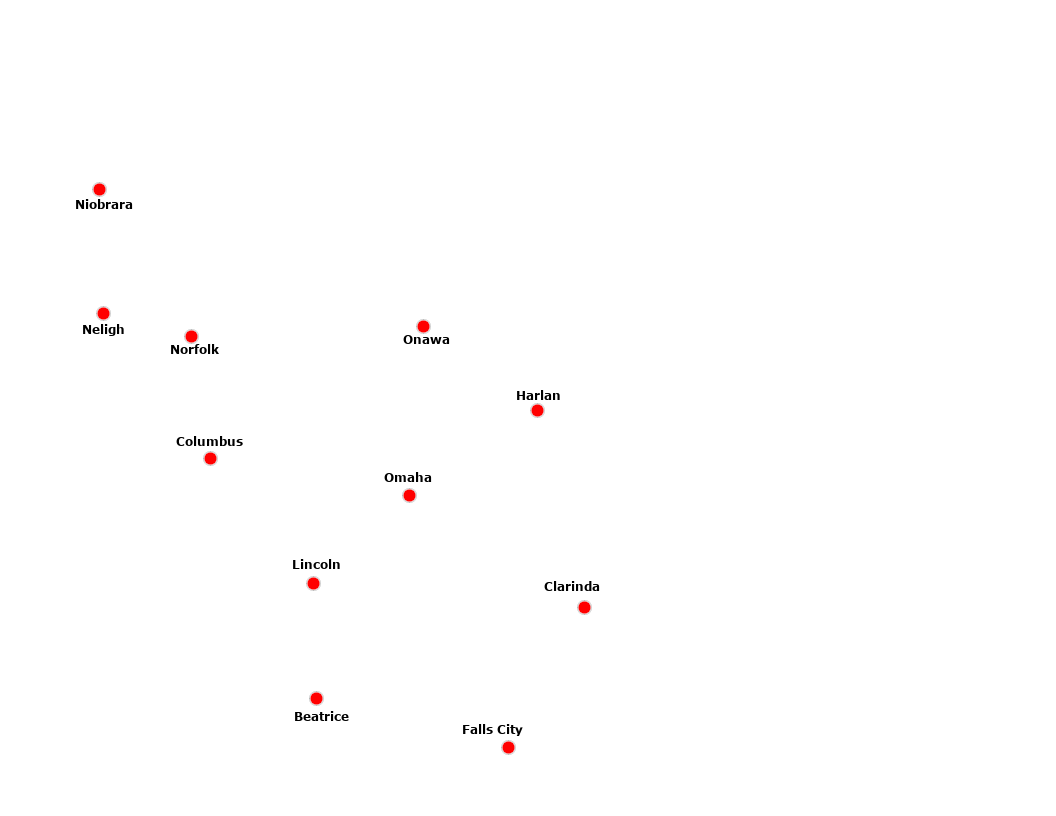
Nebraska |
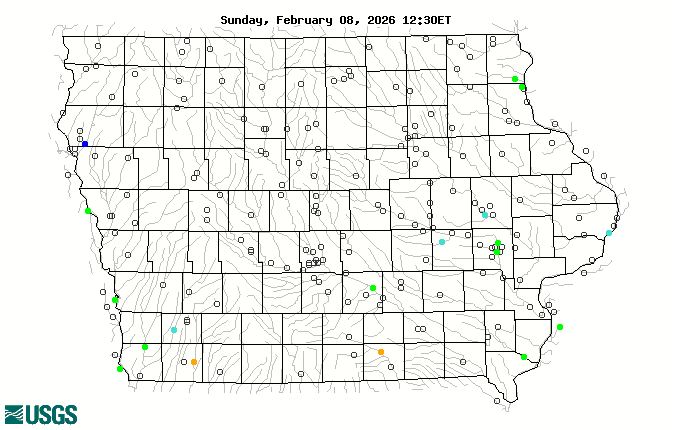
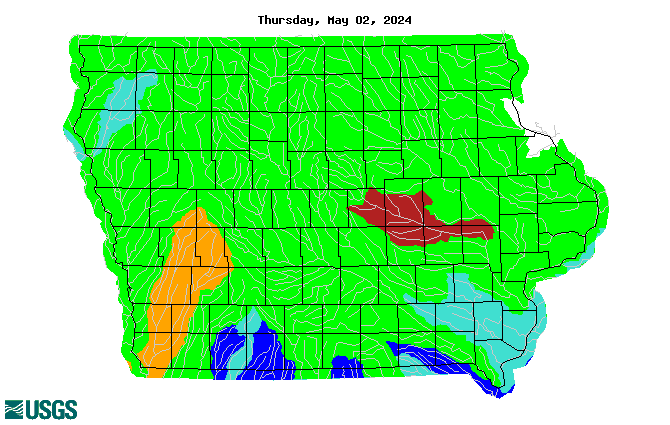
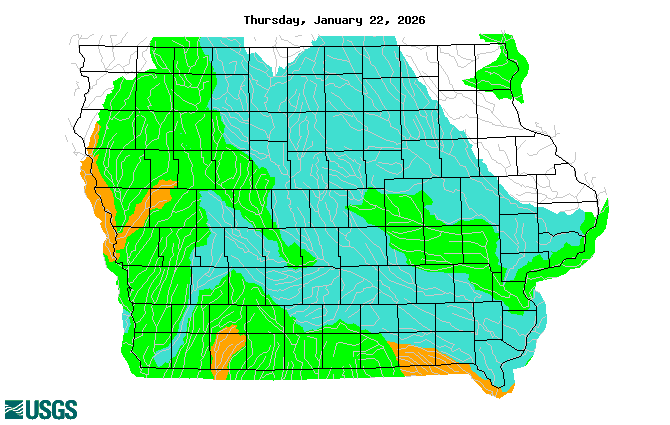
Iowa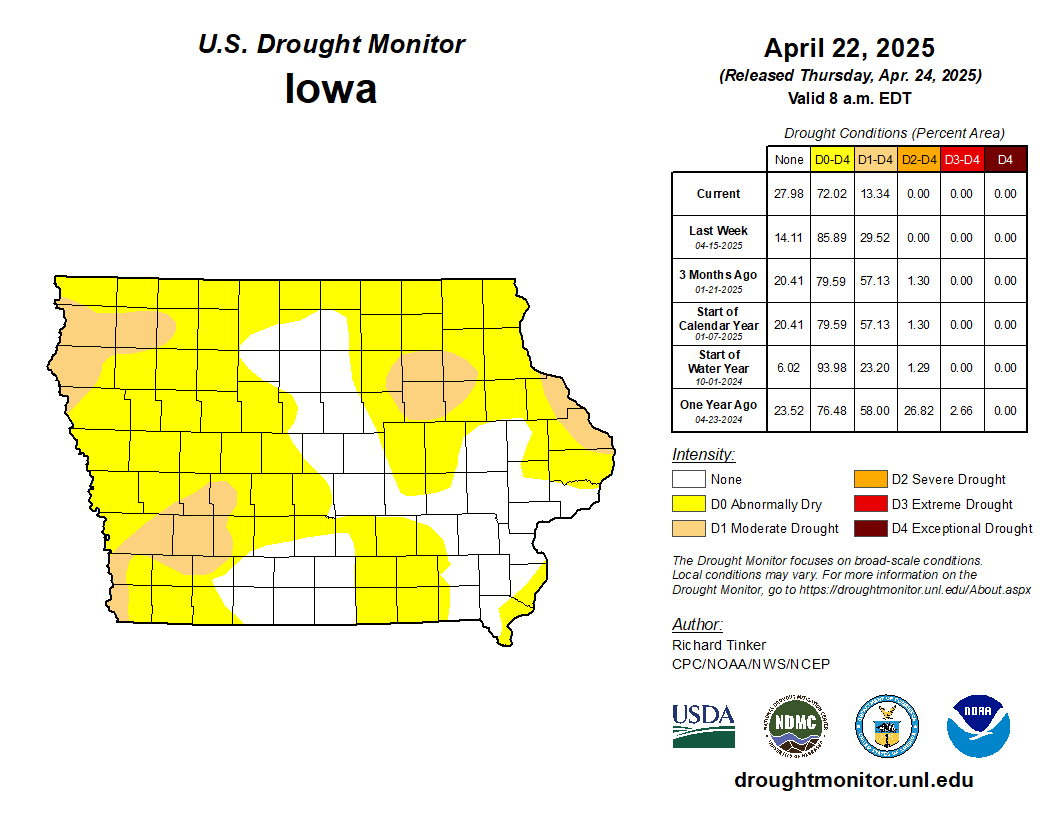 |
||
 |
|||
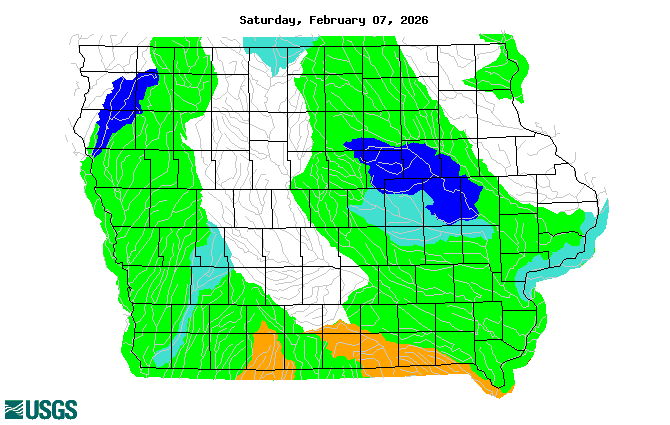
Drought Change Maps
|
|
The categories of drought are defined as follows: Abnormally Dry (D0) - Going into drought: short-term dryness slowing planting, growth of crops or pastures; fire risk above average. Coming out of drought: some lingering water deficits; pastures or crops not fully recovered. Moderate Drought (D1) - Some damage to crops, pastures; fire risk high; streams, reservoirs, or wells low, some water shortages developing or imminent, voluntary water use restrictions requested. Severe Drought (D2) - Crop or pasture losses likely; fire risk very high; water shortages common; water restrictions imposed. Extreme Drought (D3) - Major crop/pasture losses; extreme fire danger; widespread water shortages or restrictions. Exceptional Drought (D4) - Exceptional and widespread crop/pasture losses; exceptional fire risk; shortages of water in reservoirs, streams, and wells, creating water emergencies. |
||
1 Week Change |
4 Week Change |
||
8 Week Change |
12 Week Change |
||
26 Week Change |
52 Week Change |
||
Local Drought Statement
To see the local drought information statement in pdf form or to view past statements, visit OAX Drought Statements.
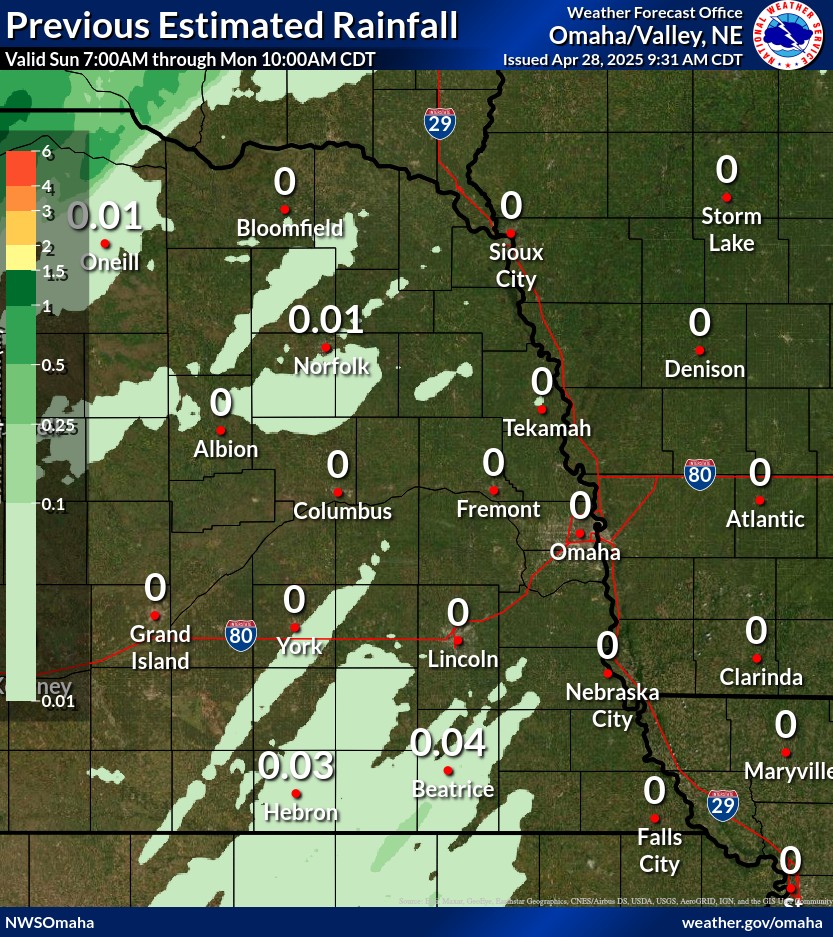
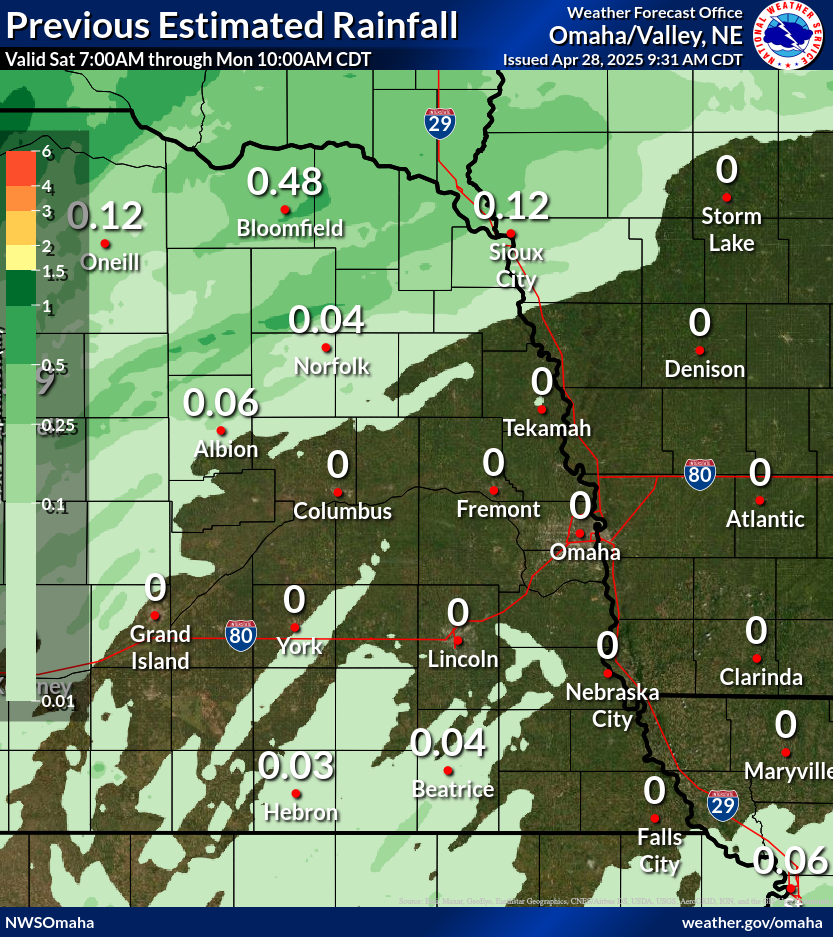
Past Precipitation
Click the image to enlarge.
 |
 |
| Precipitation | Departure from Normal | Percent of Normal | |
|---|---|---|---|
| 7 days |  |
 |
 |
| 14 days |  |
 |
 |
| 30 days |  |
 |
 |
| 60 days |  |
 |
 |
| 90 days |  |
 |
 |
| Standardized Precipitation Index |
 |
 |
 |
Forecast Precipitation
Click the image to enlarge.
Day 1 |
Day 2 |
Day 3 |
Days 4-5 |
Days 6-7 |
7 Day Total |
Days 6-10 |
Days 8-14 |
Soil Moisture
The maps show the departure from normal 30-year climatology.


 |
 |
Streamflow
Click the image to enlarge.
| Real Time | 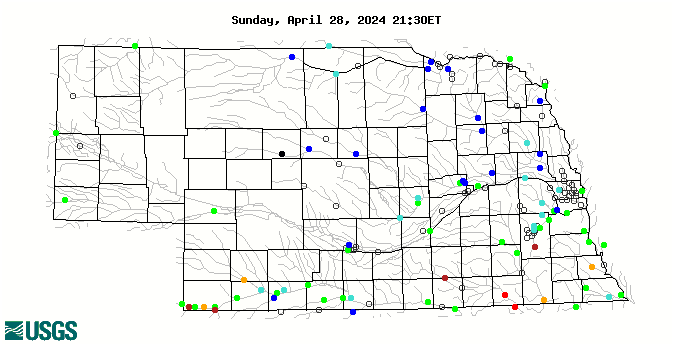 |
 |
| Daily | 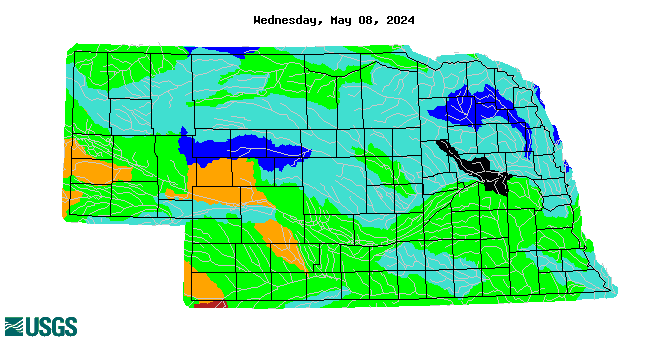 |
 |
| 7 Day | 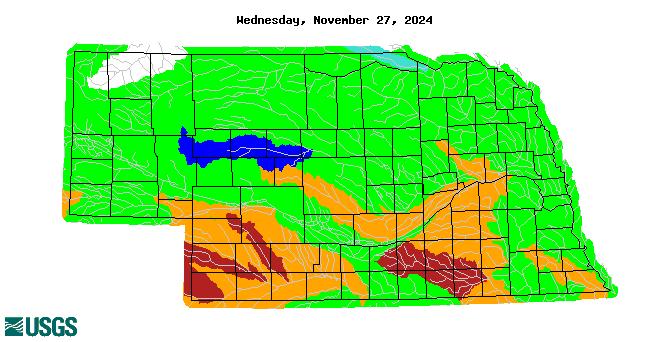 |
 |
| 14 Day | 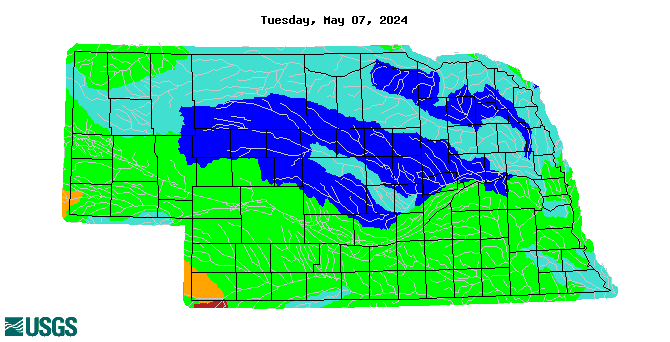 |
 |
| 28 Day | 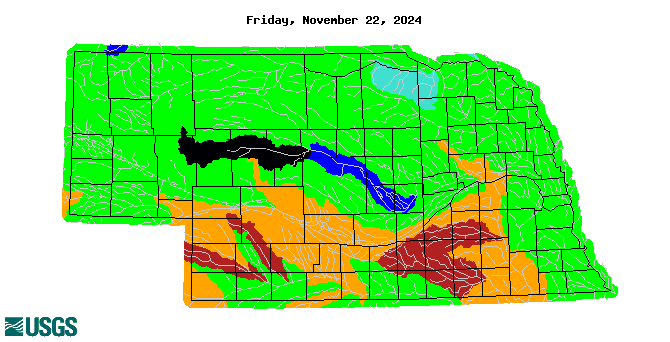 |
 |
Drought Outlooks
Click the image to enlarge.
Monthly Drought Outlook |
Seasonal Drought Outlook |
Climate Outlooks
Click the image to enlarge.
Weeks 3-4 Temperature |
Weeks 3-4 Precipitation |
Monthly Temperature |
Monthly Precipitation |
Three Monthly Temperature |
Three Monthly Precipitation |
County Browser
Click the map below to view county-specific drought information.
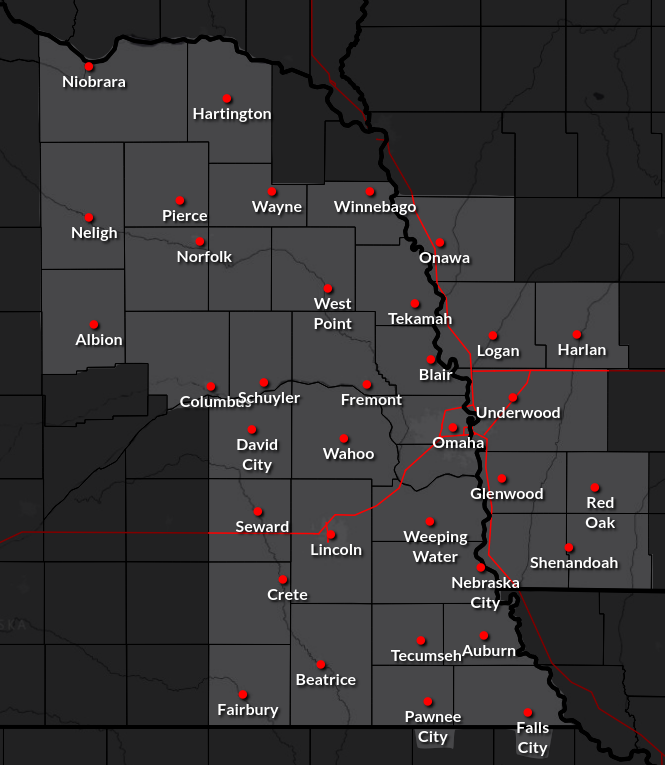
Clicking the map will open a new window at the National Integrated Drought Information System
Other Resources

