...OCTOBER 2012 MONTHLY CLIMATE SUMMARY...
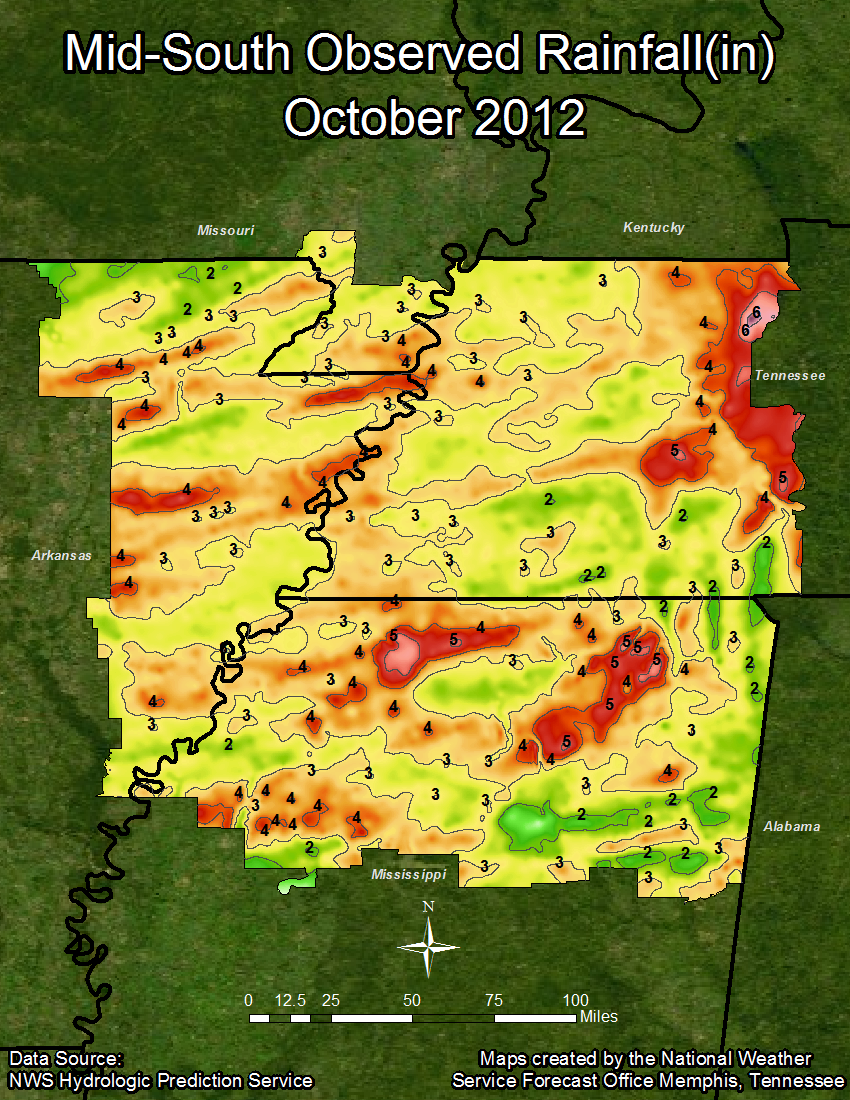
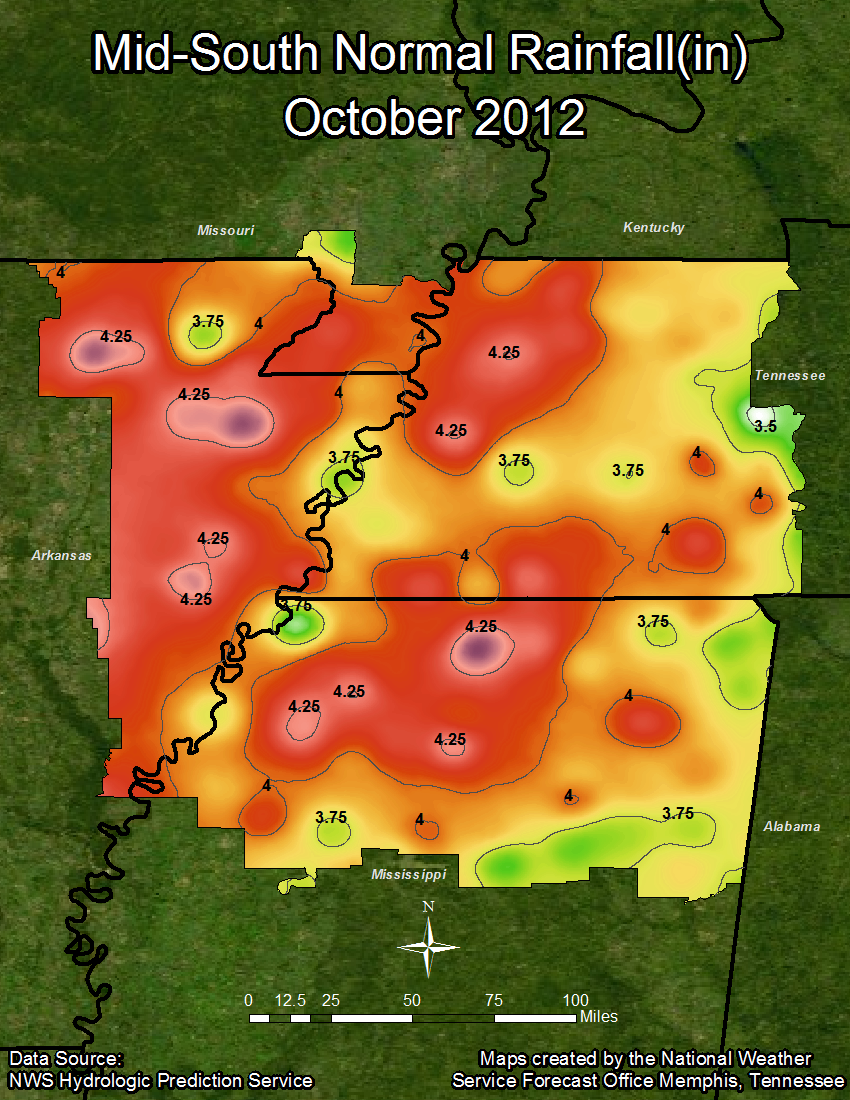
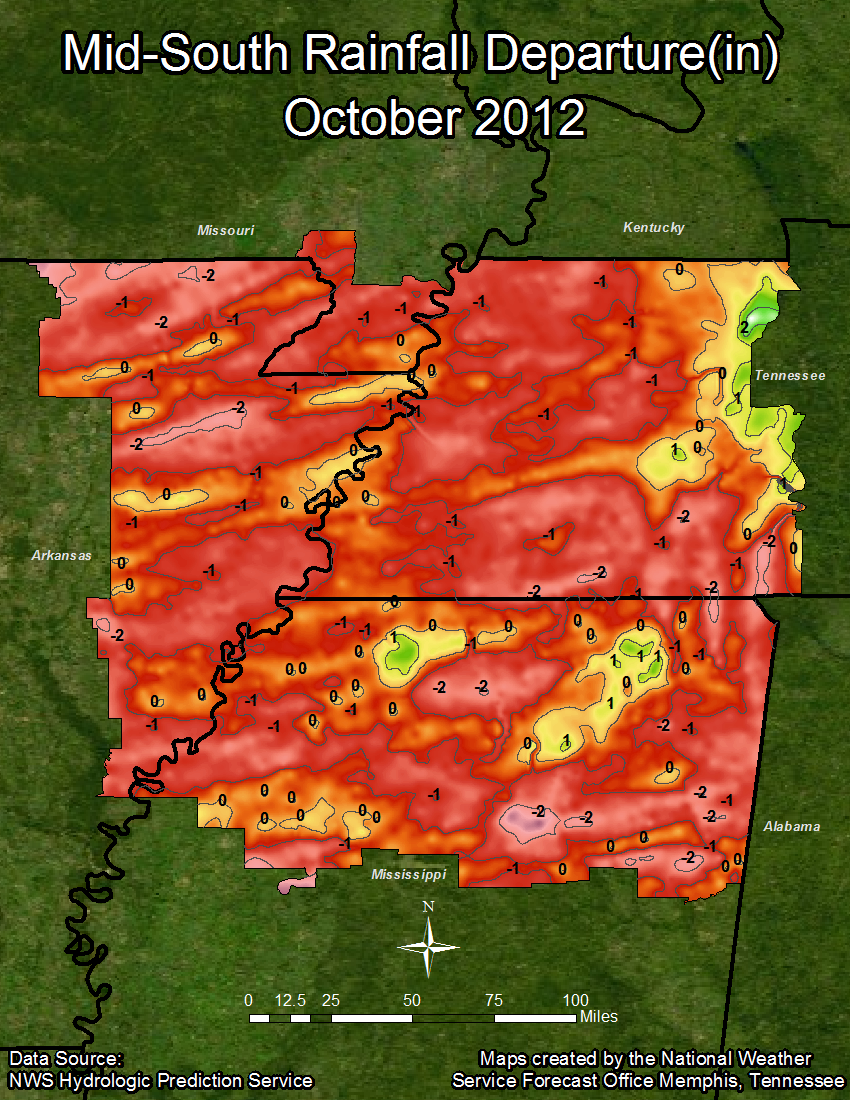
October 2012 yielded temperatures slightly below normal across the majority of the Mid-South region. Precipitation was varied as most of the region experienced slightly below normal values. However, some areas such as the Tennessee River Valley, and localized portions of North Mississippi received just above normal values. This was most likely due to intense rainfall during a severe weather event that occurred on October 17th. As for the official climate sites, Jackson and Memphis checked in with the highest precipitation amounts for the month with 4.37 and 3.66 inches respectively. For the year...2012 is still on pace as the warmest year on record at Memphis. Jackson and Jonesboro came in at third place while Tupelo came in at fourth for the year. Due to rainfall during the month of October, 2012 has fallen out of the top ten rankings for the driest months on record at all official climate sites. Here is the climate data that tells the story:
Temperature Data:
Memphis Jackson Jonesboro Tupelo
Average Temperature (OCT) : 61.4 57.9 59.5 60.9
Normal Avg. Temp (OCT) : 64.1 60.5 61.2 63.0
Departure from Normal (OCT) : -2.7 -2.6 -1.7 -2.1
Average Temperature (YEAR) : 68.9 65.2 66.9 67.4
Normal Avg. Temp (YEAR) : 65.9 62.6 63.0 65.2
Departure from Normal (YEAR): 3.0 2.6 3.9 2.2
Precipitation Data:
Memphis Jackson Jonesboro Tupelo
Total Precipitation (OCT) : 3.66 4.37 2.75 3.06
Normal Precipitation (OCT) : 3.98 3.77 4.26 4.12
Departure from Normal (OCT) : -0.32 0.60 -1.51 -1.06
Total Precipitation (YEAR) : 30.27 35.47 27.71 41.52
Normal Precipitation (YEAR) : 42.45 43.02 38.43 44.03
Departure from Normal (YEAR) :-12.18 -7.55 -10.72 -2.51
Using the 1981-2012 set of normals, the following tables show rank, average temperature, departure, and its year of occurrence.
Top 10 warmest years through OCTOBER 31:
MEMPHIS JACKSON
RNK AVG YR DEP RNK AVG YR DEP
1 69.0 2012 3.1 1 66.1 1954 3.5
2 68.5 2007 2.6 2 65.6 1953 3.0
3 68.0 1998 2.1 3 65.4 2012 2.8
4 67.8 2005 1.9 4 64.7 1991 2.1
4 67.8 2000 1.9 4 64.7 2007 2.1
6 67.6 1921 1.7 4 64.7 1990 2.1
7 67.4 1954 1.5 7 64.5 1952 1.9
7 67.4 2006 1.5 7 64.5 1955 1.9
7 67.4 1925 1.5 9 64.4 1949 1.8
10 67.3 1986 1.4 10 64.3 1986 1.7
JONESBORO TUPELO
RNK AVG YR DEP RNK AVG YR DEP
1 68.0 1921 5.0 1 68.0 1938 2.8
2 67.4 1901 4.4 2 67.9 1954 2.7
3 67.1 2012 4.1 3 67.8 2007 2.6
4 66.8 1925 3.8 4 67.6 2012 2.4
5 66.7 1954 3.7 5 67.5 2006 2.3
6 66.1 1998 3.1 6 67.4 1939 2.2
6 66.1 1932 3.1 7 67.2 1953 2.0
7 65.7 1986 2.7 8 67.0 1935 1.8
8 65.4 1941 2.4 8 67.0 1933 1.8
8 65.4 1911 2.4 10 66.9 2000 1.7
Significant Weather Events:
For OCTOBER 2012: Drought conditions improved somewhat due to near or slightly below normal rainfall for the month. Rivers across the region are slowly on the rise due to recent rainfall. However, the Mississippi River remains below normal levels.
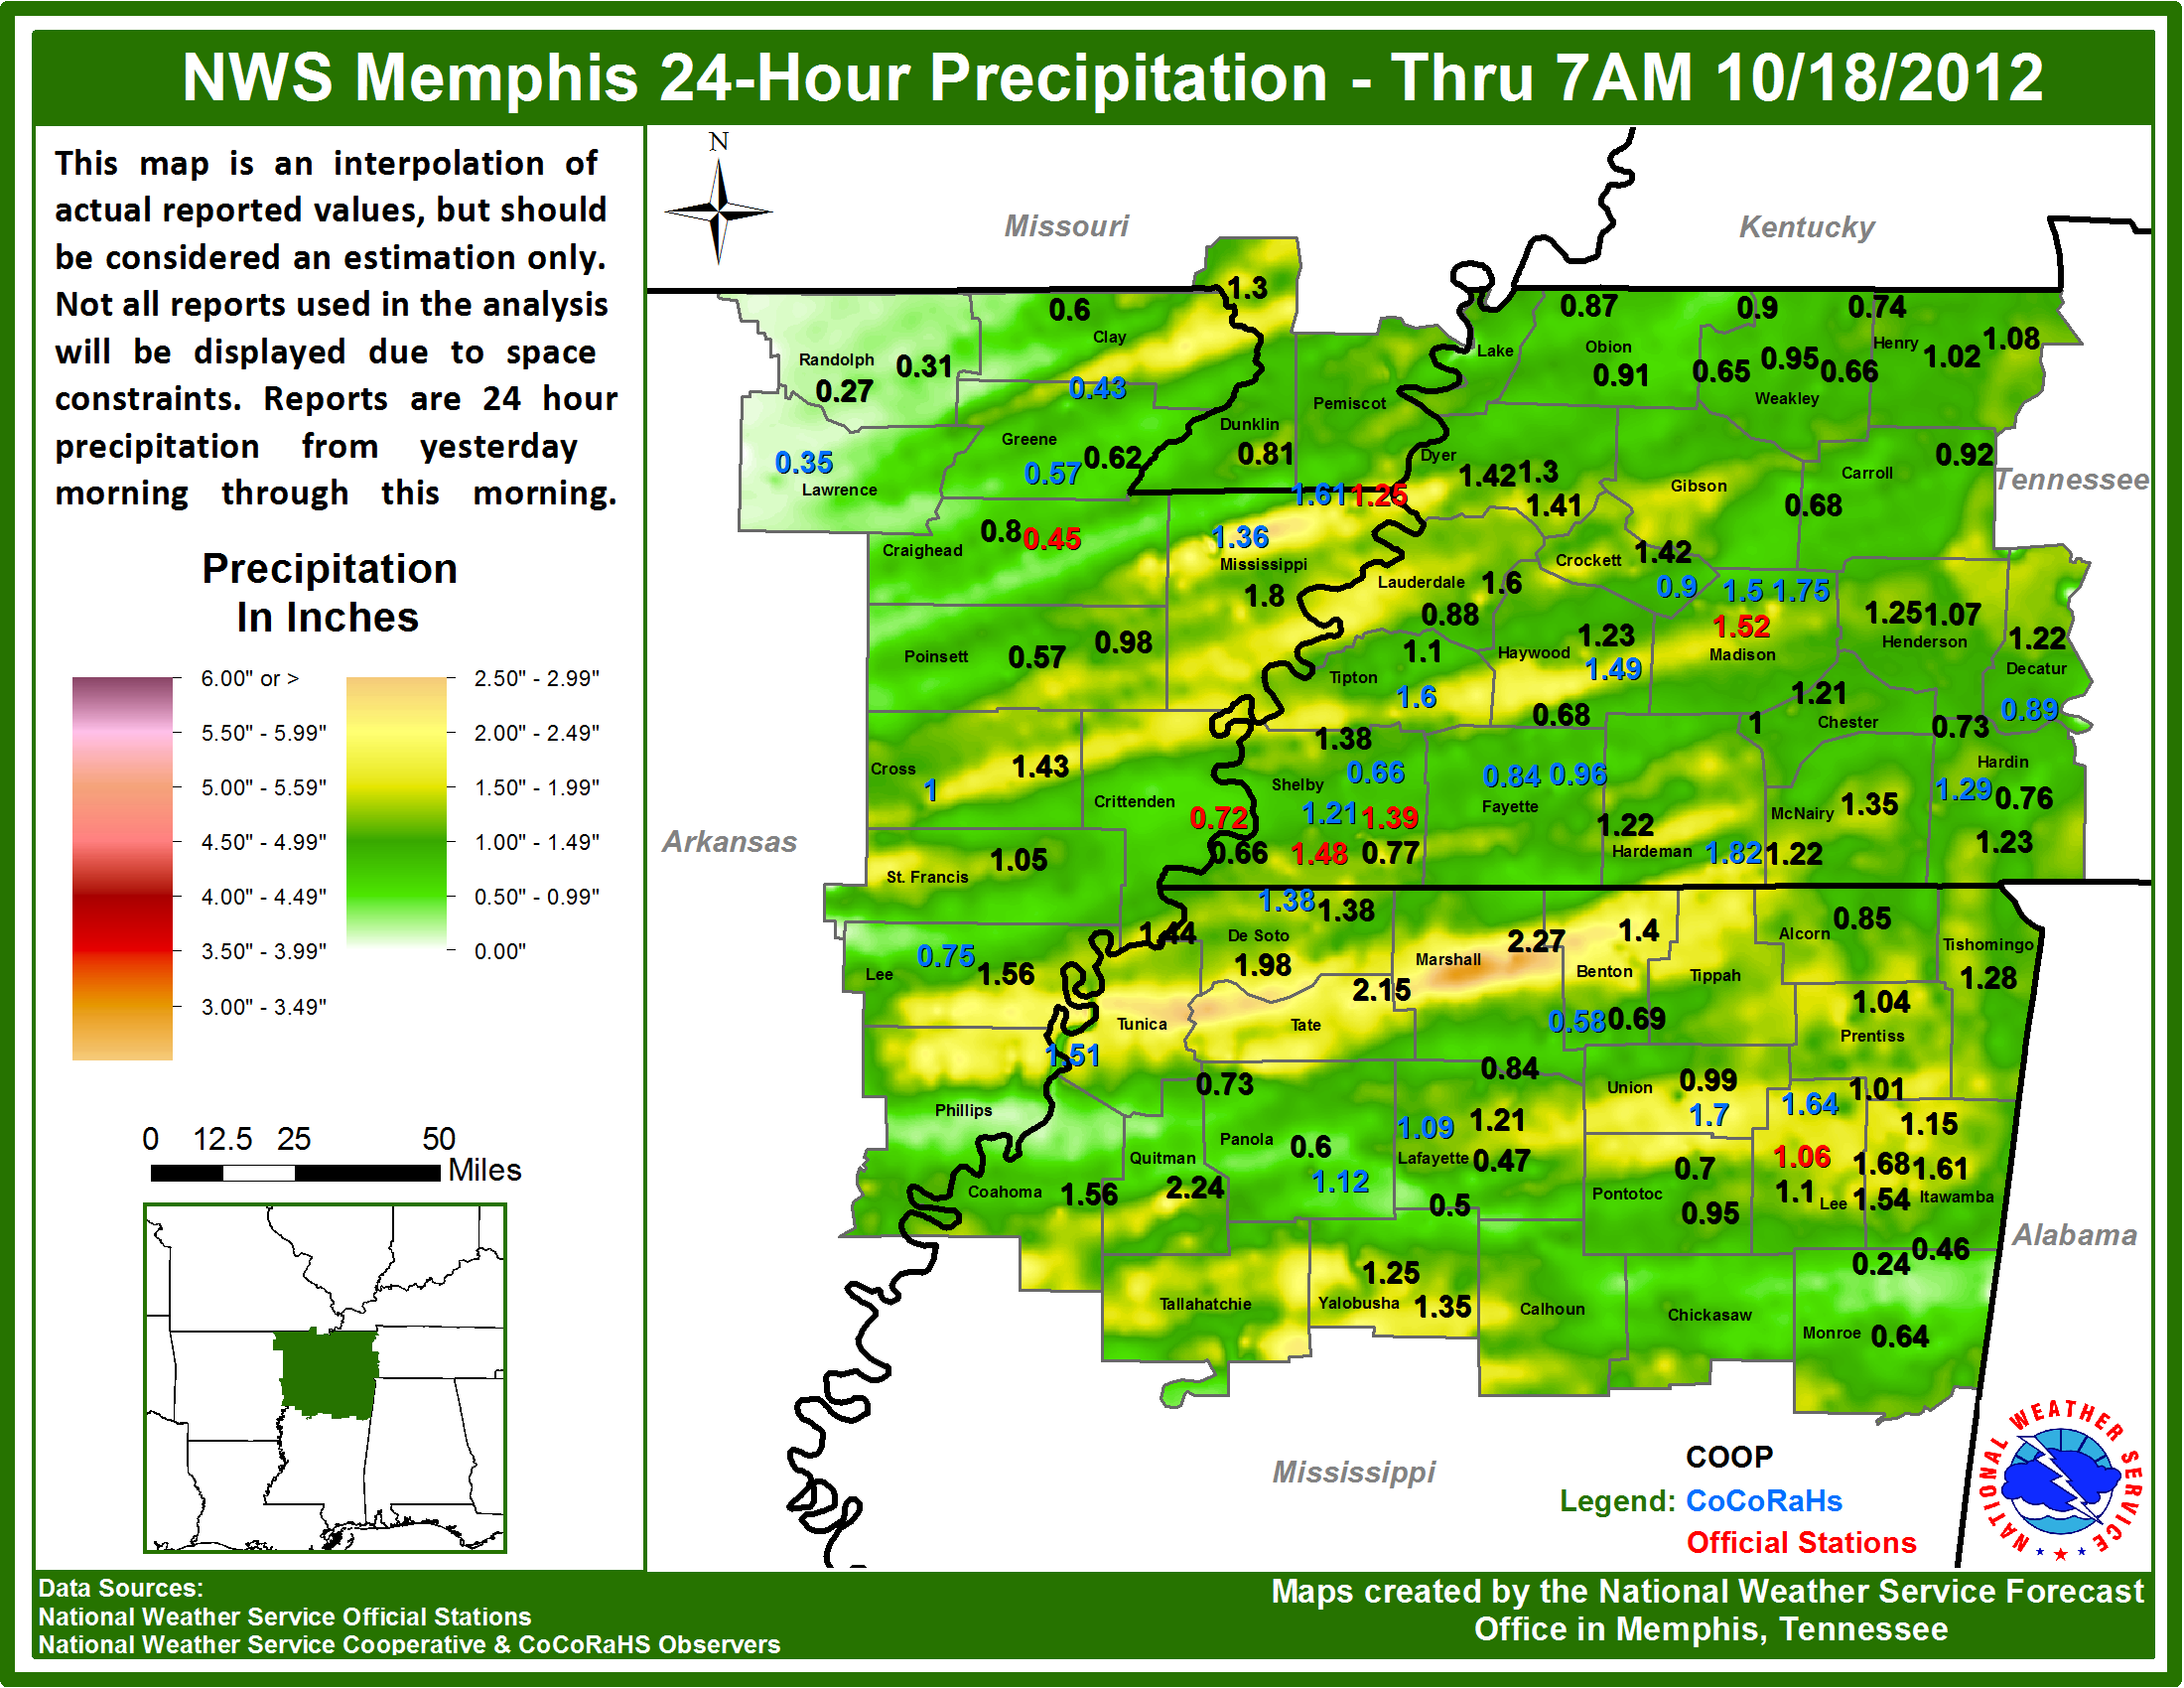
The month of October produced one significant severe weather event across the Mid-South region. A strong cold front pushed through the region on October 17th producing a broken line of showers and thunderstorms with embedded supercells, and one or two semi discrete supercells early on. Various reports of quarter sized hail, winds in excess of 60 miles per hour, and funnel clouds were received at the National Weather Service office in Memphis. Survey crews were dispatched on October 18th to assess the reported damage in Union, Coahoma, and Tate counties in North Mississippi. No evidence of a tornado was found at any location; however some straight line wind gusts between 70 and 80 miles per hour were estimated. A crew also surveyed various reports of structural damage in Millington, Tennessee. They found evidence of straight line wind gusts nearing 80 miles per hour.
October 2012 Rainfall Graphics:


October 17th Severe Weather Event Rainfall:

CDG