...NOVEMBER 2013 MONTHLY CLIMATE SUMMARY...
November 2013 was cooler and drier than normal across the Mid-South. Memphis had the warmest average temperature this month with just over 49 degrees, which was four degrees cooler than the normal average temperature of just over 53 degrees. Tupelo was the second warmest with an average temperature of 48 degrees, nearly five degrees below the normal average for November of 52.9 degrees. This was the largest departure from normal of any of the sites, as well as the fifth coolest November on record for Tupelo. Jackson had a 4.8 degree departure from the 50.1 degree normal, with an average temperature of 45.3 degrees. This average temperature for Jackson tied the year 1959 for their sixth coolest November on record. Finally, Jonesboro’s average temperature this month was 45.8 degrees, a 3.8 degree departure from the normal average of 49.6 degrees. This average temperature of 45.8 degrees tied the years 1926 and 2000 for Jonesboro’s fifth coolest November.
With only one month remaining in the year 2013, all four sites have below normal average temperatures for the year. Jackson has the largest departure from normal at 1.3 degrees below normal, with the coolest average temperature of all the sites at 60.2 degrees. Tupelo’s average temperature of 63.2 degrees for the year is 0.9 degrees below normal, while Memphis’ average of 63.9 degrees is 0.8 degrees below normal for the year. Jonesboro is the site closest to normal for the year with an average temperature of 61.6 degrees, only 0.2 degrees below normal.
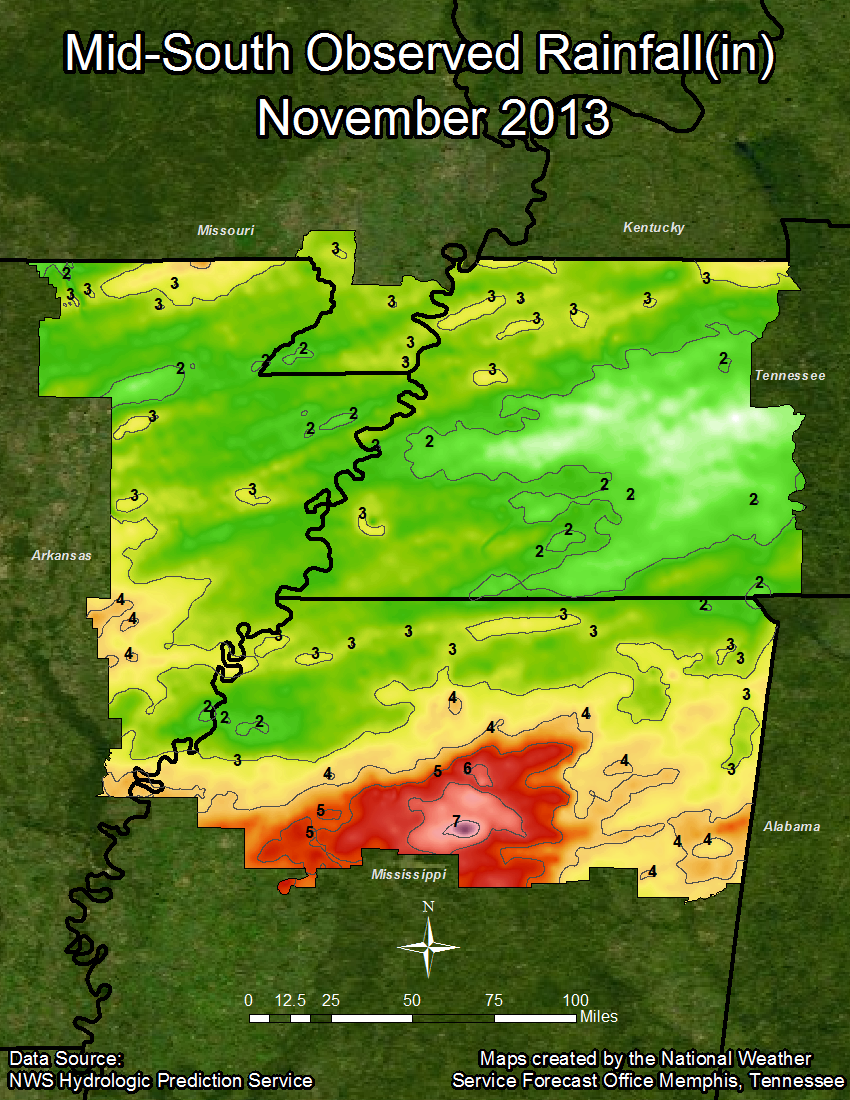
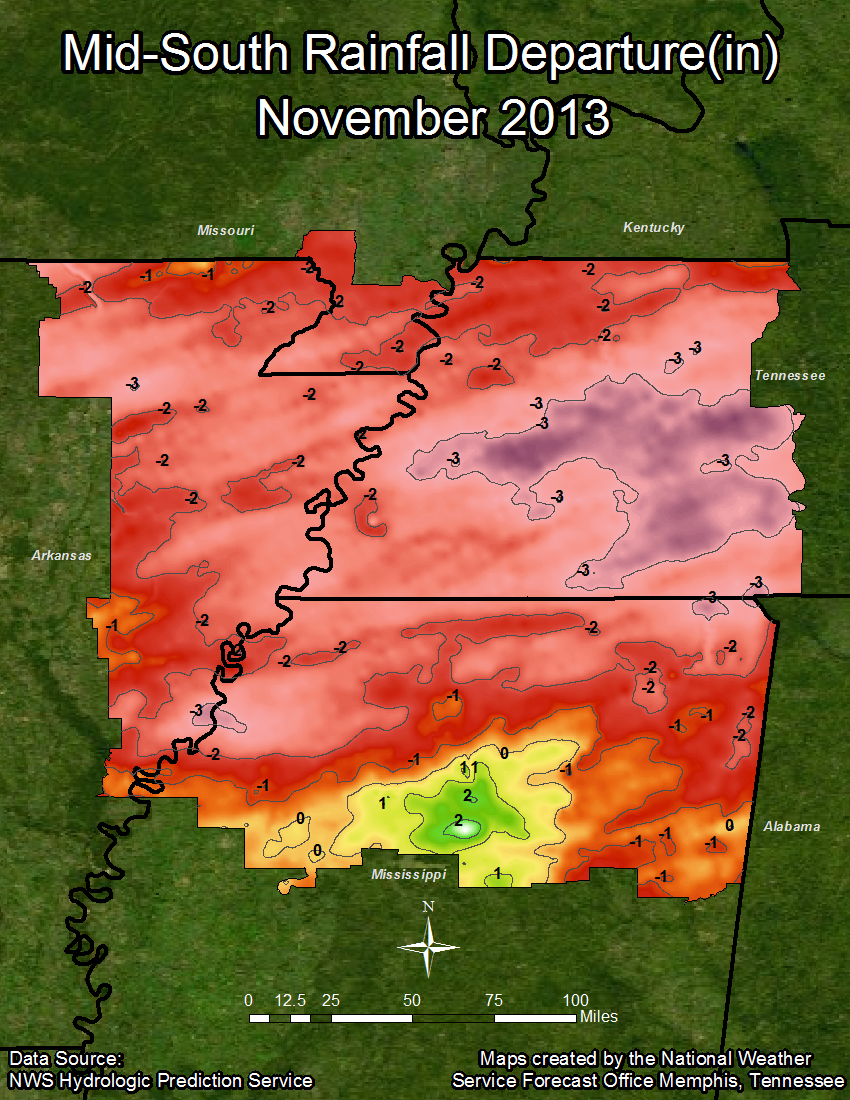
In addition to being the coolest site this month, Jackson was also the driest with only 1.83 inches of precipitation, a 3.07 inch departure below the normal of 4.90 inches for the month. This 1.83 inches of precipitation this month made November 2013 Jackson’s sixth driest November on record. Currently for the year Jackson is 5.60 inches above normal, at 53.52 inches of total precipitation in 2013. Jonesboro reported 2.39 inches of precipitation this month, a 2.51 inch departure below normal. Despite this, Jonesboro is still 2.65 inches of precipitation above normal for the year at 45.98 inches total. Memphis received 2.67 inches of precipitation this month, 2.82 inches below normal, but is still 6.67 inches above normal in total precipitation with a total 54.61 inches of precipitation so far in 2013. Tupelo received the most precipitation around the region this month with 4.33 inches of precipitation, which was only 0.37 inches below normal for November. Tupelo is currently the only site with a below normal precipitation total for the year at 46.58 inches, 2.15 inches below normal. The following are the climate data for November 2013.
TEMPERATURE DATA:
Memphis Jackson Jonesboro Tupelo
Average Temperature (MONTH) : 49.2 45.3 45.8 48.0
Normal Avg. Temp (MONTH) : 53.2 50.1 49.6 52.9
Departure from Normal (MONTH): -4.0 -4.8 -3.8 -4.9
Average Temperature (YEAR) : 63.9 60.2 61.6 63.2
Normal Avg. Temp (YEAR) : 64.7 61.5 61.8 64.1
Departure from Normal (YEAR) : -0.8 -1.3 -0.2 -0.9
PRECIPITATION DATA:
Memphis Jackson Jonesboro Tupelo
Total Precipitation (MONTH) : 2.67 1.83 2.39 4.33
Normal Precipitation (MONTH) : 5.49 4.90 4.90 4.70
Departure from Normal (MONTH): -2.82 -3.07 -2.51 -0.37
Total Precipitation (YEAR) : 54.61 53.52 45.98 46.58
Normal Precipitation (YEAR) : 47.94 47.92 43.33 48.73
Departure from Normal (YEAR) : 6.67 5.60 2.65 -2.15
Fall 2013 Review:
November 30th was the final day of Meteorological Fall, which is made up of the months of September, October, and November. Taking the averages of the average temperature and precipitation total for these three months and comparing these with the normal averages shows that Fall 2013 was cooler and drier than normal. Memphis was the warmest site on average this fall with an average temperature of 64 degrees, only 0.2 degrees cooler than the Fall normal average temperature. Tupelo was the second warmest at 62.7 degrees, 0.6 degrees below the normal fall average. Next was Jonesboro with a Fall average temperature of 61.5 degrees, 0.6 degrees above normal. This makes Jonesboro the only site in the region with an above normal average temperature this Fall. Jackson was the coolest site this fall, with an average temperature of 59.5 degrees, and had the greatest departure below normal at 1.2 degrees below the normal Fall average temperature.
All four sites had below normal amounts of precipitation this Fall. In fact, Memphis was the greatest departure from normal at nearly four inches of precipitation below normal this Fall. Tupelo received the most precipitation in September, October, and November with 9.59 inches, which also made it the site with the least departure from normal at only 2.67 inches below the normal for Fall. Jonesboro recorded 8.53 inches of precipitation this Fall, 3.69 inches below normal, while Jackson received 8.47 inches of rain, which was 3.58 inches below the normal Fall precipitation total. The following are the climate data for Fall 2013.
TEMPERATURE DATA:
Memphis Jackson Jonesboro Tupelo
Average Temperature (Fall 13) : 64.0 59.5 61.5 62.7
Normal Avg. Temp (Fall) : 64.2 60.7 60.9 63.3
Departure from Normal (Fall 13): -0.2 -1.2 0.6 -0.6
PRECIPITATION DATA:
Memphis Jackson Jonesboro Tupelo
Total Precipitation (Fall 13) : 8.66 8.47 8.53 9.59
Normal Precipitation (Fall) : 12.56 12.05 12.22 12.26
Departure from Normal (Fall 13): -3.90 -3.58 -3.69 -2.67
Climate Outlook:
For December 2013, the Climate Prediction Center has the Mid-South at an equal chance of experiencing above normal, normal, or below normal temperatures and precipitation totals.
Here are the precipitation graphics for November 2013, displaying observed precipitation and departure from normal:
MAYE

