...MARCH 2013 MONTHLY CLIMATE SUMMARY...
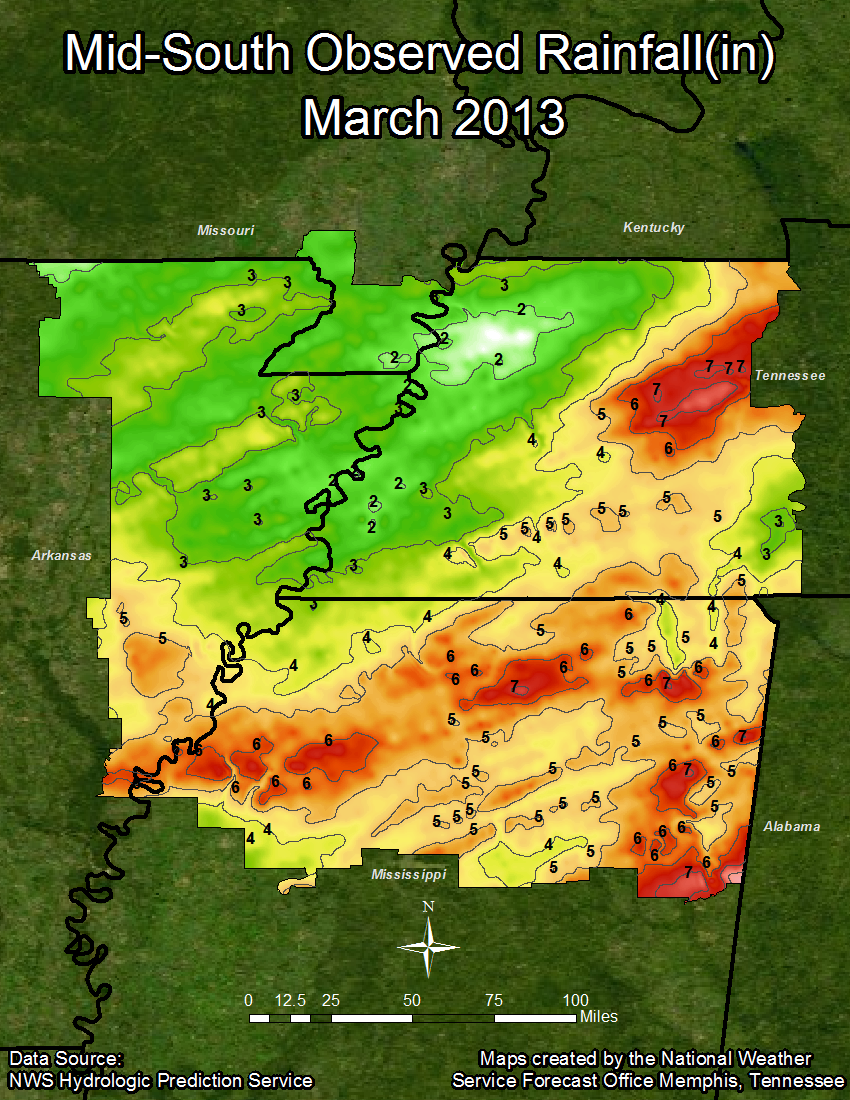
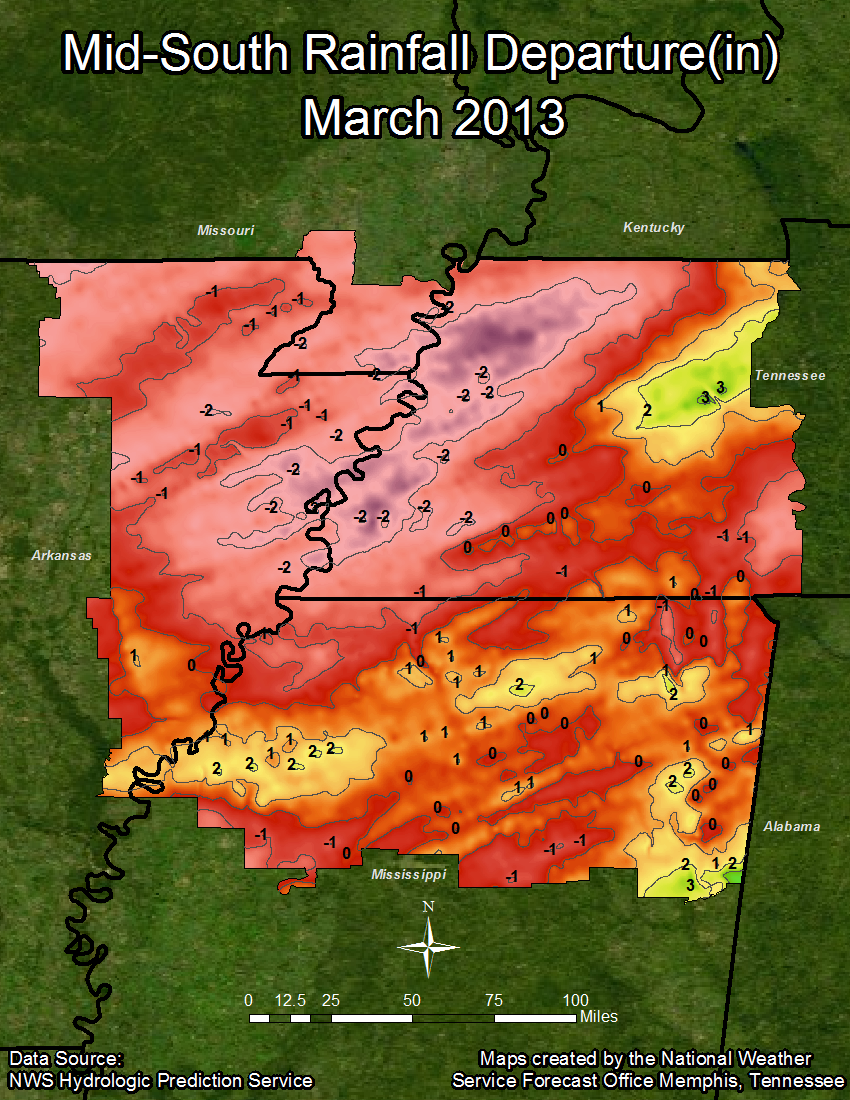
March 2013 yielded average temperatures well below normal across the entire Mid-South region. In fact, all official climate sites except Memphis ranked in the all-time top ten for coolest months of March. Jackson ranked fourth all-time, while Jonesboro and Tupelo ranked seventh all-time. As for Memphis, no top ten records were set. However, looking at climate records it seems that Memphis had the second coolest March in the last forty years. The year of 1996 was the coolest since 1973 in Memphis. Temperatures for the year remain at or just below normal. As for precipitation, all climate sites came in below normal with Jackson being the closest to normal with a departure of 0.90 inches below normal. The driest of the official stations was Jonesboro with a departure of 2.41 inches below normal. For the year, all climate sites remain above normal thanks in part to above normal rainfall in January. There was one significant snowfall event that produced four inches of snowfall at Jonesboro; all other sites received only a trace of snowfall. Below is the climate data that tells the story:
Temperature Data:
Memphis Jackson Jonesboro Tupelo
Average Temperature (MAR) : 48.5 44.4 44.9 48.1
Normal Avg. Temp (MAR) : 54.0 51.0 50.2 54.0
Departure from Normal (MAR) : -5.5 -6.6 -5.3 -5.9
Average Temperature (YEAR) : 47.7 42.9 42.7 46.4
Normal Avg. Temp (YEAR) : 46.9 43.8 43.1 47.2
Departure from Normal (YEAR): 0.8 -0.9 -0.4 -0.8
Precipitation Data:
Memphis Jackson Jonesboro Tupelo
Total Snowfall (MAR) : T T 4.0 T
Total Precipitation (MAR) : 3.38 3.85 2.09 4.33
Normal Precipitation (MAR) : 5.16 4.75 4.50 4.82
Departure from Normal (MAR) : -1.78 -0.90 -2.41 -0.49
Total Precipitation (YEAR) : 16.95 15.79 11.88 16.76
Normal Precipitation (YEAR) : 13.53 13.00 11.65 14.26
Departure from Normal (YEAR) : 3.42 2.79 0.23 2.50
Using the 1981-2012 set of normals, the following tables show rank, average temperature, departure, and its year of occurrence.
Top 10 coolest months of March:
MEMPHIS JACKSON
RNK AVG YR DEP RNK AVG YR DEP
1 69.0 2012 3.1 1 37.9 1960 -13.1
2 68.5 2007 2.6 2 42.4 1965 -8.6
3 68.0 1998 2.1 3 43.3 1969 -7.7
4 67.8 2005 1.9 4 44.4 2013 -6.6
4 67.8 2000 1.9 5 44.7 1958 -6.3
6 67.6 1921 1.7 6 45.3 1996 -5.7
7 67.4 1954 1.5 7 45.8 2001 -5.2
7 67.4 2006 1.5 8 45.9 1999 -5.1
7 67.4 1925 1.5 9 46.2 1962 -4.8
10 67.3 1986 1.4 10 46.4 1971 -4.6
JONESBORO TUPELO
RNK AVG YR DEP RNK AVG YR DEP
1 38.8 1960 -11.4 1 42.2 1960 -11.8
2 42.4 1915 -7.8 2 45.7 1965 -8.3
3 43.2 1965 -7.0 3 46.1 1947 -7.9
4 43.8 1906 -6.4 4 46.6 1931 -7.4
5 44.0 1896 -6.2 5 46.9 1969 -7.1
6 44.6 1958 -5.6 6 47.5 1941 -6.5
7 44.9 2013 -5.3 7 48.1 2013 -5.9
8 45.4 1978 -4.8 8 48.2 1971 -5.8
9 45.5 1924 -4.7 9 48.3 1996 -5.7
10 45.8 1912 -4.4 10 48.4 2001 -5.6
Significant Weather Events:
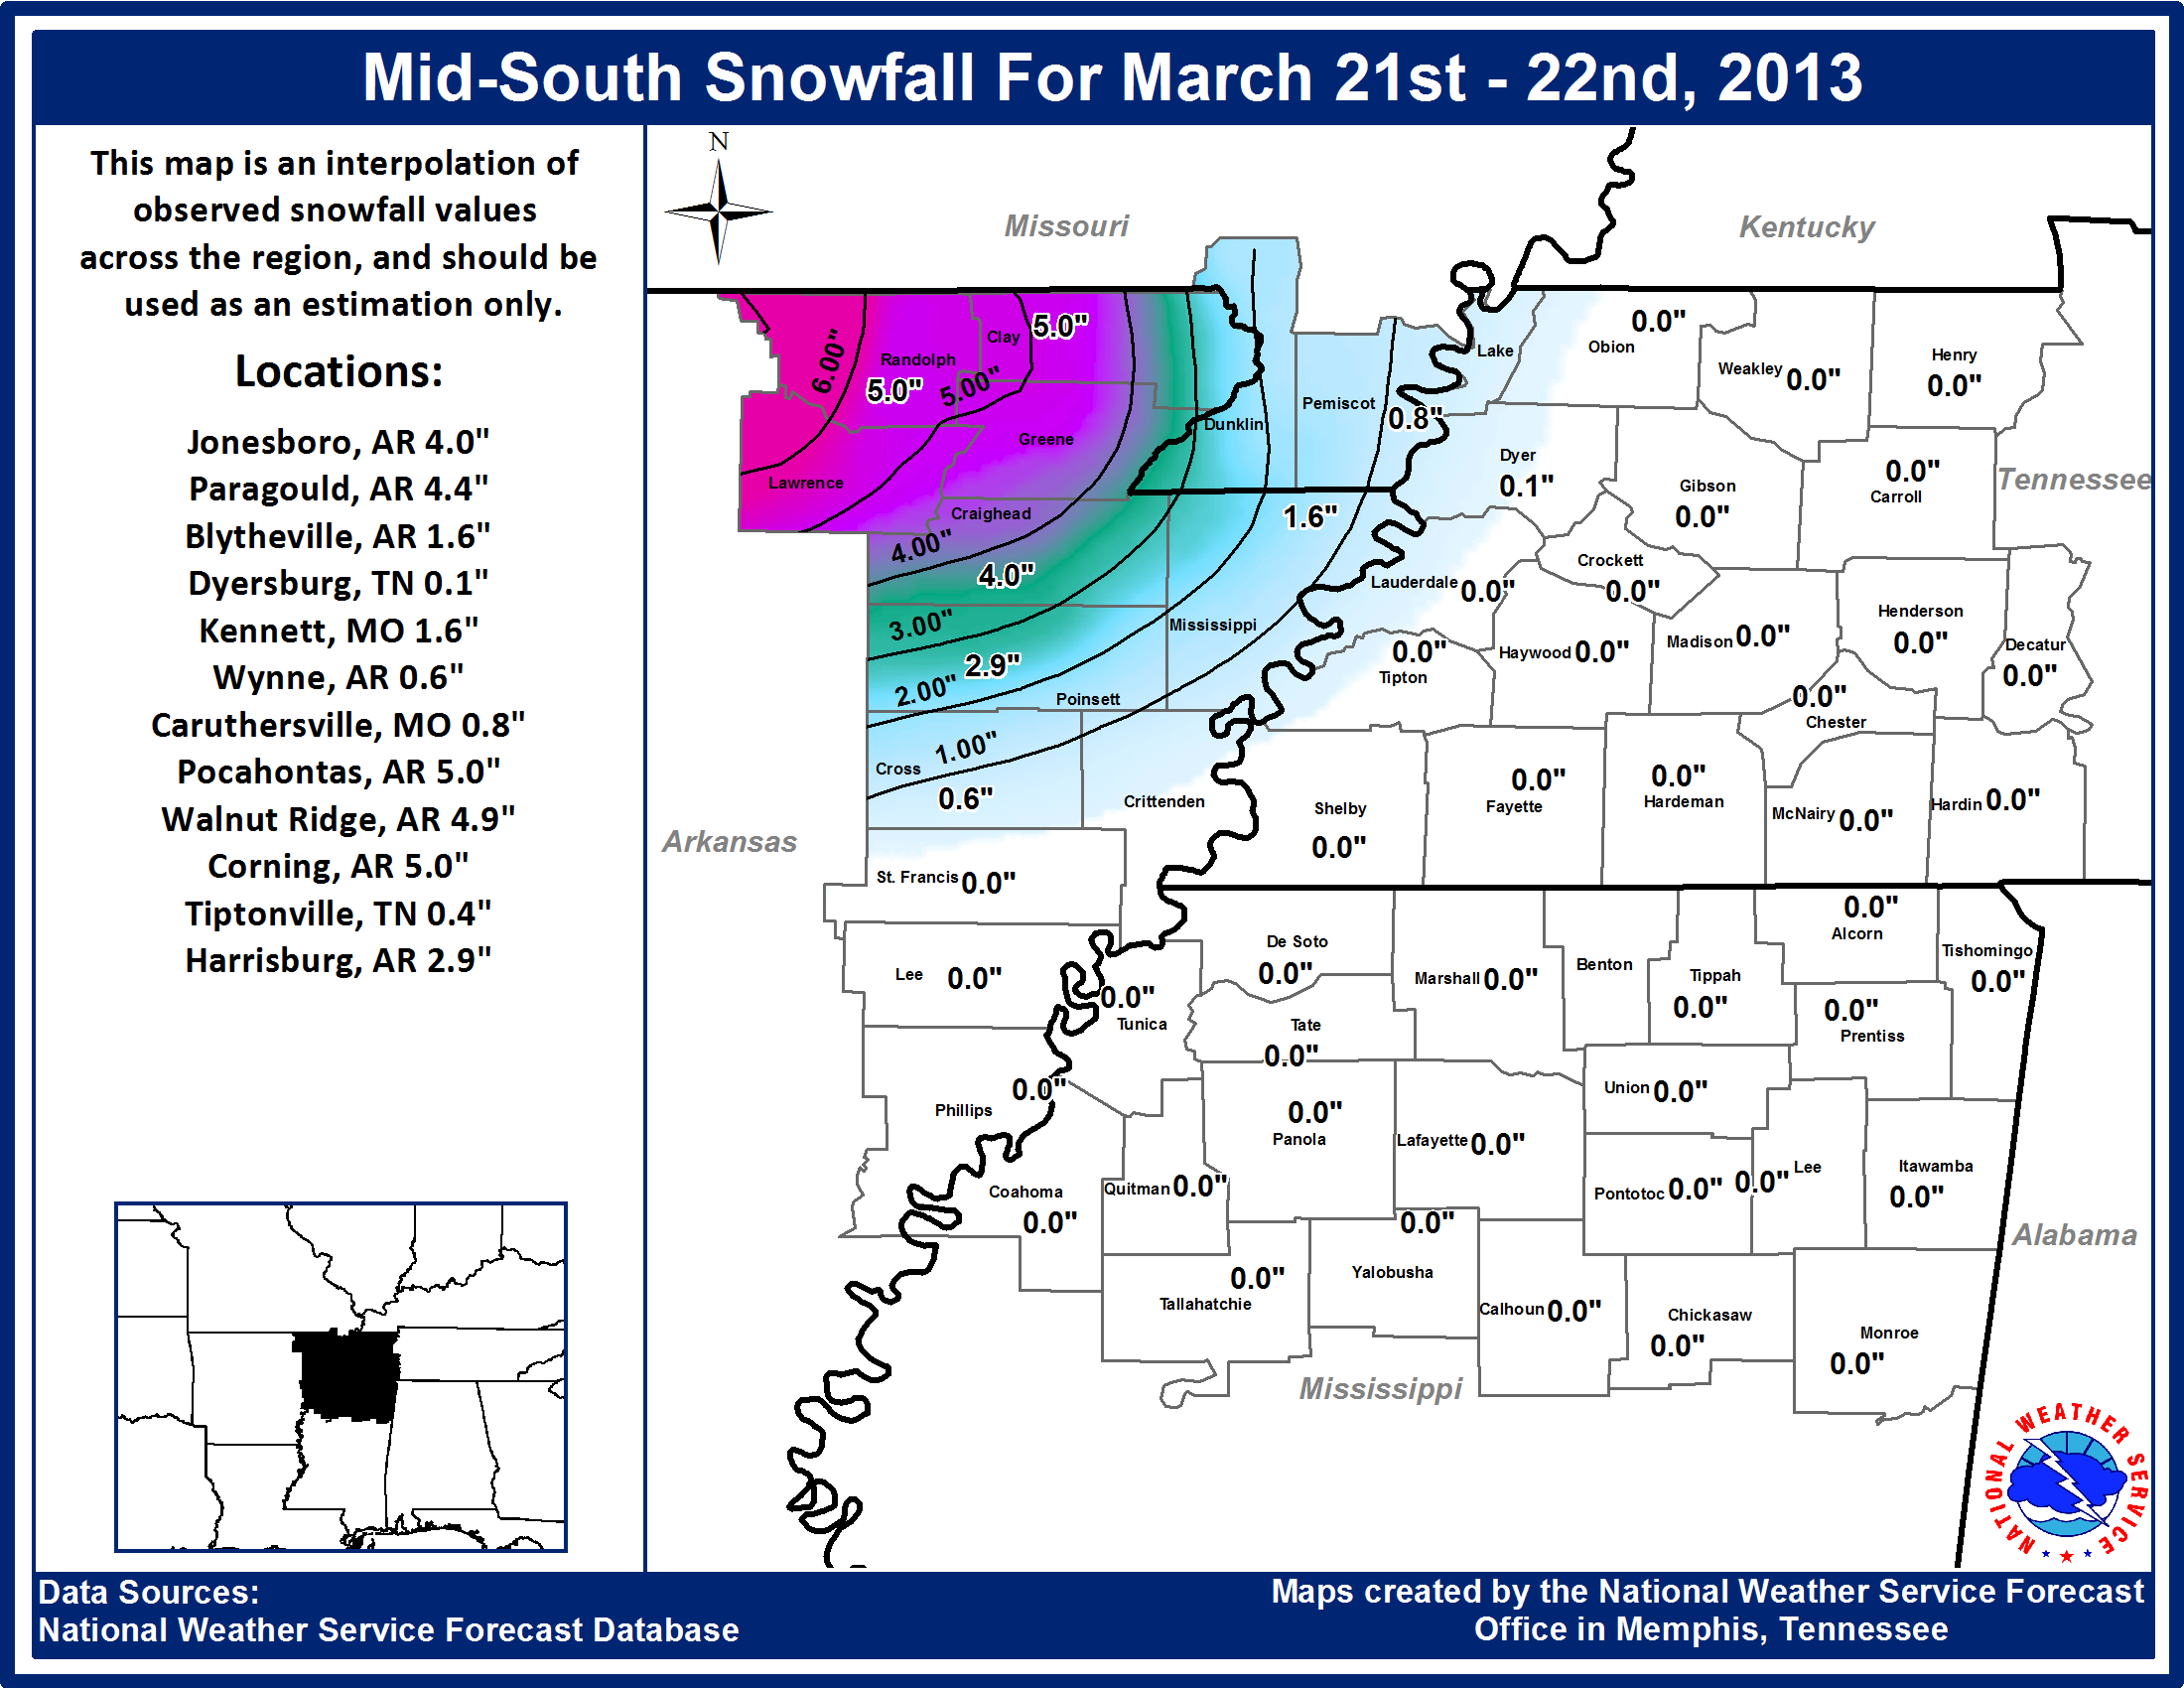
For MARCH 2013: There were a few Winter Weather events during the month of March. The month began with light snow showers across much of the Mid-South as an Alberta Clipper type upper level disturbance ushered in near or below freezing temperatures region wide. However, this system lacked substantial moisture, so very little to no accumulations was observed. The most significant snowfall was observed with a system that moved by the region on the evening of March 21st and lasted into the overnight hours of March 22nd. A strong surface low moved through the region ushering in moisture from the south. This moisture mixed with subfreezing temperatures above the surface provided ample conditions for snowfall. In the end, the majority of the snow fell across portions of northeast Arkansas and the Missouri Bootheel where accumulations of around 6-7 inches were observed. Elsewhere across west Tennessee and north Mississippi, little to no accumulation was recorded. Below is a snowfall graphic from that event.
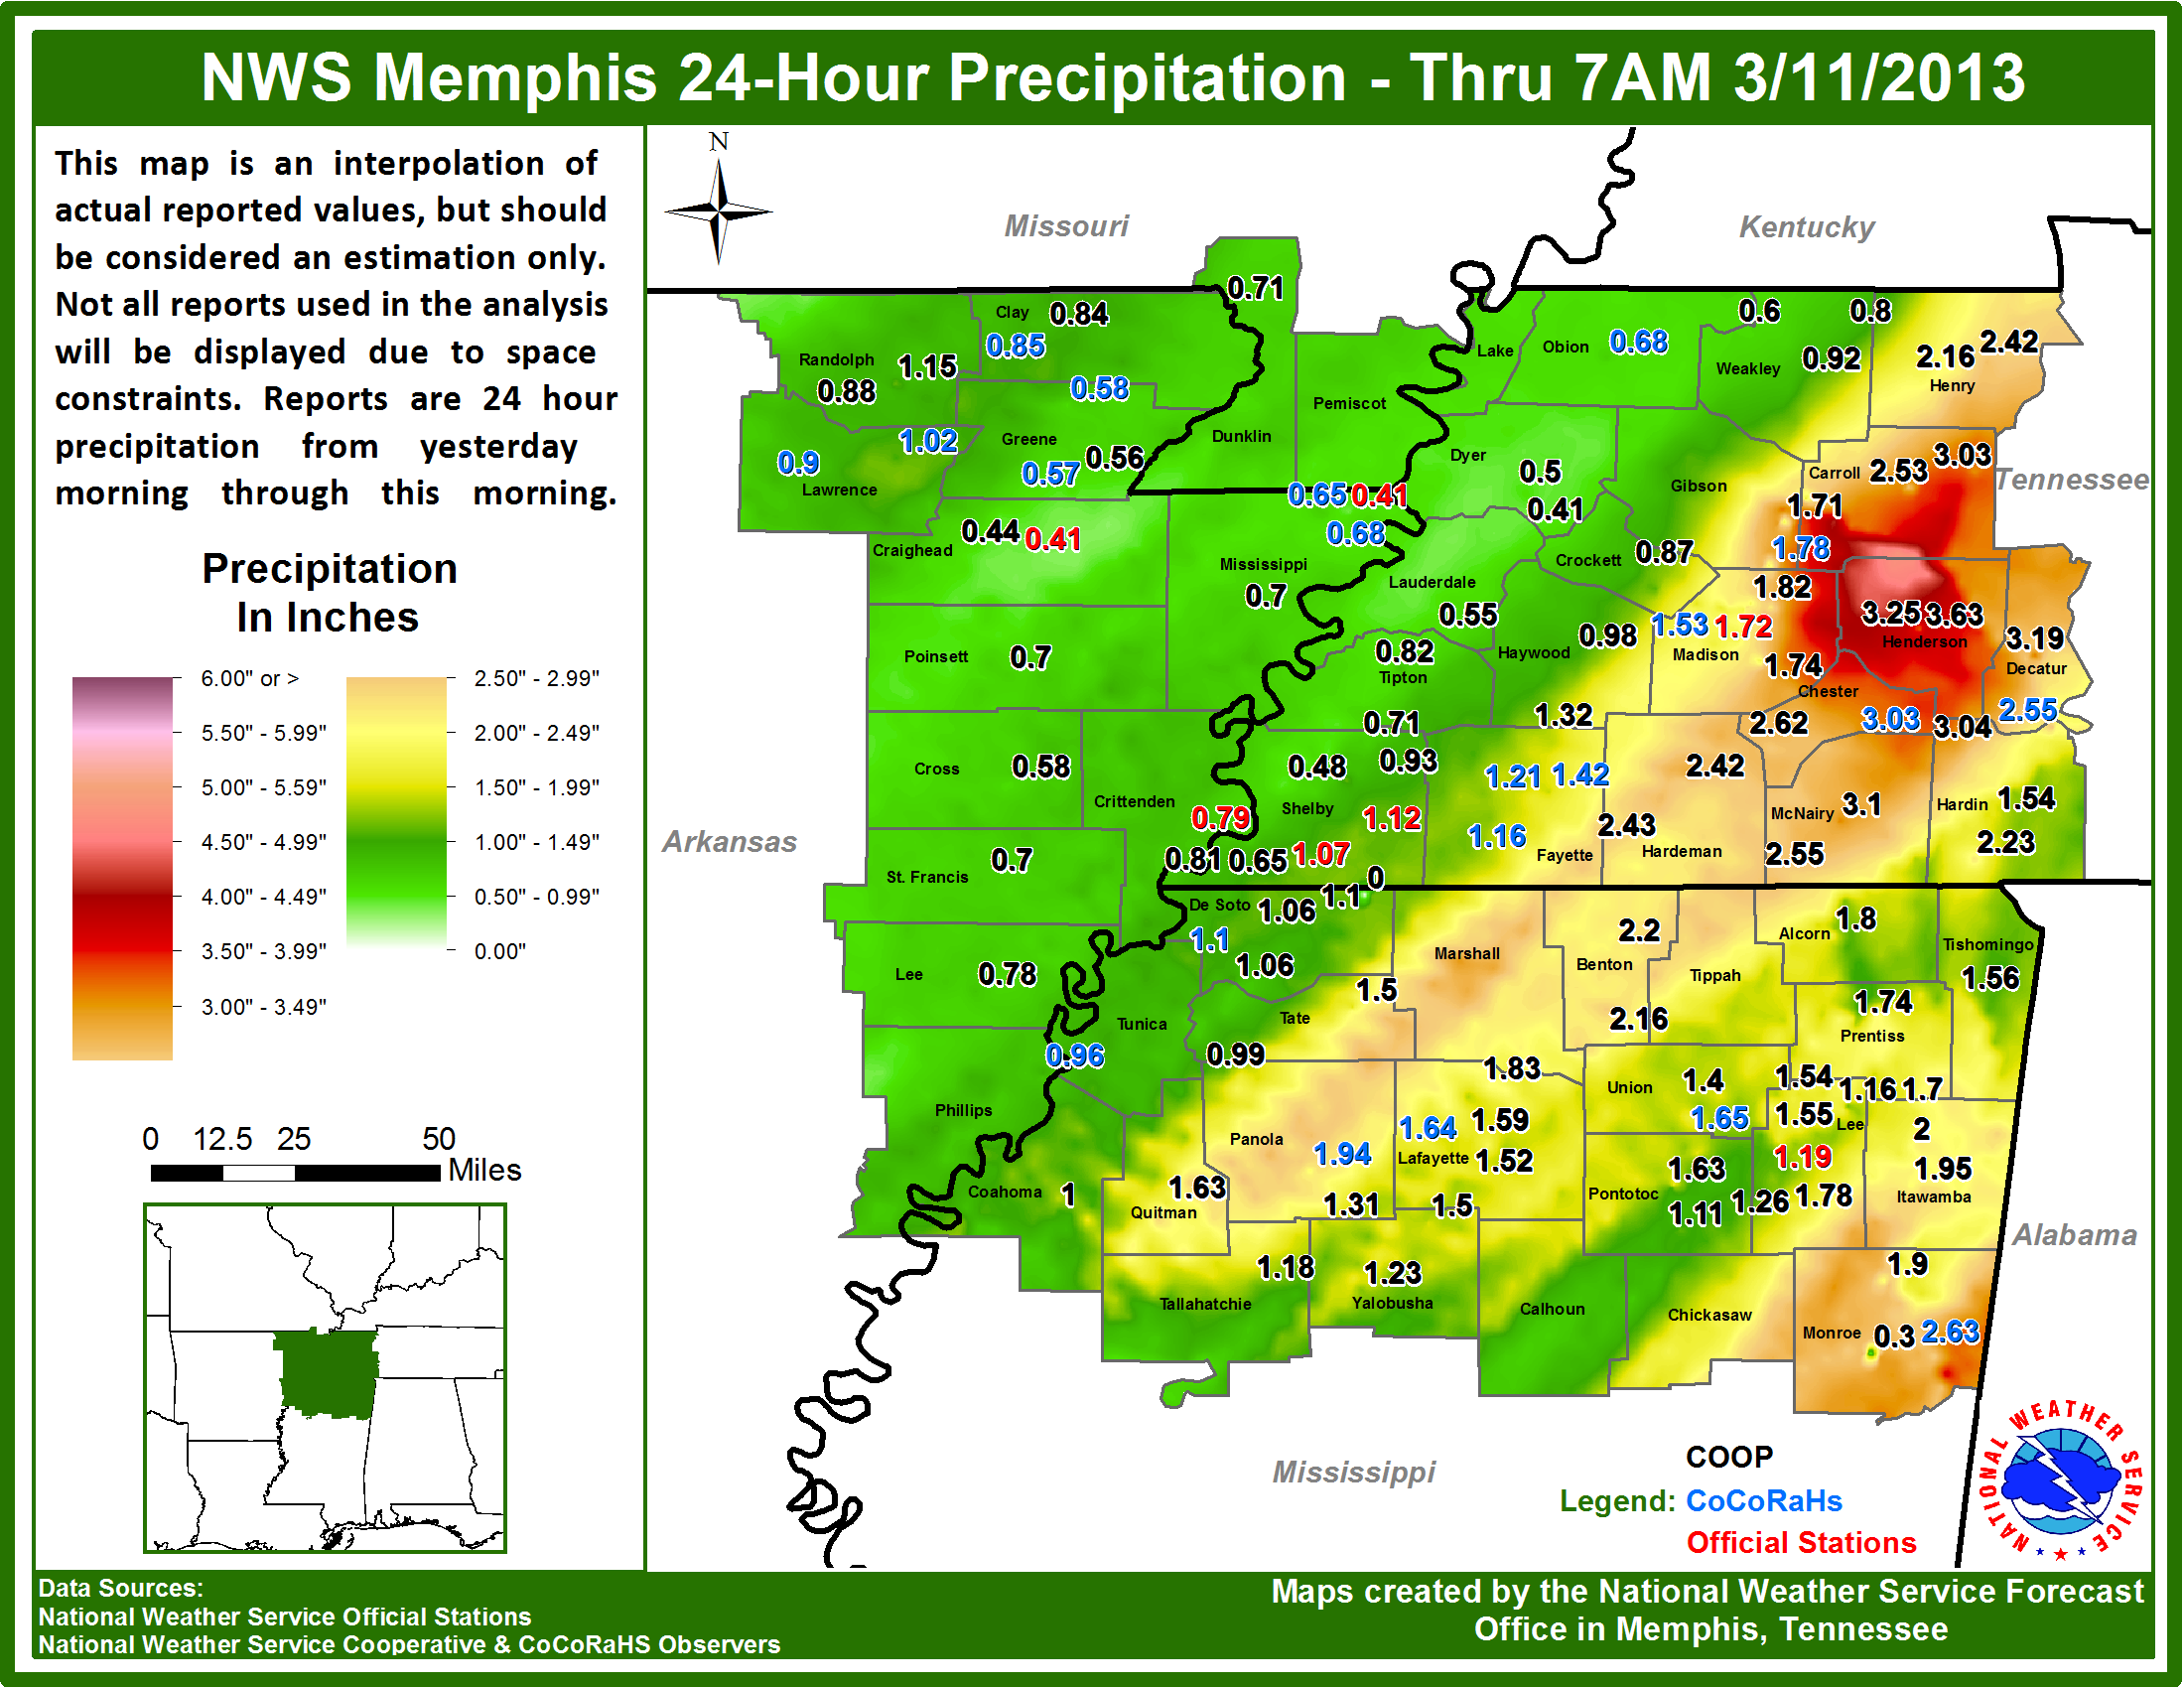
The month of March produced a couple significant severe weather events across the Mid-South region. While the magnitude of the severe weather in March of 2013 wasn’t that of years past, there were some impacts that were felt across certain areas in the region. The first severe weather event occurred early on the morning of March 11th were heavy rainfall had produced some significant flash flooding across portions of west Tennessee. Various reports of water covered roadways and standing water 6 inches deep were received by the National Weather Service. Below is a precipitation graphic from that 24 hour period. During the afternoon hours of March 18th, an upper level wave and an associated surface low had partnered to promote increasing low level moisture and ample lift across portions of north Mississippi. This led to increasing instability in this region allowing for the development of deep updrafts capable of producing significant hail and damaging wind gusts. Around 12:20PM that afternoon the first reports of wind damage were received. By that evening, all of the thunderstorm activity had moved east into Alabama, and the full magnitude of the event was realized. Multiple reports of wind damage and hail the size of ping pong balls were relayed to the National Weather Service by local spotters and emergency management officials across northeast Mississippi.
March 2013 Precipitation Graphics:


March 21st - 22nd, 2013 Snowfall Graphic:

March 10th - 11th, 2013 Precipitation Graphic:

CDG