Thunderstorms, some severe, may produce heavy to excessive rainfall and isolated flooding over portions of the Southern Plains today and Saturday. Dry conditions, combined with gusty winds and low relative humidities will continue to support an elevated to critical fire weather threat in the Desert Southwest into to early next week. Read More >
...JUNE 2014 MONTHLY CLIMATE SUMMARY...
June was quite an active weather month for the Mid-South, beginning with a couple of tornadoes and ending with flash flooding. This is evident in the climate data for the month with all sites exceeding their June precipitation normals.
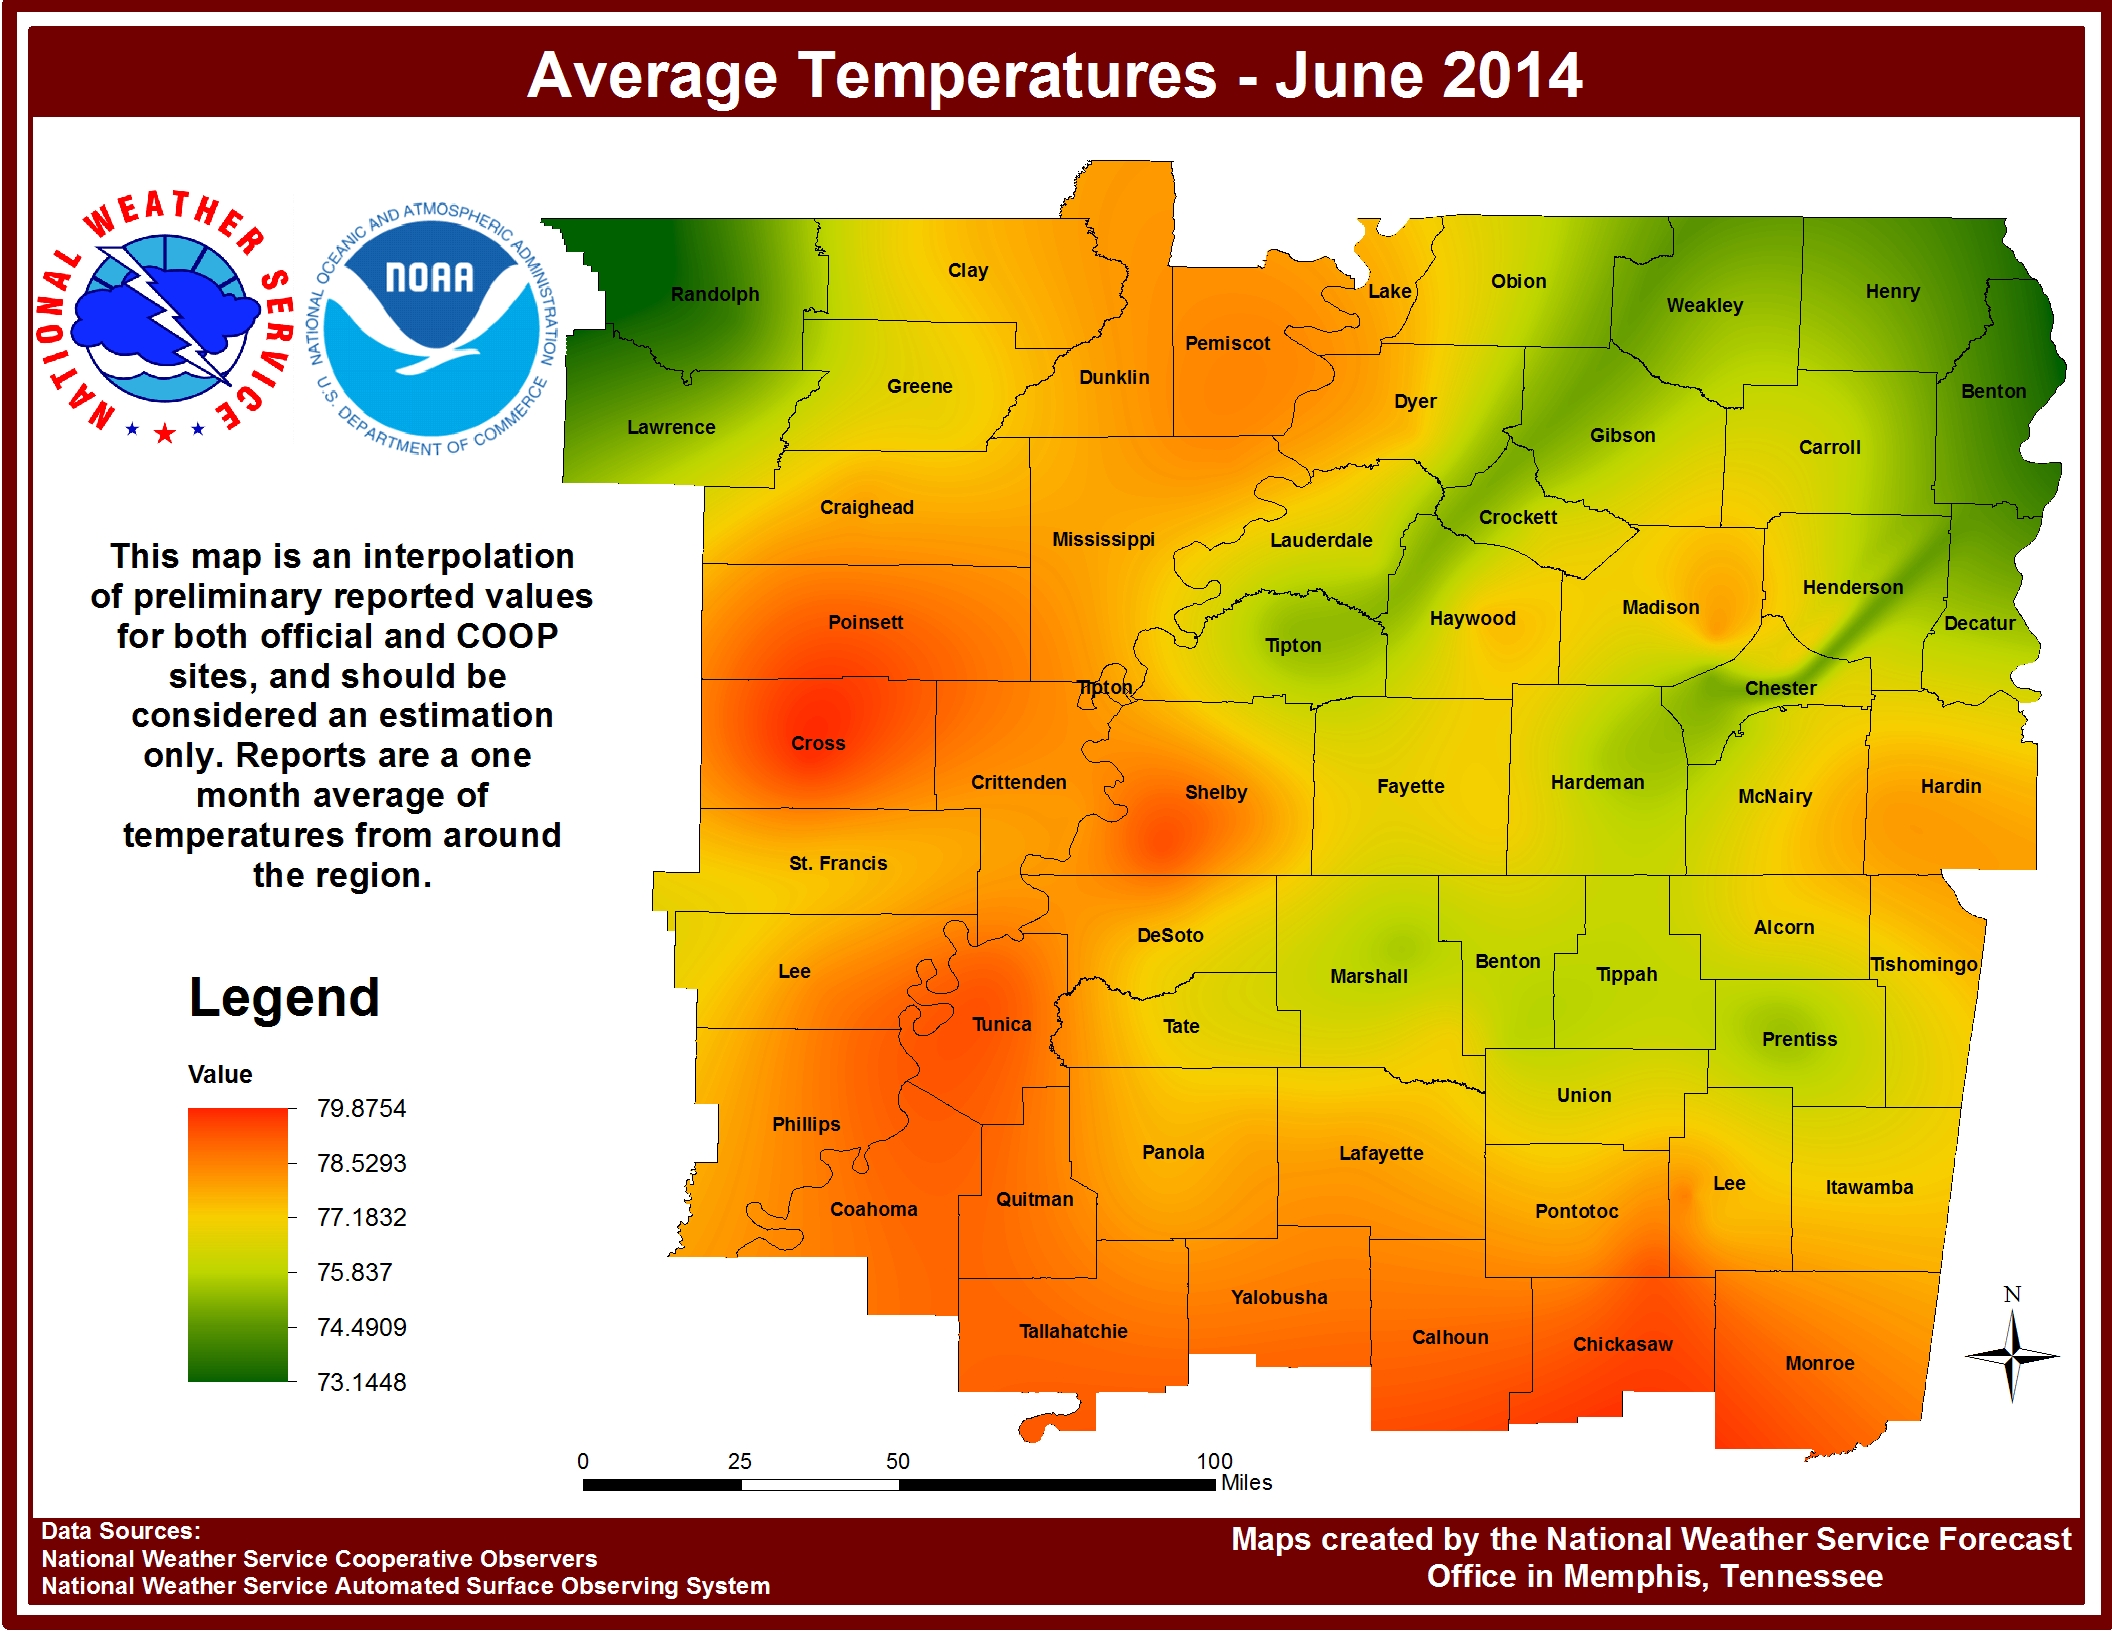
Memphis wears a couple of crowns this month being both the warmest and wettest site. It was also the only site this month with a below normal average temperature, albeit only by 0.3 degrees. Tupelo was the second warmest site and had a temperature that was only 0.7 degrees above normal. Jonesboro actually hit its normal average temperature exactly at 77.8 degrees, while Jackson was 0.7 degrees above its normal. So far for the year Jonesboro has the largest departure from normal with a current average temperature of 53.0 degrees, only 3.0 degrees below normal. Memphis is currently 2.6 degrees below normal for the year, while Jackson and Tupelo are 2.4 degrees and 2.3 degrees below normal, respectively.
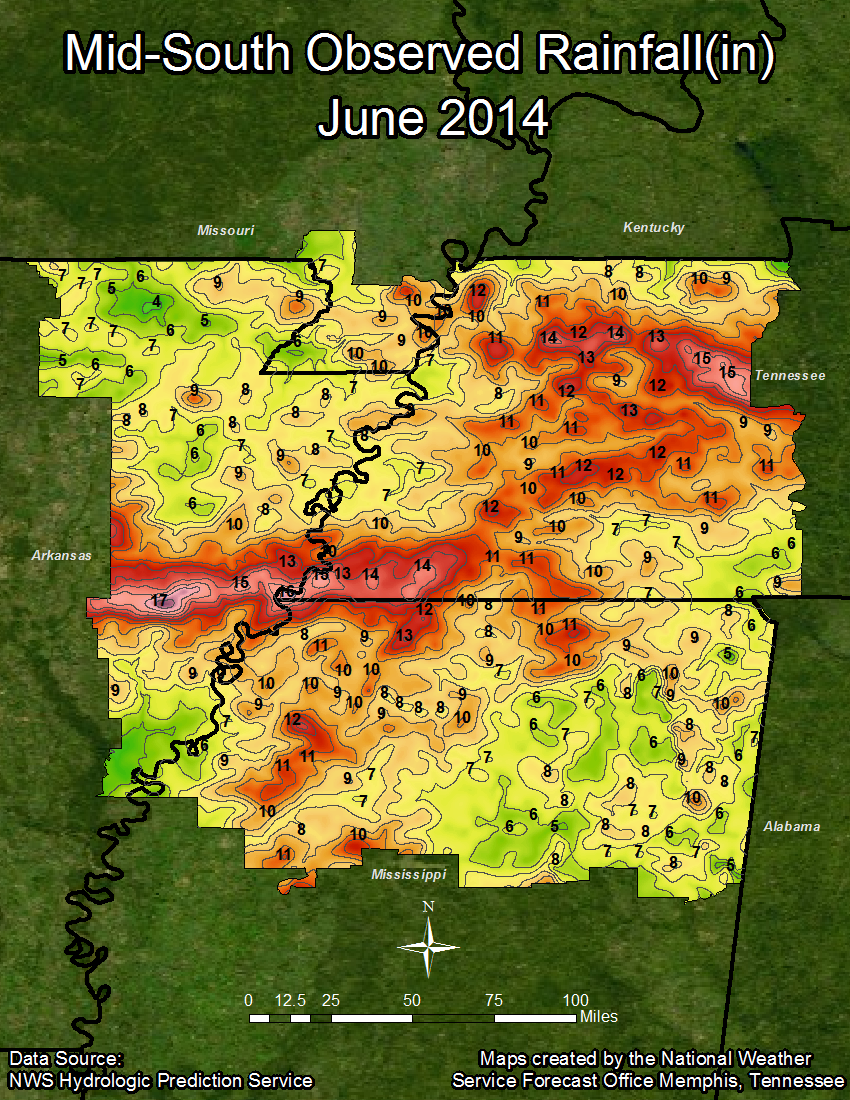
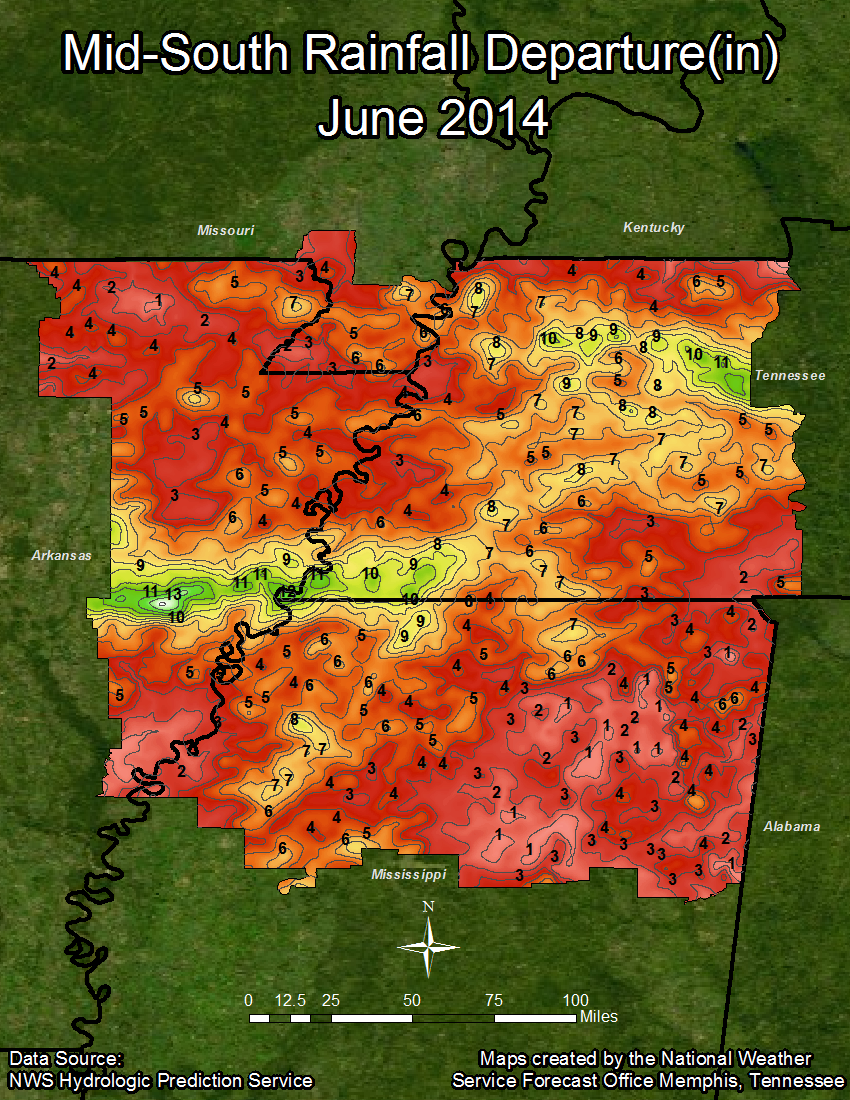
Precipitation is the big story this month. The first weekend of the month brought high precipitation totals to the area as we had a few rounds of severe weather while in a northwest flow pattern aloft, but it was the last weekend of the month that put the icing on the cake. Memphis received 13.40 inches of precipitation this month, not only making it the wettest site, but also making June 2014 the second wettest June on record for Memphis. Memphis has received 141 percent of its normal precipitation for being halfway through the year with nearly 40 inches of precipitation since the beginning of the year, which also makes Memphis the wettest official site so far for the year. Jackson received 12.59 inches of precipitation during June, nearly 8 inches above normal. During the first half of 2014 Jackson received 34.60 inches of precipitation, or 122 percent of its normal precipitation for the first six months of the year. Jonesboro was not quite as wet as Jackson and Memphis during June, although it did still receive 5.09 inches of precipitation above its June normal. Jonesboro is also 5.09 inches above normal for the year so far, having received 30.12 inches of precipitation in 2014. Tupelo was the driest site this month, but that’s not saying anything, it was still wet. 8.34 inches of precipitation fell at Tupelo Regional Airport, which was 3.82 inches above normal. Tupelo is the only site that has a below normal precipitation total for the year, having received 28.52 inches of precipitation, only 0.60 inches below normal. While the heavy amounts of precipitation did cause flash flood events, they also aided in the eradication of D0 drought conditions in parts of west Tennessee and northeast Mississippi.
Since all four sites broke at least one record this month for precipitation, a full summary of notable records follows the climate data. Additionally, the top ten wettest months of June for each site are also included for reference.
TEMPERATURE DATA:
Memphis Jackson Jonesboro Tupelo
Average Temperature (MONTH) : 79.3 76.9 77.8 78.8
Normal Avg. Temp (MONTH) : 79.6 76.2 77.8 78.1
Departure from Normal (MONTH): -0.3 0.7 0.0 0.7
Average Temperature (YEAR) : 56.6 53.7 53.0 56.5
Normal Avg. Temp (YEAR) : 59.2 56.1 56.0 58.8
Departure from Normal (YEAR) : -2.6 -2.4 -3.0 -2.3
Maximum Temperature : 94.0 92.0 93.0 94.0
Minimum Temperature : 62.0 53.0 56.0 62.0
PRECIPITATION DATA:
Memphis Jackson Jonesboro Tupelo
Total Precipitation (MONTH) : 13.40 12.59 8.84 8.34
Normal Precipitation (MONTH) : 3.63 4.84 3.75 4.52
Departure from Normal (MONTH): 9.77 7.75 5.09 3.82
Total Precipitation (YEAR) : 39.36 34.60 30.12 28.52
Normal Precipitation (YEAR) : 27.91 28.38 25.03 29.12
Departure from Normal (YEAR) : 11.45 6.22 5.09 -0.60
Percent of Normal (YEAR) : 141% 122% 120% 98%
Notable Records:
Memphis
2nd Wettest June (2014) – 13.40”
7th Wettest Day (June 29 2014)- 5.87”
8th Wettest Month (June 2014)- 13.40”
Jackson
1st Wettest June (2014)- 12.59”
6th Wettest Month (June 2014)- 12.59”
Jonesboro
3rd Wettest June (2014)- 8.84”
Tupelo
7th Wettest June (2014)- 8.34”
Top Ten Wettest Months of June:
Memphis Jackson
1 18.16" 1877 1 12.59" 2014
2 13.40" 2014 2 11.07" 1992
3 11.45" 1900 3 9.68" 1997
4 10.17" 1996 4 9.15" 1949
5 8.06" 1886 5 8.75" 1989
6 7.50" 1992 6 8.01" 1974
7 7.39" 1889 7 7.40" 2010
8 7.27" 1884 8 7.25" 1990
9 7.20" 1989 9 7.17" 1986
10 6.88" 1951 10 7.03" 1957
Jonesboro Tupelo
1 11.02" 1928 1 11.37" 1997
2 9.74" 1945 2 11.08" 1989
3 8.84" 2014 3 10.22" 1939
4 8.22" 1935 4 9.52" 1957
5 8.08" 1900 5 8.71" 1996
6 7.74" 1992 6 8.63" 2004
7 7.38" 1942 7 8.34" 2014
8 7.27" 1960 8 7.79" 1935
9 6.99" 1927 9 7.11" 1992
10 6.93" 1948 10 6.94" 1999
Climate Outlook:
While June was abnormally wet, the Climate Prediction Center (CPC) is currently predicting precipitation totals for July to have a 36 percent chance of being below normal, 33 percent chance of being near normal, and a 31 percent chance of being above normal. This suggests chances being a bit greater for below normal totals, yet there is not a lot of certainty being relayed with such similar percentages. Similarly, the prediction for temperatures for the month of July is equal chances, which means there is no clear climate signal to indicate what temperatures may be. However, for the three month period spanning July, August, and September the CPC has predicted a 43 percent chance of temperatures being above normal, a 32 percent chance of temperatures being near normal, and a 25 percent chance for temperatures that are below normal. Combined this gives nearly a 75 percent chance of temperatures during this period being near or above average across the Mid-South. The prediction for precipitation during this period is equal chances. Either way, we are entering our warmest months of the year so temperatures are sure to be high. Remember to monitor daily high temperatures and heat index values, and to hydrate if you are going to be outdoors.
MAYE
Watch a presentation of this summary now on our YouTube channel.
June 2014 Average Temperatures:

June 2014 Precipitation Graphics:

