...JULY 2014 MONTHLY CLIMATE SUMMARY...
In a word, July 2014 was unusual. Normally the month with the highest average temperatures of all twelve months, July 2014 experienced average temperatures that actually fell behind June’s, making June warmer than July. These low average temperatures for the month were the results of several daily records being broken throughout the month, and they ultimately led to some of the coolest months of July ever for our four official climate sites.
Jackson had the lowest average temperature of all four sites this month and also recorded the lowest temperature with 74.1 degrees and 53 degrees, respectively. Jackson had a 5.4 degree departure below its July normal because of this. Jonesboro had the greatest departure below normal at 5.5 degrees below, and was the second coolest site for the month. Tupelo was 4.9 degrees below normal, making it the third coolest, while Memphis was 4.7 degrees below normal, the fourth coolest site... or perhaps the warmest? Memphis did record the highest temperature of any official site with 95 degrees. Jackson, Jonesboro, and Tupelo all had their coolest July on record this month, while Memphis had its sixth coolest on record. The top ten coolest months of July are listed for each site below the monthly data. For the year so far, inclusive of January through July, all four sites are around 3 degrees below normal. To make the climate of July even more compelling, the year 2014 is currently the coolest on record for Jackson, the second coolest for Jonesboro, the fourth coolest for Tupelo, and the eleventh coolest for Memphis when considering the months from January through July.
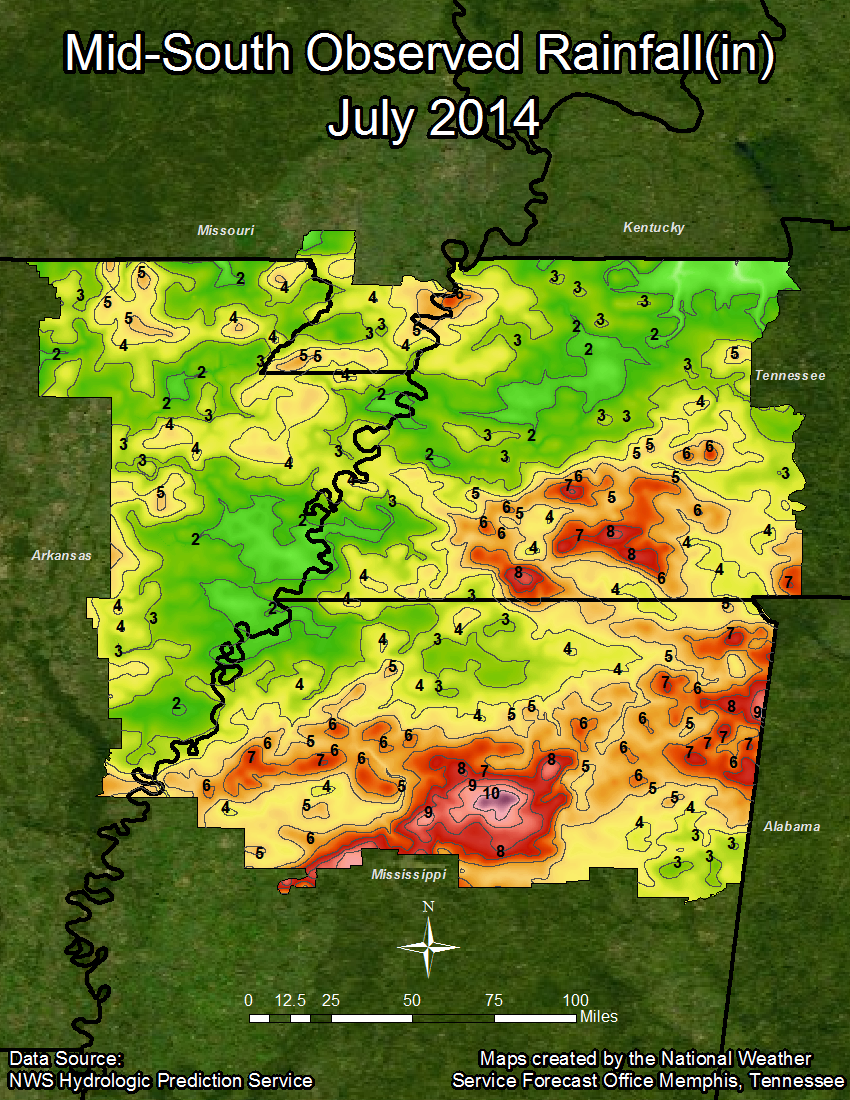
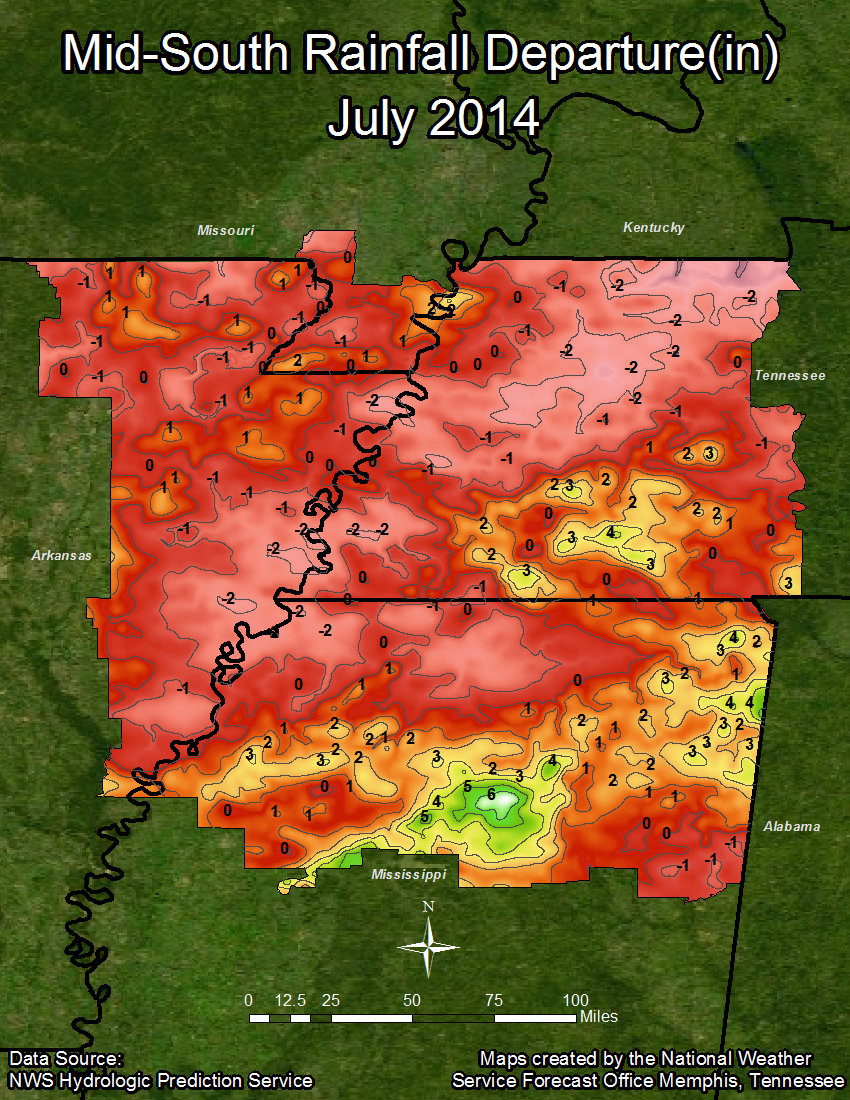
Unlike the months prior, specifically the abnormally wet June, July had precipitation totals for three sites that were below normal. Tupelo was the only site with an above normal precipitation total this month with just over 6 inches, which was over 2 inches above normal. Jackson was the second wettest site this month with 3.79 inches, only 0.70 inches below normal, while Memphis was 2.03 inches below normal at 2.56 inches of precipitation. Jonesboro was the driest site this month with only 1.99 inches, 1.55 inches below normal. Despite these below normal totals, all four sites are still above normal for the year so far, with Memphis still leading the way having received nearly 42 inches of precipitation in 2014, which is 129% of what is normally received at this point in the year. Jackson is the second wettest site for the year with 38.39 inches, or 117% of normal, while Tupelo has received nearly 35 inches of precipitation so far in the year 2014, 105% of its normal. Finally, Jonesboro has received just over 32 inches of precipitation for the year, which is 112% of its January through July normal.
TEMPERATURE DATA:
Memphis Jackson Jonesboro Tupelo
Average Temperature (MONTH) : 78.0 74.1 75.3 76.5
Normal Avg. Temp (MONTH) : 82.7 79.5 80.8 81.4
Departure from Normal (MONTH): -4.7 -5.4 -5.5 -4.9
Average Temperature (YEAR) : 59.6 56.7 56.2 59.4
Normal Avg. Temp (YEAR) : 62.5 59.4 59.5 62.0
Departure from Normal (YEAR) : -2.9 -2.7 -3.3 -2.6
Maximum Temperature : 95.0 93.0 93.0 94.0
Minimum Temperature : 62.0 53.0 57.0 58.0
PRECIPITATION DATA:
Memphis Jackson Jonesboro Tupelo
Total Precipitation (MONTH) : 2.56 3.79 1.99 6.06
Normal Precipitation (MONTH) : 4.59 4.49 3.54 3.90
Departure from Normal (MONTH): -2.03 -0.70 -1.55 2.16
Total Precipitation (YEAR) : 41.92 38.39 32.11 34.58
Normal Precipitation (YEAR) : 32.50 32.87 28.57 33.02
Departure from Normal (YEAR) : 9.42 5.52 3.54 1.56
Percent of Normal : 129% 117% 112% 105%
Top Ten Coolest Months of July:
Memphis Jackson
1 77.0°F 1891 1 74.1°F 2014
2 77.2°F 1906 2 75.6°F 2009
3 77.6°F 1882 3 75.7°F 1967
4 77.7°F 1967 4 76.6°F 2013
5 77.9°F 1905 5 77.2°F 2004
6 78.0°F 2014 6 77.6°F 1970
7 78.1°F 1904 7 77.7°F 1972
8 78.4°F 1894 77.7°F 2000
9 78.5°F 1895 8 77.9°F 1950
78.5°F 1940 77.9°F 1971
Jonesboro Tupelo
1 75.3°F 2014 1 76.5°F 2014
2 77.3°F 1994 2 76.6°F 1967
77.3°F 2009 3 77.7°F 1972
3 77.4°F 1911 4 77.8°F 1994
4 77.5°F 1950 5 77.9°F 1976
5 77.8°F 1918 6 78.3°F 2009
6 78.0°F 1967 7 78.4°F 1947
78.0°F 2004 8 78.5°F 1975
7 78.2°F 1906 9 78.6°F 1970
78.2°F 1915 10 78.7°F 1950
Climate Outlook:
For the month of August the Climate Prediction Center (CPC) is forecasting equal chances for temperature and precipitation. This indicates there is no clear climate signal upon which to base a forecast in either direction, either above or below normal. This does not indicate that temperatures and/or precipitation will be near normal, it simply means all three categories have equal chances of occurring. For the months of August, September, and October combined the prediction is also for equal chances for both temperature and precipitation. However, an El Niño Watch is still in effect as an El Niño event is expected to occur into the later Fall months. Recently the impacts of an El Niño event on temperature and precipitation were studied by our office, and those findings, as well as findings about La Niña and ENSO-neutral impacts, will be released later this month. We hope this will bring a better insight as to what changes may occur to our climate given an El Niño, La Niña, or ENSO-neutral event.
MAYE
Precipitation Graphics: