...JANUARY 2013 MONTHLY CLIMATE SUMMARY...
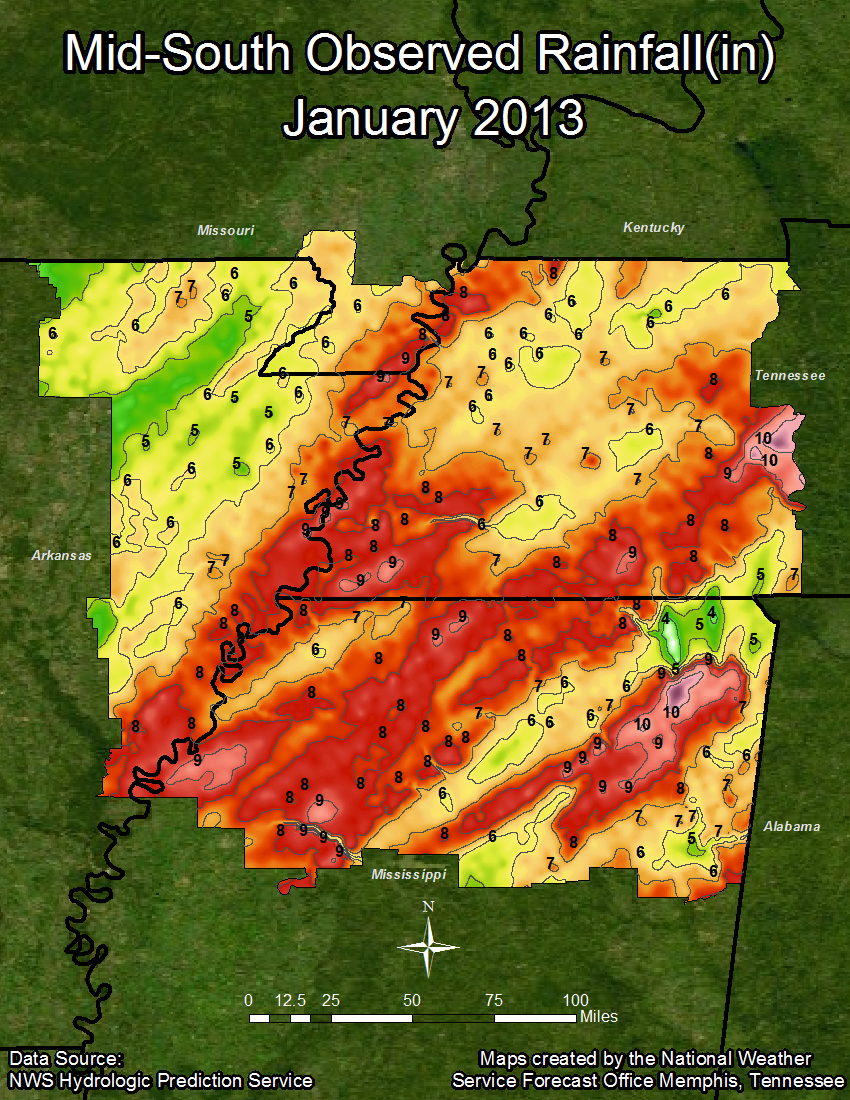
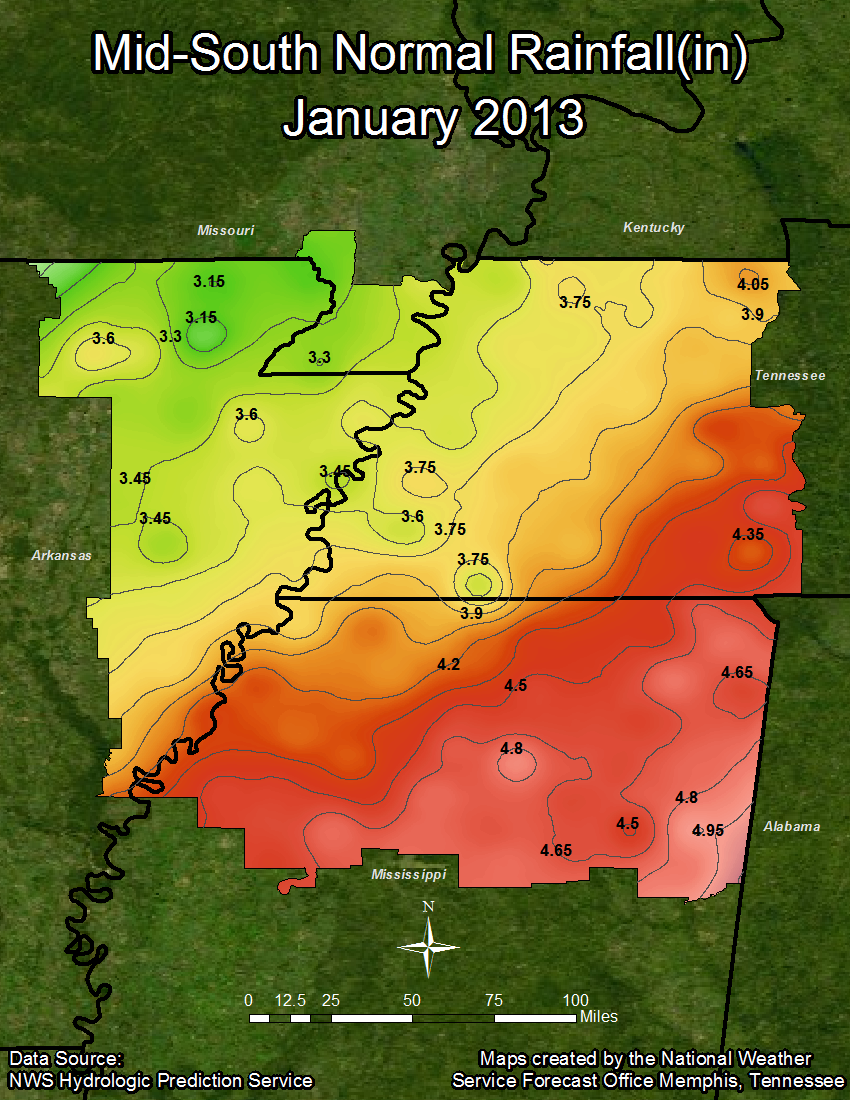
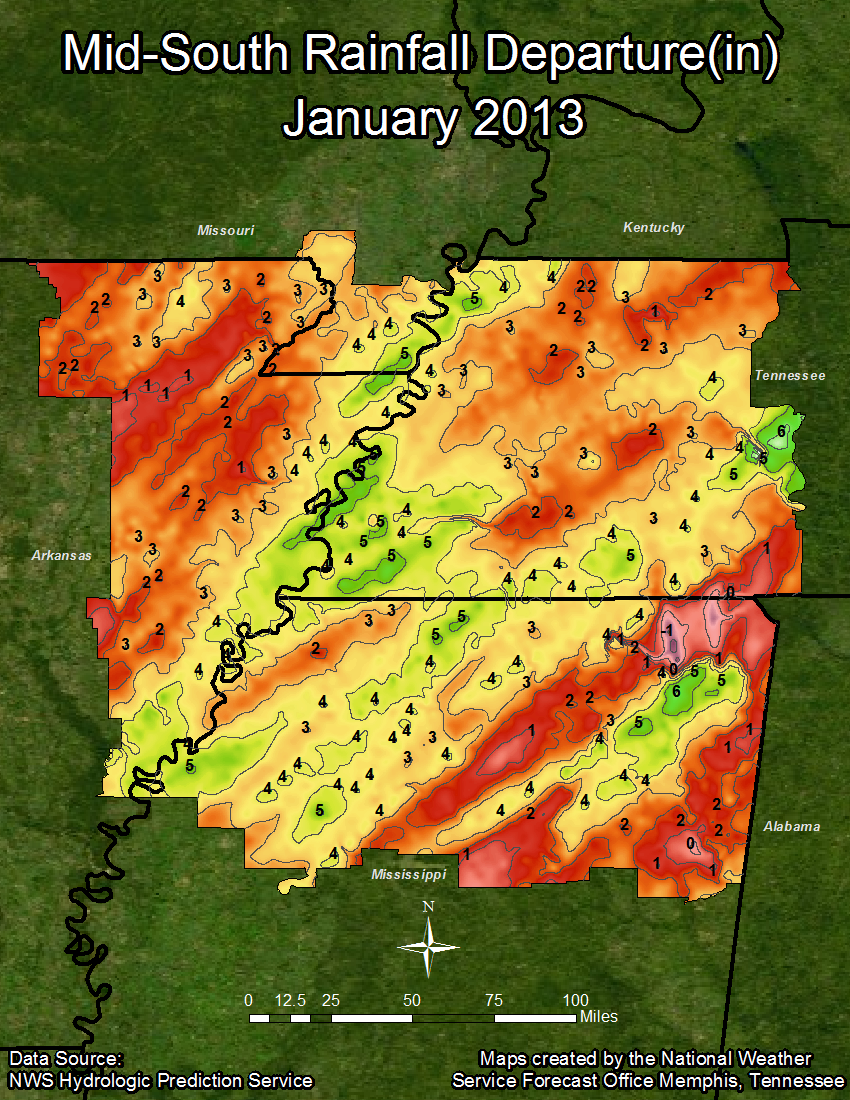
January 2013 yielded above normal temperatures and precipitation across the majority of the Mid-South region. Tupelo had the highest average temperature and departure from normal at 46.0 and 4.3 degrees, respectively. Jackson came in with the second highest departure from normal at 3.9 degrees, while Memphis and Jonesboro were tied at 3.7 degrees above normal. As for precipitation, the highest amounts were observed in the Memphis area with the airport recording 9.72 inches, which was 5.74 inches above normal. As for total precipitation at the remaining sites, Tupelo was the next highest at 8.71 inches, followed by Jackson at 8.29 inches, and lastly Jonesboro at 5.37 inches. For the month of January, Jackson and Tupelo ranked number 8 and number 10 respectively, for all time total precipitation. There was measurable snowfall at all four official climates sites in January with Jackson seeing 0.8 inches, 0.5 inches at Jonesboro, and a trace at Memphis and Tupelo. Below is the climate data that tells the story:
Temperature Data:
Memphis Jackson Jonesboro Tupelo
Average Temperature (JAN) : 44.9 42.1 41.2 46.0
Normal Avg. Temp (JAN) : 41.2 38.2 37.5 41.7
Departure from Normal (JAN) : 3.7 3.9 3.7 4.3
Average Temperature (YEAR) : 44.9 42.1 41.2 46.0
Normal Avg. Temp (YEAR) : 41.2 38.2 37.5 41.7
Departure from Normal (YEAR): 3.7 3.9 3.7 4.3
Precipitation Data:
Memphis Jackson Jonesboro Tupelo
Total Precipitation (JAN) : 9.72 8.29 5.37 8.71
Normal Precipitation (JAN) : 3.98 4.07 3.43 4.48
Departure from Normal (JAN) : 5.74 4.22 1.94 4.23
Total Precipitation (YEAR) : 9.72 8.29 5.37 8.71
Normal Precipitation (YEAR) : 3.98 4.07 3.43 4.48
Departure from Normal (YEAR) : 5.74 4.22 1.94 4.23
Using the 1981-2012 set of normals, the following tables show rank, average temperature, departure, and its year of occurrence.
Top 10 wettest Januarys:
MEMPHIS JACKSON
RNK AVG YR DEP RNK AVG YR DEP
1 17.56 1937 13.58 1 17.46 1950 13.39
2 15.94 1950 11.96 2 10.98 1951 6.91
3 12.87 1882 8.89 3 10.65 1957 6.58
4 12.21 1951 8.23 4 10.50 1954 6.43
5 12.14 1930 8.16 5 9.32 1949 5.25
6 11.87 1932 7.89 6 8.74 1989 4.67
7 11.39 1957 7.41 7 8.50 1974 4.43
8 10.79 1954 6.81 8 8.29 2013 4.22
9 10.72 1898 6.74 9 7.55 2006 3.48
10 9.94 1949 5.96 10 7.41 1999 3.34
JONESBORO TUPELO
RNK AVG YR DEP RNK AVG YR DEP
1 18.95 1937 15.52 1 15.24 1949 10.76
2 11.79 1930 8.36 2 14.81 1974 10.33
3 11.19 1950 7.76 3 12.41 1937 7.93
4 10.32 1932 6.89 4 12.2 1951 7.72
5 9.78 1916 6.35 5 11.58 1999 7.10
6 9.25 1898 5.82 6 11.28 1979 6.80
7 9.08 1949 5.65 7 10.43 1946 5.95
8 8.35 1899 4.92 8 9.57 1957 5.09
9 8.27 1969 4.84 9 8.99 1932 4.51
10 8.25 1966 4.82 10 8.71 2013 4.23
Significant Weather Events:
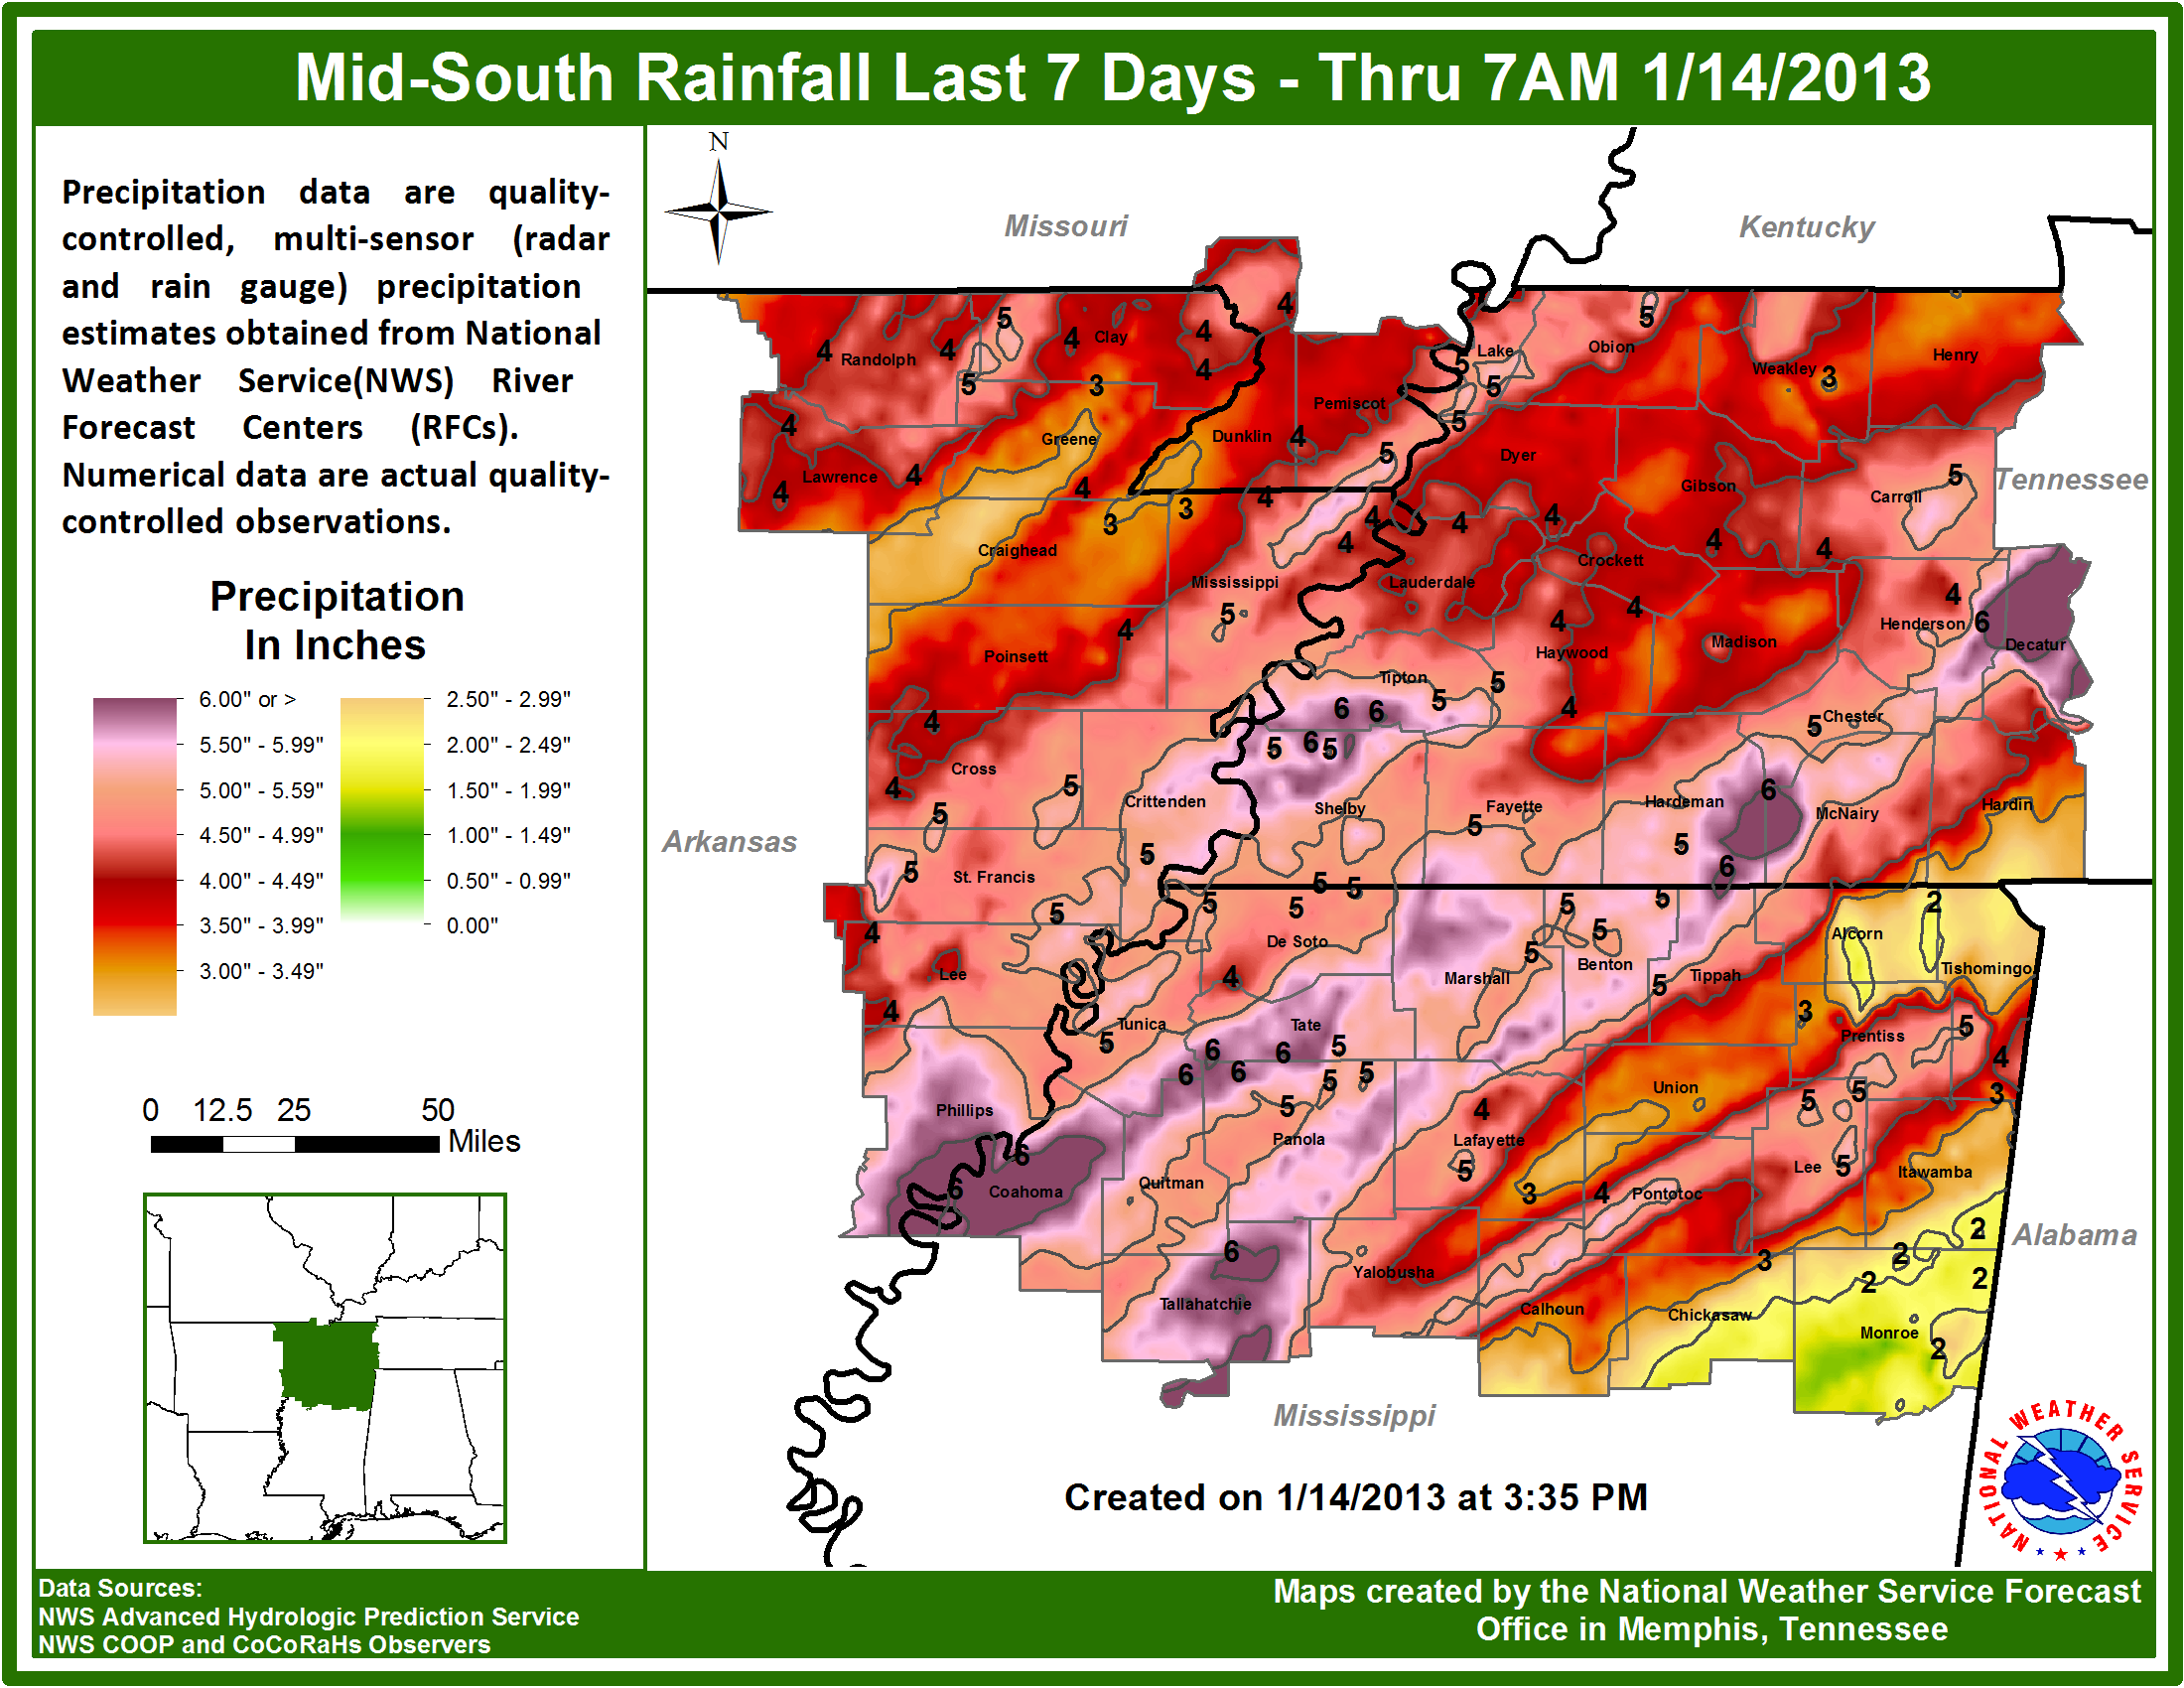
For January 2013: 7 days’ worth of intense rainfall occurred across the Mid-South as a strong upper low moved through the region. Ahead of the upper low, strong warm air advection prompted shower and thunderstorm activity beginning on the 8th and continuing through the 12th. Immediately following the passage of the upper low, a strong cold front pushed into the region on Saturday January 13th. The front slowly made its way through the region on Saturday and through Sunday before stalling just to the southeast. Rainfall received during this period was in excess of 6 inches in some places with average rainfall in the 3-4 inch range. Behind the front on Monday, temperatures dropped to below freezing levels. This combined with the same front, retrograding back over the region prompted freezing rain across portions of the Mid-South along and south of I-40 for Monday evening. More wintry precipitation was expected to move in on Tuesday January 15th as temperatures remained at or below freezing. The main threats were to be snow, sleet and freezing rain, all of which verified with a quarter inch of ice accumulation in Memphis, and upwards of 3 inches of snow across portions of northeast Arkansas.
On January 29th, a strong cold front pushed through the region. The Storm Prediction Center had placed the entire Mid-South region in the Moderate Risk Category for severe weather. As the front approached, a broken line of showers and thunderstorms developed across northeast Arkansas and the Missouri Bootheel. Meanwhile, further south in a more favorable environment, a few discrete supercells developed across portions on North Mississippi. As the evening progressed, the line congealed into a more solid squall line and produced multiple reports of wind damage across eastern Arkansas and the Missouri Bootheel. After midnight on the 30th, the line had moved east of the Mississippi River and the supercells continued pushing across northeast Mississippi and into west Tennessee. Numerous Severe Thunderstorm and Tornado warnings were issued for the squall line and supercells, respectively. National Weather Service Damage Survey teams were dispatched the following morning to Hardeman, McNairy, and Henderson Counties in west Tennessee. Their findings consisted of winds nearing 80mph due to a thunderstorm Microburst in Toone and Bethel Springs Tennessee. Furthermore, stronger 110mph winds were the result of a thunderstorm Macroburst in Chesterfield Tennessee. Overall the damage consisted of multiple trees and power lines down, along with structural damage resulting in two injuries.
January 2013 Precipitation Graphics:


Seven day rainfall total ending January 14th at 7AM

CDG