...2015 ANNUAL MID-SOUTH CLIMATE SUMMARY...
Synopsis
2015 began with a January that was drier than normal by 2 to 3 inches, with temperatures that varied between near normal and slightly cooler than normal around the region. Only a trace of snow fell in January, typically the snowiest month of the year, and only at a few locations. February was some 9 to 10 degrees cooler than normal with near average precipitation amounts. The month was the 2nd coolest month of February on record at Tupelo, while being in the top 10 coolest at the other three official sites. Generally up to a couple of inches of snow fell at most locations during February, the exception to this being much of northeast Mississippi where significant snowfall was recorded, with 7.3 inches reported at Tupelo. This led to the 7th snowiest season on record at Tupelo. Speaking of snow, March came roaring in with an early month winter storm that left many areas blanketed with snow, including the Memphis metropolitan area which received up to 6 inches of snow. Overall, March temperatures were 1 to 3 degrees cooler than normal, with the exception of Tupelo and parts of north Mississippi which were closer to normal. Areas near Memphis and Jackson recorded near normal precipitation amounts during the month of March, while Jonesboro and Tupelo areas experienced above normal amounts.
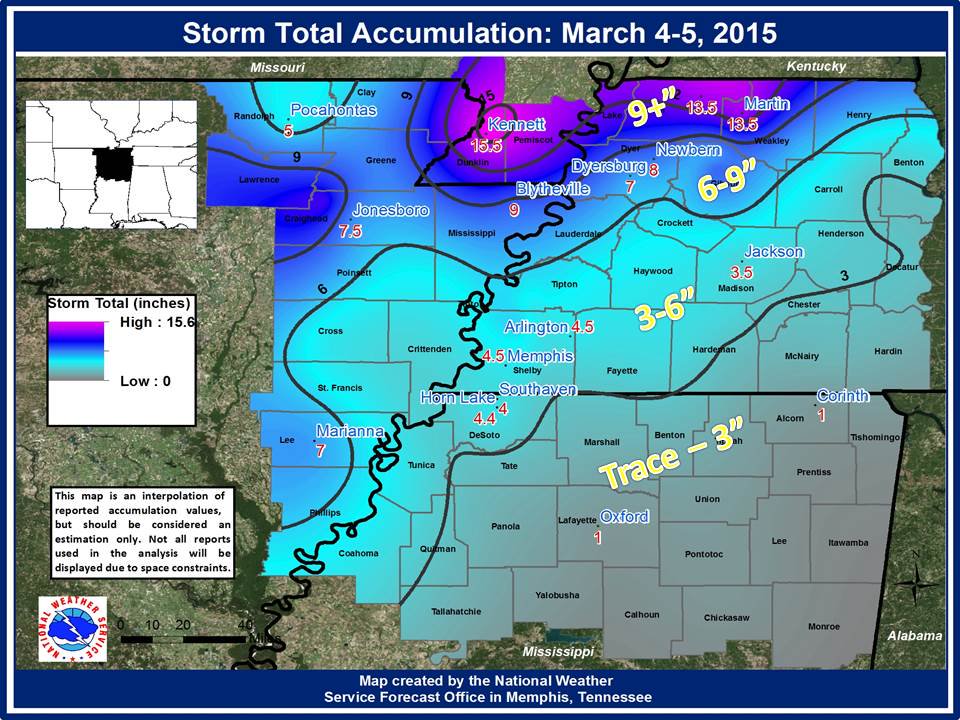
Fig 1: This figure displays interpolated storm total accumulations from the early March snowfall event. Over 15 inches of snow accumulated in some northern locations of the County Warning Area (CWA).
April, typically the most active weather month in the Mid-South, was abnormally quiet this year. Temperatures were generally warmer than normal, save for areas near Jonesboro which experienced near normal temperatures. Conditions were dry near Memphis, near normal near Jackson and Jonesboro, and wetter than normal near Tupelo. May brought both near normal temperatures and precipitation amounts for many areas. Jonesboro was cooler than normal, while both Tupelo and Jonesboro were over 3 inches of precipitation wetter than normal. Storms produced the first 4 (weak) tornadoes of the year during late May. Thanks to warmer than normal overnight low temperatures, June was abnormally warm, while precipitation lacked leaving many areas dry. The exception to the dry conditions was Memphis, which had a precipitation total for the month that was closer to normal. July was also a warmer than normal month, again thanks to overnight lows that were abnormally warm. Conditions were wetter at Jonesboro and Tupelo by over 3 and 6 inches, respectively. Meanwhile, Memphis received near normal precipitation and Jackson was drier than normal by over 2 inches. The month of August, however, produced wetter than normal conditions area wide with cooler temperatures by 1 to 4 degrees.
September was warmer for the Memphis area by roughly 2 degrees, but was nearer to normal elsewhere around the region. Precipitation amounts were above normal for September by more than 3 inches for all four official sites. Near normal temperatures continued in October, except for the Memphis area which was just over 2 degrees warmer than normal. A contrast to September, October was drier by nearly 2 inches of precipitation. The exception to this is Tupelo, which received a near normal amount of precipitation for the month. A strong El Nino event coupled with a positive North Atlantic Oscillation (NAO) produced a November that was much warmer than normal by 3 to 5 degrees, while also being much wetter than normal by 2 to 7 inches. The warmer conditions continued into December, the month with the greatest departures from normal all year, where temperatures were 9 to 10 degrees above normal area wide. This was enough to make for at least the 3rd warmest December on record for all four official climate sites. In addition to the record warm conditions, precipitation amounts were also above normal at both Jonesboro and Tupelo by 1 to 2 inches. Memphis and Jackson recorded December precipitation amounts that were near normal. Perhaps the most significant severe weather event in our region in several years, December 23rd produced 5 tornadoes, 2 of which were strong and 1 violent. An additional strong tornado occurred on December 28th.
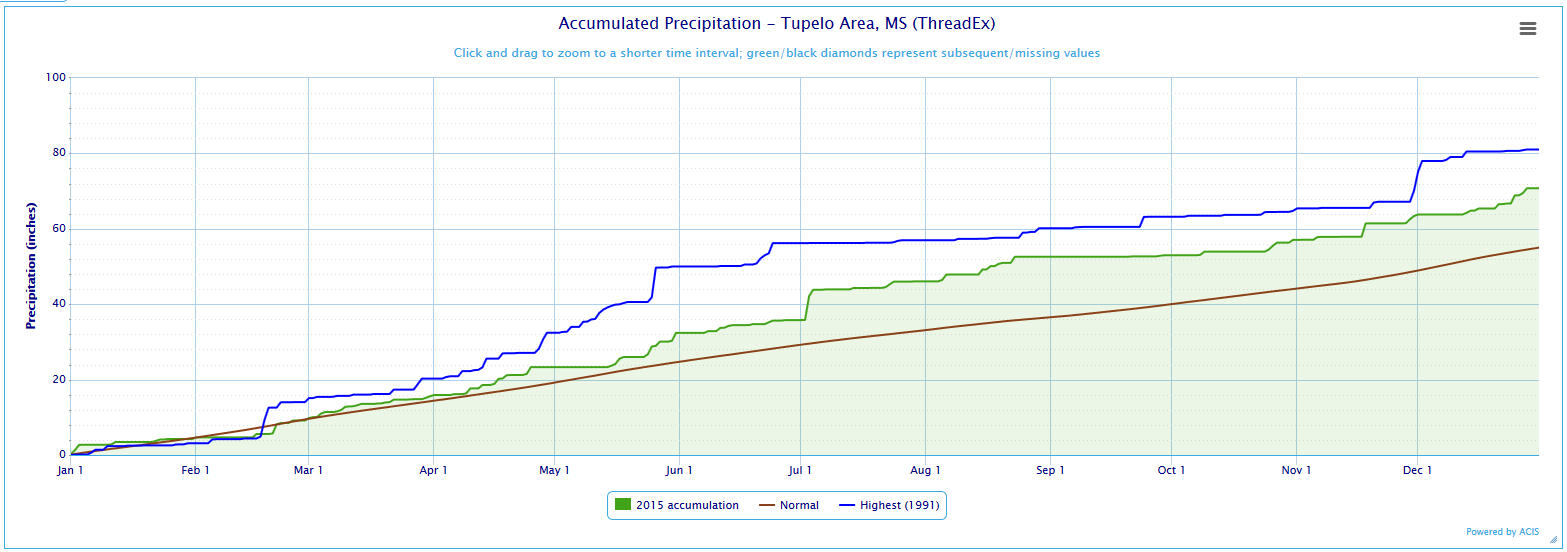
Fig 2: This figure displays the annual accumulated precipitation for Tupelo. The brown line is the normal value, the green line is the running accumulation total, and the blue line represents the running accumulation total for the wettest year on record, 1991. This figure is the graphical representation of the 7th wettest year on record at Tupelo, and the wettest official site of the Mid-South for the year 2015.
Looking at the year as a whole, Memphis was the warmest site and recorded the highest temperature of all four climate sites. Its annual average of 64.1 degrees was exactly 1.0 degree warmer than normal. This was actually warm enough for Memphis to finish 2015 as the 9th warmest year on record. While several individual months experienced wetter than normal conditions, Memphis’ annual precipitation total was still 1.02 inches below normal. Thanks to the aforementioned March winter storm, Memphis had an above normal snowfall total for the year with 5.9 inches, which is just over 2.0 inches above normal. Jackson recorded the coolest temperature of all four climate sites during 2015, and had an average temperature for the year of 60.6 degrees, only 0.8 degrees above normal. Like Memphis, Jackson had a below normal precipitation departure for the year, receiving only 48.22 inches of precipitation, a 5.50 inch departure from normal. Jackson did receive 1.2 inches of snowfall above the normal, with an annual snowfall total of 5.8 inches.
Jonesboro had the coolest average temperature of all sites for the year with 59.6 degrees, a 0.4 degree departure from normal. This was cool enough to make for the 9th coolest year on record at Jonesboro. It was a wet year at the site with 64.53 inches of precipitation recorded, a 16.43 inch departure above normal. This made 2015 the 6th wettest year on record at Jonesboro. The snowiest site of the four official climate sites, Jonesboro received 9.1 inches of snowfall, a 4.3 inch departure above normal. Tupelo finished 2015 with an average temperature of 63.3 degrees, a 0.8 degree departure above normal. Tupelo received 70.76 inches of precipitation during 2015, 15.75 inches above normal. This made 2015 the 7th wettest year on record for Tupelo. The year was also one of the snowiest for the site, with 7.4 inches of snowfall recorded, 5.3 inches above the normal.
The chart below contains significant climate data for the four official reporting sites across the Mid-South during the year 2015:
|
Memphis |
Jackson |
Jonesboro |
Tupelo |
|
|
Highest Temperature (F) |
99 (7/20 & 29) |
98 (7/29 & 8/4) |
97 (6/24) |
98 (7/28 & 8/4) |
|
Lowest Temperature (F) |
9 (1/8) |
3 (3/6) |
5 (3/6) |
8 (1/8) |
|
Average Temperature (F) |
64.1 |
60.6 |
59.6 |
63.3 |
|
Normal Temperature (F) |
63.1 |
59.8 |
60.0 |
62.5 |
|
Departure from Normal (F) |
1.0 |
0.8 |
-0.4 |
0.8 |
|
Wettest Day (inches) |
3.40 (7/3) |
3.13 (2/21) |
3.38 (11/17) |
6.30 (7/3) |
|
Total Precipitation (inches) |
52.66 |
48.22 |
64.53 |
70.76 |
|
Normal Precipitation (inches) |
53.68 |
53.27 |
48.10 |
55.01 |
|
Departure from Normal (inches) |
-1.02 |
-5.05 |
16.43 |
15.75 |
|
Total Snowfall (inches) |
5.9 |
5.8 |
9.1 |
7.4 |
|
Normal Snowfall (inches) |
3.8 |
4.6 |
4.8 |
2.1 |
|
Departure from Normal (inches) |
2.1 |
1.2 |
4.3 |
5.3 |
|
Greatest Snow Depth (inches) |
4 (3/5) |
4 (3/5) |
8 (3/5) |
7 (2/26) |
|
Earliest Freeze |
Nov 12 |
Oct 29 |
Nov 2 |
Oct 28 |
|
Latest Freeze |
Mar 24 |
Apr 3 |
Apr 2 |
Apr 3 |
|
Average Wind Speed (MPH) |
7.4 |
6.3 |
7.3 |
6.3 |
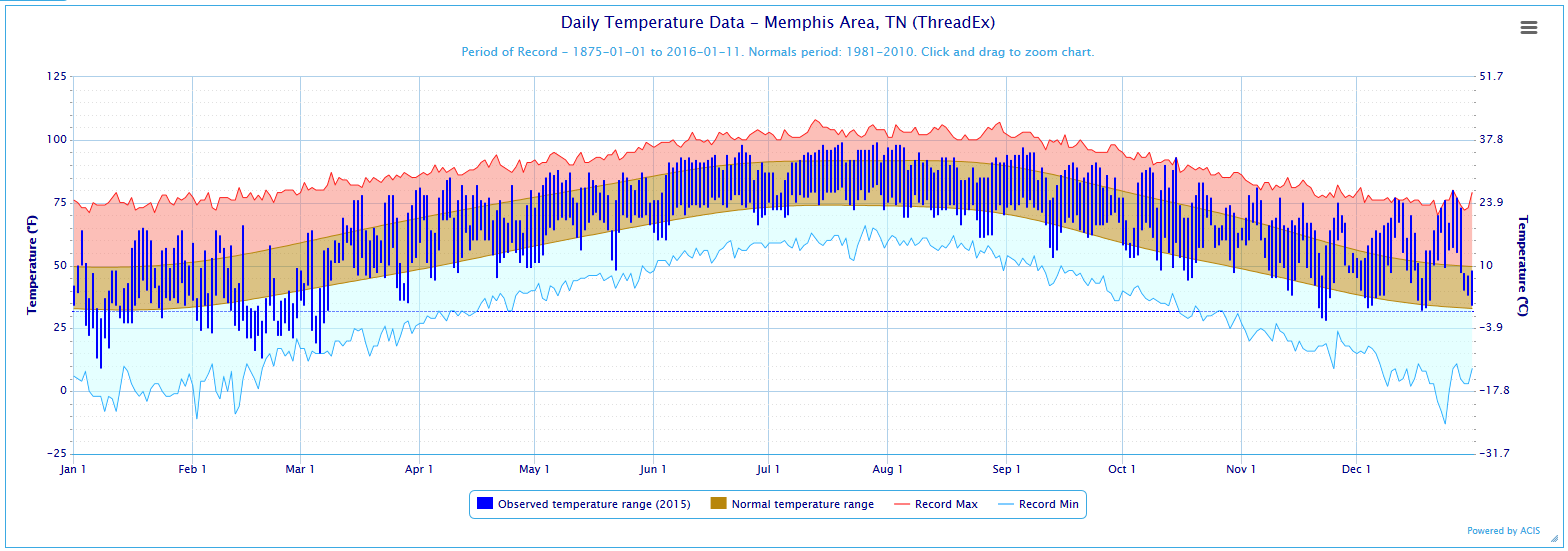
Fig 3: This figure displays the daily temperature data for Memphis International Airport. The light blue lines are historical record low temperatures, red lines are historical record high temperatures, and the brown lines depict the normal high and low values. The darker blue vertical bars are the daily ranges between the high and low temperaturs. The bounded blue, brown, and red areas are the ranges for below, near, and above normal values, respectively. Of interest here are the below normal values during the month of February, leading to the 7th coolest month of February on record for the city of Memphis. Temperatures were closer to normal during the warm season (June to August), but daily low values were above normal, indicated by the darker blue vertical bars being primarily within the normal (brown) range. Temperatures were largely above normal during November and December, with several values meeting or exceeding daily records. This figure is the graphical representation of the 9th warmest year on record at Memphis.
Notable Statistics
Memphis
#9 Warmest Year on Record - 64.3 degrees
#2 Warmest December on Record - 54.1 degrees
#4 Warmest November on Record - 57.8 degrees
#7 Coolest February on Record - 36.2 degrees
#8 Wettest November on Record - 10.16”
#9 Driest January on Record - 1.30”
Jackson
#2 Driest January on Record - 0.74”
#2 Warmest December on Record - 50.7 degrees
#3 Coolest February on Record - 33.1 degrees
#5 Warmest November on Record - 54.8 degrees
#10 Warmest July on Record - 82.2 degrees
Jonesboro
#6 Wettest Year on Record - 64.53”
#9 Coolest Year on Record - 59.7 degrees
#2 Wettest November on Record - 12.22”
#3 Coolest February on Record - 31.7 degrees
#3 Warmest December on Record - 48.6 degrees
#6 Wettest July on Record - 6.60”
#6 Coolest August on Record - 75.6 degrees
#7 Wettest Month on Record (November) - 12.22”
Tupelo
#7 Wettest Year on Record – 70.76”
#2 Coolest February on Record - 36.9 degrees
#2 Warmest December on Record - 54.0 degrees
#3 Wettest July on Record - 10.28”
#5 Warmest November on Record – 57.6 degrees
#6 Wettest Day on Record (July 3) – 6.30”
#6 Wettest August on Record – 6.50”
#6 Driest September on Record – 0.41”
#7 Snowiest Season on Record (Winter 2014/15) – 7.4”
#10 Wettest May on Record – 9.09”
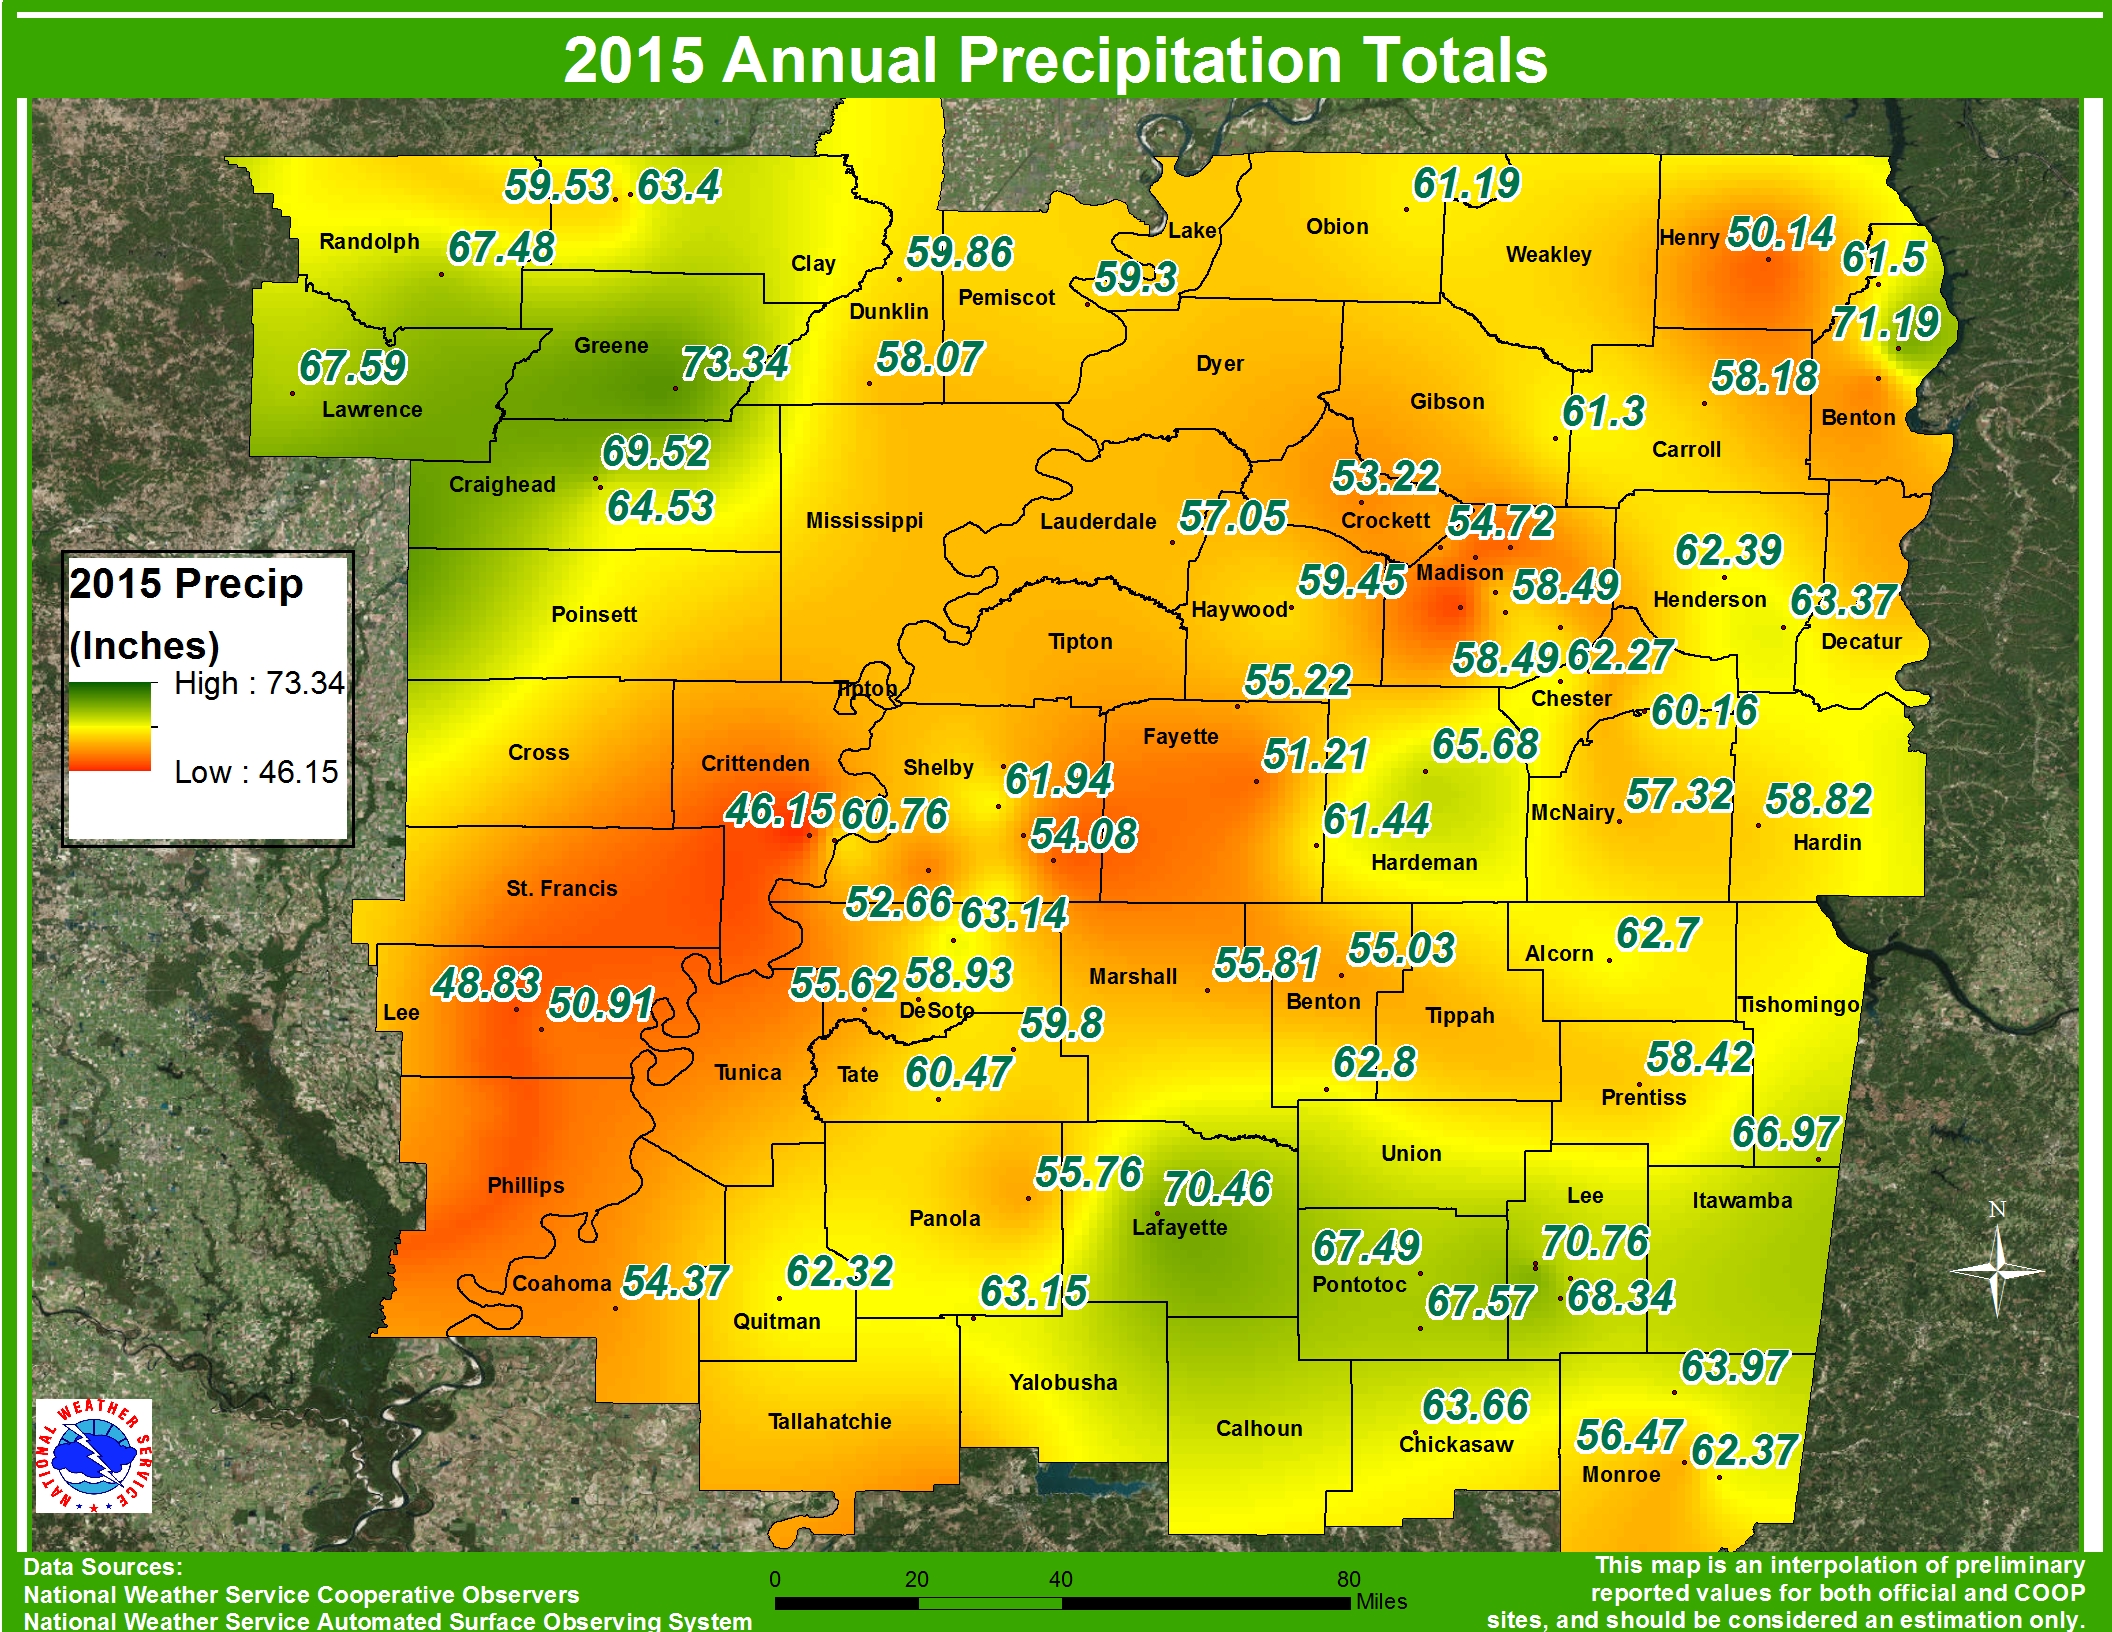
Fig 4: This figure displays interpolated 2015 annual precipitation totals, with the area maximum located in northeast Arkansas.
Severe Weather
A list of all 10 tornadoes, the date and time they occurred, the intensity rating, and the location are listed in the chart below.
|
Date |
Time (LST) |
EF Rating |
Location |
Path Length (miles) |
Max Path Width (yards) |
|
May 20 |
2:30 PM |
0 |
Haywood County, TN (SSW Brownsville) |
0.07 |
25 |
|
May 20 |
4:29 PM |
0 |
Decatur County, TN (Lost Creek/Willow Oaks) |
1.23 |
70 |
|
May 25 |
7:41 AM |
0 |
Monroe County, MS (SW Amory) |
4.12 |
70 |
|
May 25 |
7:51 AM |
1 |
Monroe County, MS (Amory) |
2.51 |
150 |
| Nov 18 | 1:06 AM | 0 | Pontotoc County, MS (3.2 E Algoma) | 9.28 | 250 |
|
Dec 23 |
2:53 PM |
3 |
Bolivar, Coahoma, Quitman, Panola Counties, MS |
63 |
800 |
|
Dec 23 |
2:57 PM |
2 |
Lee County, AR (5.5 S Marianna) |
4.6 |
100 |
|
Dec 23 |
4:10 PM |
4 |
Tate, Marshall, Benton, Tippah in MS- Hardeman, McNairy in TN |
75 |
1300 |
|
Dec 23 |
4:43 PM |
1 |
Madison County, TN (4.2 WNW Denmark) |
1.2 |
50 |
|
Dec 23 |
6:16 PM |
1 |
Prentiss County, MS (3.5 SSW Jumpertown) |
4 |
80 |
|
Dec 28 |
4:46 AM |
2 |
Lee County, AR (10 SW Marianna) |
5.75 |
40 |
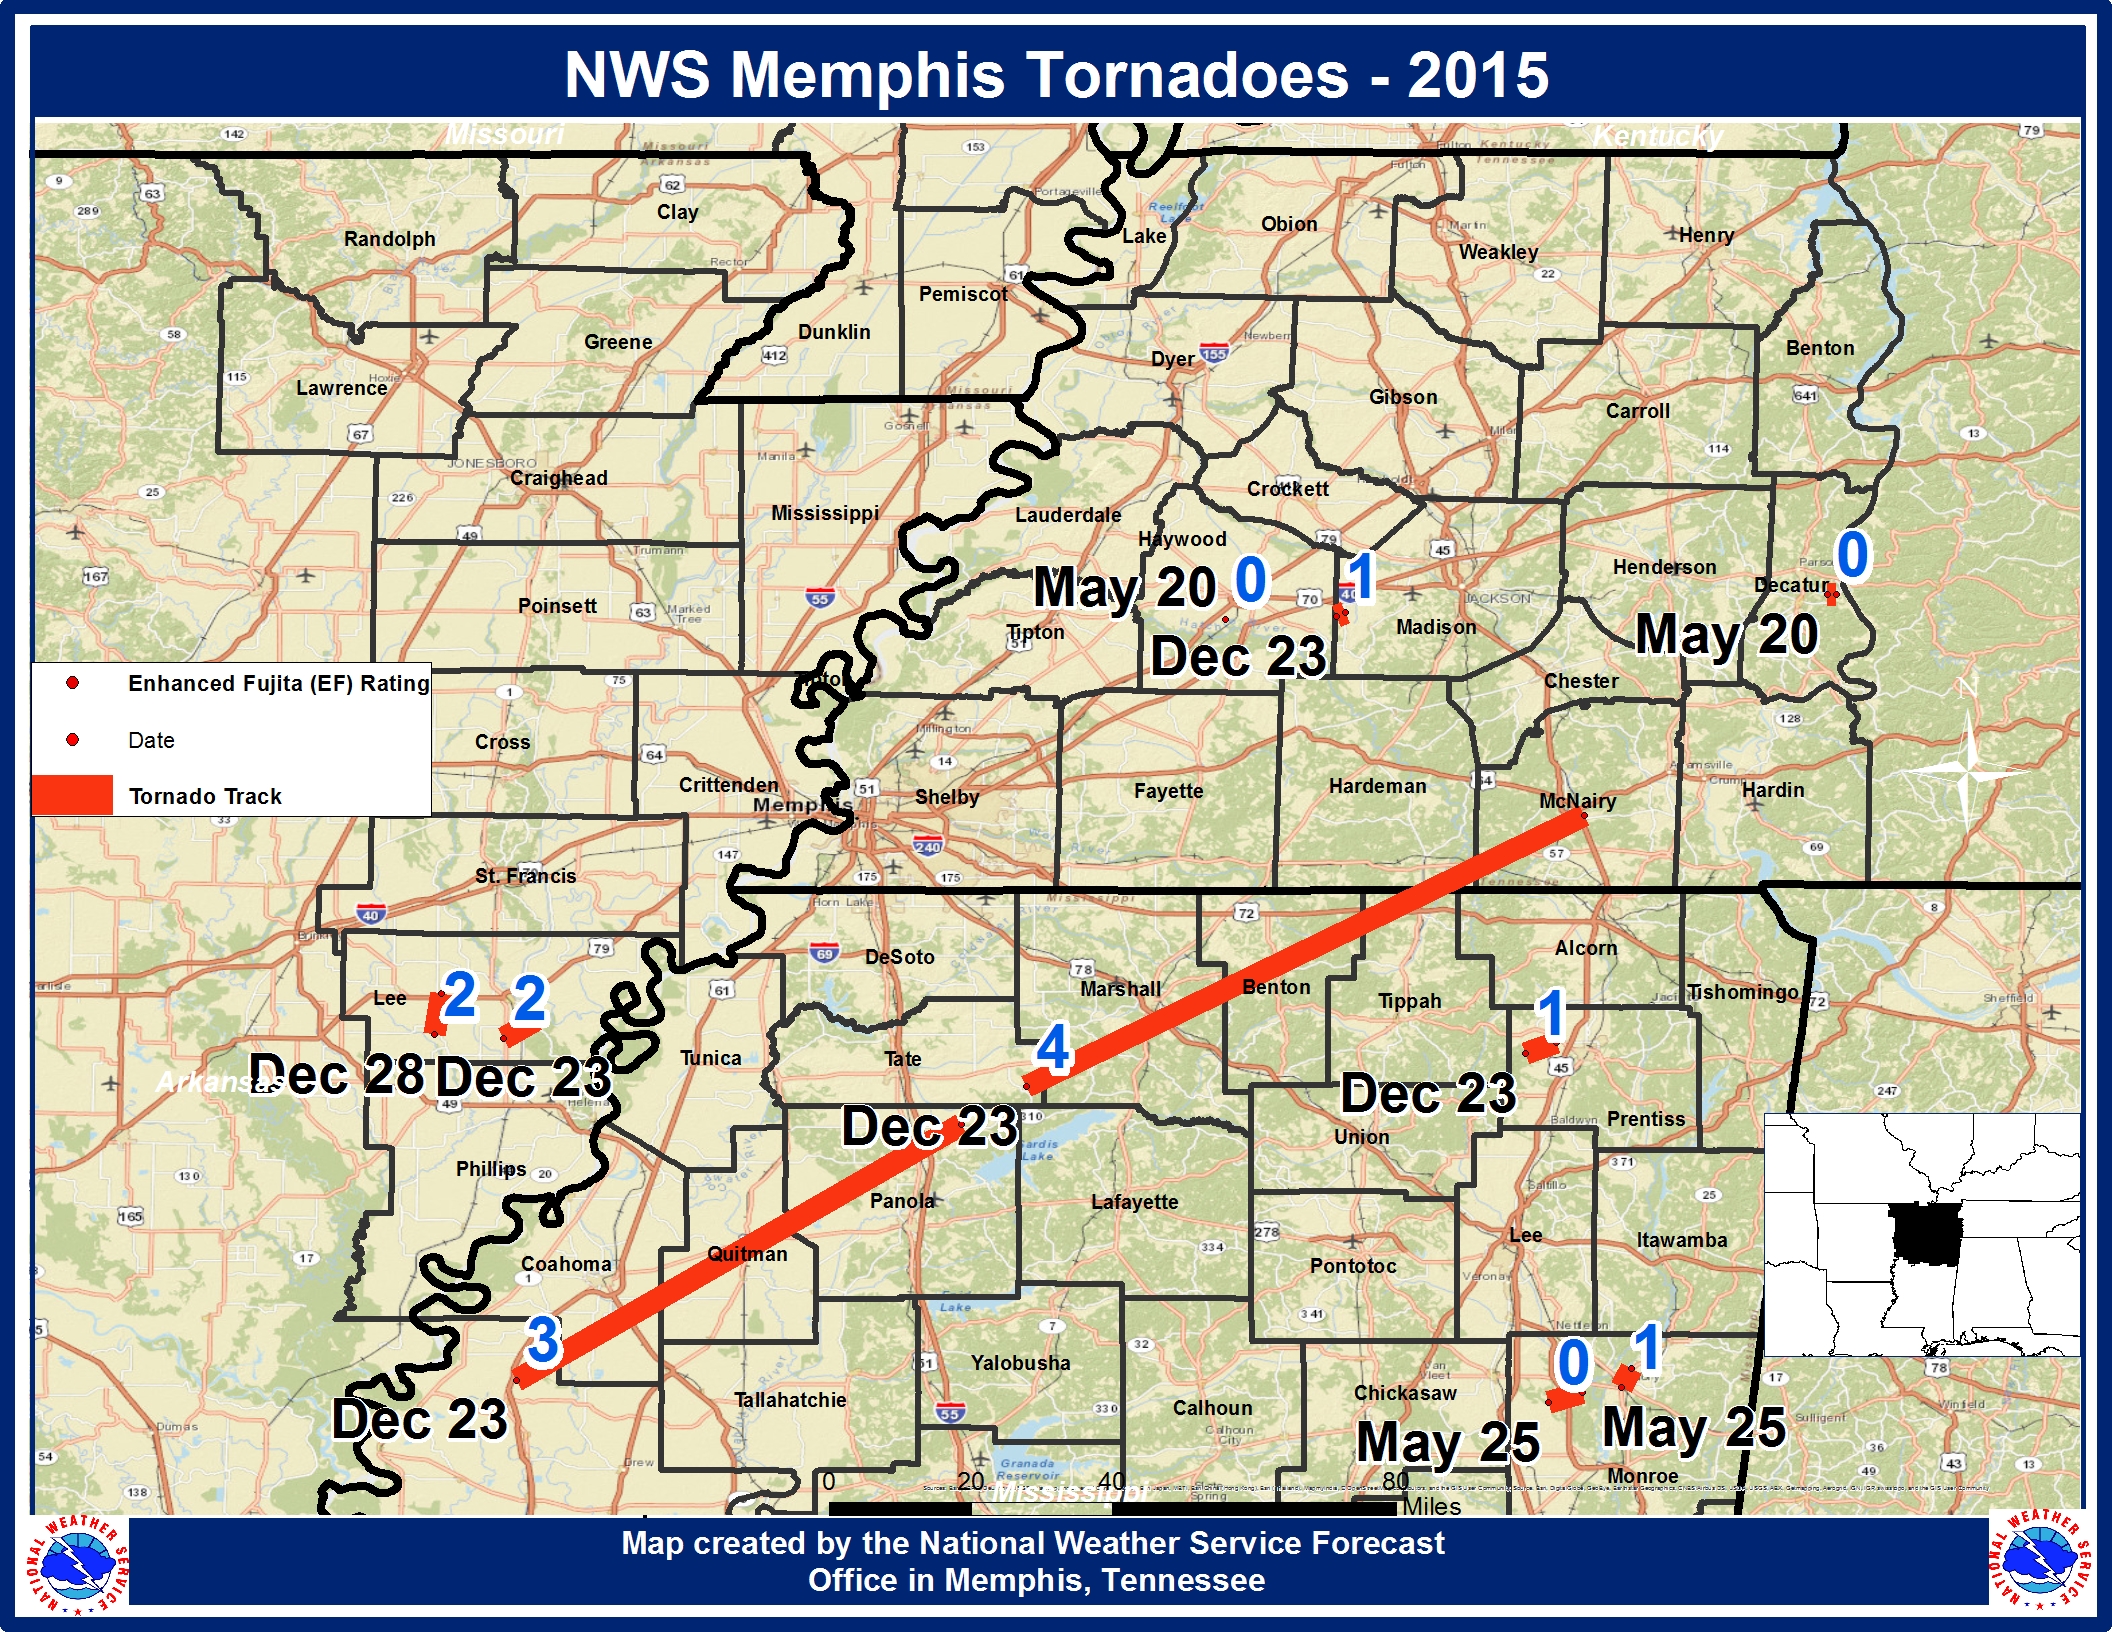
Fig 5: This figure displays all 10 tornadoes that occurred in the Mid-South during 2015.
MAYE

