
Lake effect snow will impact the Great Lakes region through the day. Gusty winds will pick up across the Midwest, Northeast and Mid-Atlantic beginning this afternoon following a cold front. Elevated fire weather conditions will persist across the Desert Southwest today, with critical fire weather conditions developing Wednesday and Thursday in the Southern Plains. Read More >
|
RADAR OPERATIONS
|
|
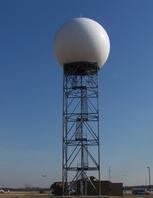
RADAR OPERATIONS: The most important responsibility of any NWS field office is the timely issuance of severe weather warnings. The WSR-88D Doppler radar has dramatically helped in this task. Our radar tower is located next to our parking lot outside our front door. Since 2000, AWIPS has been configured so that radar monitoring and warning issuance are now performed at AWIPS workstations. |
 |
|
|
How we issue a severe storm warning: Radar surveillance is always part of the job; it is a basic part of conducting a continuous weather watch. However, when there are storms on the radar, this is a much more time-consuming matter. Therefore, a meteorologist is solely assigned this task. In active weather regimes, multiple meteorologists might be monitoring radar data as it becomes available. The workload may be divided geographically (one person handles the eastern part of the Warning Area, while another takes the northwest, and a third takes the southwest), or by hazard (a forecaster assesses the wind/hail threat, while the other looks out for flooding). It is preferable to have two people working a threat/assignment as a team, as the interaction typically assists, especially when feature are subtle. After interrogating a storm, if a radar meteorologist determines that a warning is required, he/she clicks on an icon that's in the upper right corner of the AWIPS graphic screen. This activates the warning program. A cursor pops up on the screen, along with a dialog box (seen to the left). The cursor is moved to the storm of concern on the current radar image, and a radar image from 10 to 15 minutes prior. This is so the computer can calculate storm movement. The meteorologist then makes sure the proper items are clicked in the box, including warning type, valid time, and any appropriate instructions, and then clicks an icon at the bottom of the screen to compose the warning. AWIPS then composes the warning, and includes the names of communities in the path of the storm, and the time they will be first affected. The meteorologist has a chance to make any necessary additions or adjustments on a text workstation before issuing the warning. |
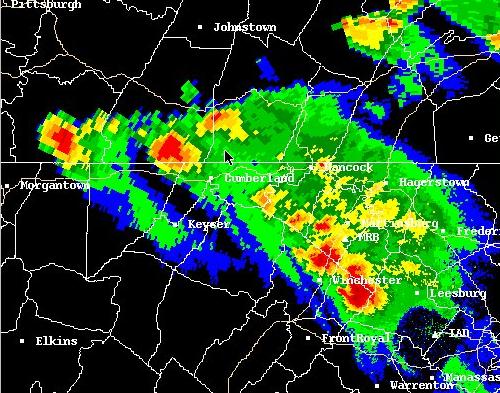
The advantage of Doppler radar is its ability to not just detect where the precipitation is falling, but also determine movement of particles within the storm. In the image below left, the areas colored green depict movement toward the radar (which is off the image to the right), and the areas colored red depict movement away from the radar. From this, one can infer rotation in this spot since fairly strong winds are depicted in opposite directions side by side. However, this accounts for the wind field at just one level. We have the ability to view radar data at a number of levels. Thus, if a similar scenario is found at the same location at different, adjacent levels, this is a rotating column of air, which is a precursor of tornado development.
This was the case in this image, when there was an F4 tornado on the ground near Frostburg. This tornado occurred during the tornado outbreak in western Maryland and eastern West Virginia on June 2, 1998. A reflectivity image from this storm at the same time can be seen to the right.
 |
 |
We also have the ability to dial to other radars to get a different view of storms. That feature was useful in this instance, as the storm was closer to the WSR-88D radar in Pittsburgh, PA. It also serves as good backup coverage. In other words, if the radar were to develop mechanical difficulties, we can always obtain radar data from surrounding sites, and maintain surveillance. AWIPS makes this task much easier since the data gathering is done automatically.
As indicated above, the radar can view storms at multiple levels. Instead of viewing the data in each "slice" along the Earth's surface, it is also possible to view the data with respect to height. The image below is a cross section of a hailstorm on April 23, 1999 that moved from the eastern West Virginia panhandle across northern Virginia and into southern Maryland. The scale along the bottom is distance along the ground, and the scale on the side is height above ground. With AWIPS, the starting and ending points of the cross section can be placed anywhere and in any orientation. The tilted white core is indicative of the large hail in this storm. We can determine it is hail since its return is a lot stronger than that of water particles.

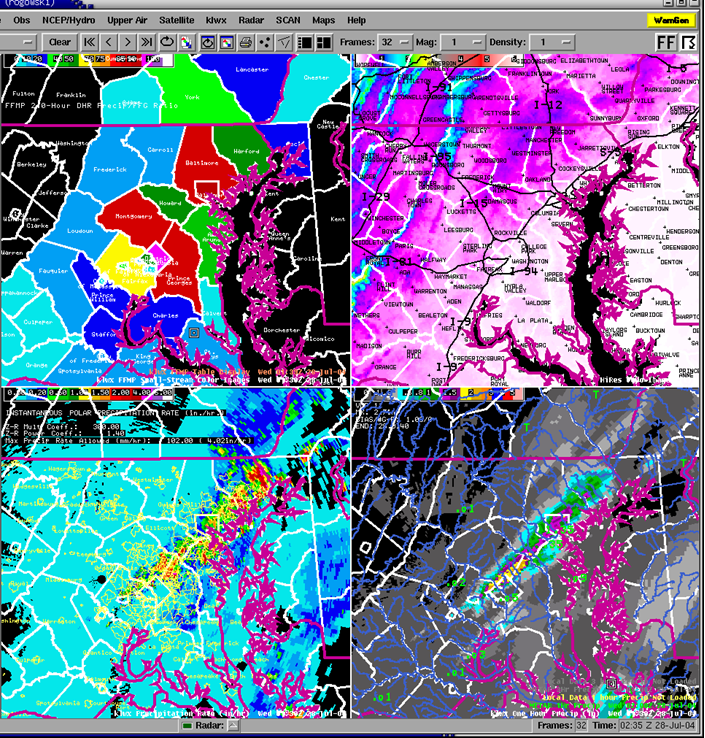
The radar's computer can also estimate rainfall based on the intensity and duration of the returns, and is able to display maps with 1 hour totals, 3 hour totals, and storm total rainfall. There are also equations built in to the software to assist us with hail detection, and determining the size of potential hail stones. To provide further assistance, AWIPS has a software tool called Flash Flood Monitoring and Prediction (FFMP), which compares flood guidance to rainfall rates. The display can be seen in the upper left section of the image below. The colors correspond to inches of rain per time interval (adjustable between 30 minutes and 6 hours). The "hotter colors" (such as red and pink) indicate the higher rates, and highlight a greater risk for flooding. The software allows for zooming in on a county, and can pinpoint the exact location of concern. In the image below, FFMP is a part of a 4-panel, along with topography/geography (upper right), instantaneous precipitation (lower left), and one hour precipitation estimates (lower right).
| <<< Back to Forecast Operations |


 Coastal Flood
 FAQ
FAQ