Overview
Seasonal Graphics
 |
 |
 |
| Summer 2018 Precipitation | Departure from Normal (inches) | Percent of Normal |
 |
 |
| Summer 2018 Temperatures | Summer 2018 Temperatures - Departure from Normal |
 |
| Summer 2018 Review |
Monthly Graphics
 |
 |
 |
| August 2018 Precipitation | August Precipitation -Departure from Normal (inches) | August Precipitation- Percent of Normal |
 |
 |
| August 2018 Temperatures | August 2018 Temperatures - Departure from Normal |
 |
| August 2018 Review |
Seasonal Summary
PUBLIC INFORMATION STATEMENT
NATIONAL WEATHER SERVICE CHICAGO/ROMEOVILLE IL
838 AM CDT TUE SEP 4 2018

...A Look Back at the Climate for Meteorological Summer (June, July,
August) 2018 for Chicago and Rockford...

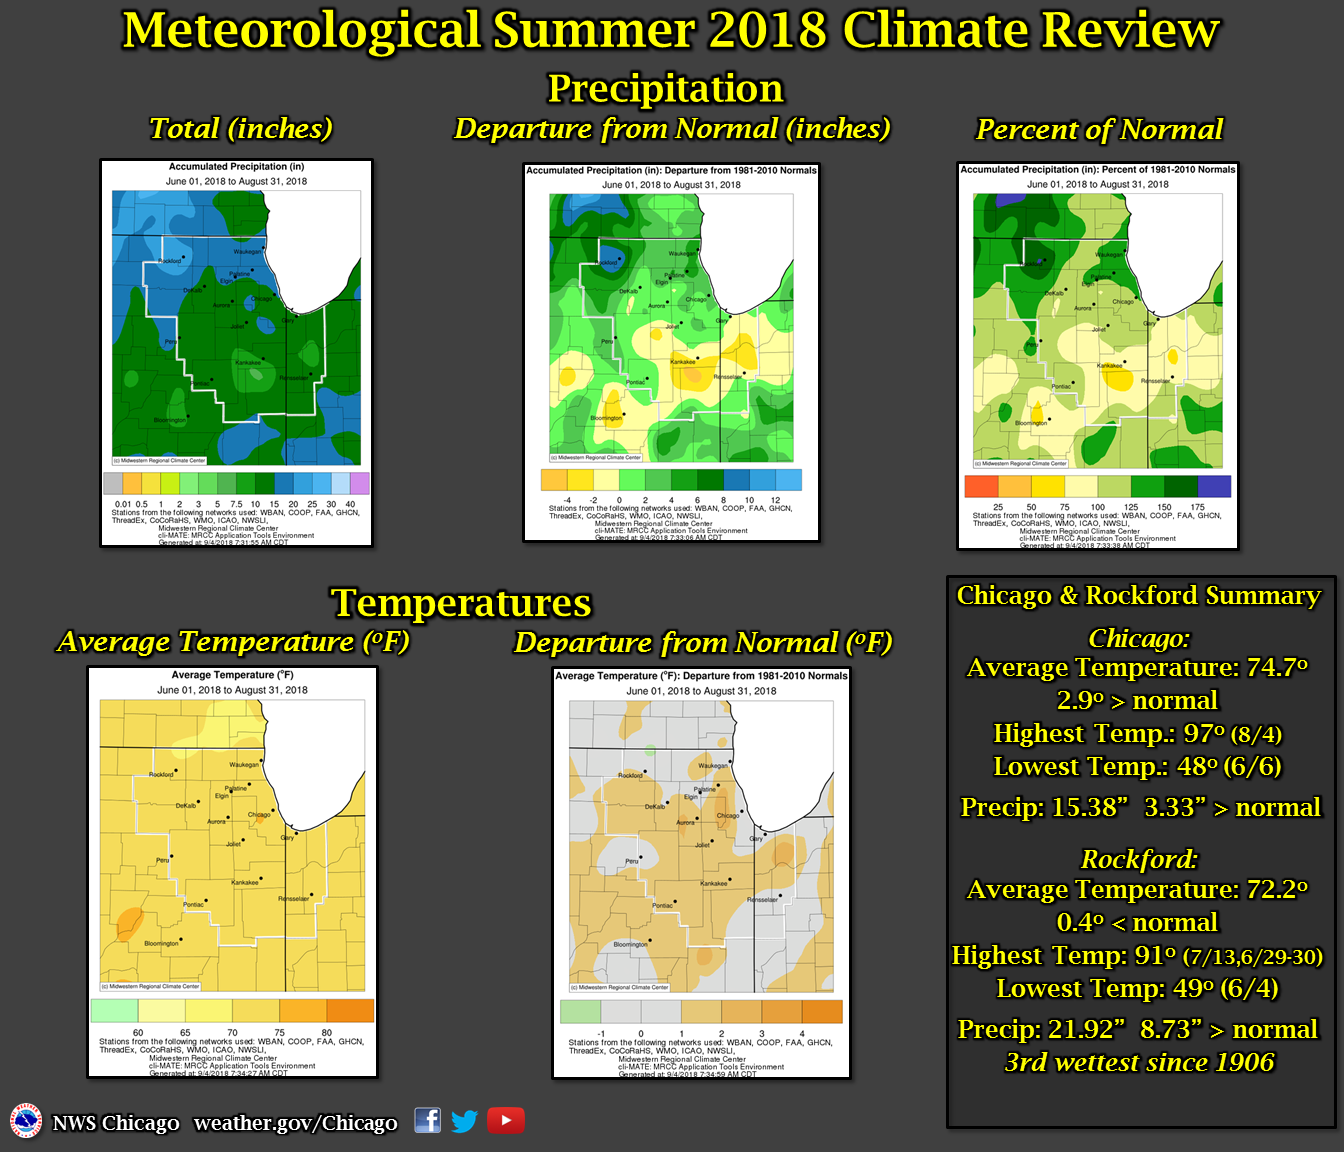
At Chicago, the average high temperature for the summer season was
83.4 degrees, which is 1.5 degrees above the 1981 to 2010 average.
The average low temperature was 65.9 degrees, which is 4.2 degrees
above normal. The mean temperature for the season was 74.7 degrees,
which is 2.9 degrees above normal. A total of 15.38 inches of
precipitation was recorded during this past summer, which is 3.33
inches above normal.

Records established or tied during the summer months:

June:
* Record daily precipitation of 1.31 inches on the 9th.
* Record daily highest minimum temperature of 78 degrees on the 17th.
* Tied daily highesst minimum temperature of 80 degrees on the 30th.

July: None.

August:
* Record daily precipitation of 2.36 inches on the 7th.
* Record daily highest minimum temperature of 78 degrees on the 27th.

At Rockford, the average high temperature was 82.3 degrees, which is
0.4 degrees below normal. The average low temperature was 62.1
degrees, which is 1.1 degrees above normal. The mean temperature for
the season was 72.2 degrees, which is 0.4 degrees above normal. A
total of 21.92 inches of precipitation was recorded during this past
summer, which was 8.73 inches above normal.

Records established or tied during the summer months:

June:
* Record daily precipitation of 1.97 inches on the 9th.
* Record daily precipitation of 2.59 inches on the 15th.
* Record daily precipitation of 2.36 inches on the 21st.
* Record daily precipitation of 2.20 inches on the 26th.
* Record daily lowest maximum temperature of 65 degrees on the 21st.
* Record daily highest minimum temperature of 76 degrees on the 30th.
* Wettest June on record since 1906 with 14.23 inches.

July: No daily records.

August:
* Record daily precipitation of 1.31 inches on the 9th.
* Tied record daily highest minimum temperature of 74 degrees on the 27th.

Summer:
Third wettest summer on record since 1906 with 21.92 inches.

$$
ACS
Latest Seasonal Climate Report: Chicago | Rockford
Monthly Summary
PUBLIC INFORMATION STATEMENT
NATIONAL WEATHER SERVICE CHICAGO/ROMEOVILLE IL
817 AM CDT TUE SEP 4 2018

...A Look Back at the Climate for the Month of August 2018
for Chicago and Rockford...

At Chicago, the average high temperature was 84.8 degrees, which is
2.9 degrees above normal. The average low temperature was 67.7
degrees, which is 4.8 degrees above normal. The average temperature
for the month was 76.3 degrees which is 3.9 degrees above normal.
During the month of August, 6.61 inches of precipitation were
recorded, which is 1.71 inches above normal.

Two records were set for Chicago for the month of August 2018:
* Record daily precipitation of 2.36 inches on the 7th.
* Record daily highest minimum temperature of 78 degrees on the 27th.

No top ten monthly records.

At Rockford, the average high temperature was 82.6 degrees, which is
0.2 degrees above normal. The average low temperature was 62.8
degrees, which is 1.5 degrees above normal. The average temperature
for the month was 72.7 degrees, which is 0.8 degrees above normal.
During the month of August, 5.31 inches of precipitation were
recorded, which is 0.72 inches below normal.

Two records for Rockford for the month of August 2018:
* Record daily precipitation of 1.31 inches on the 9th.
* Tied daily highest minimum temperature of 74 degrees on the 27th.

No top ten monthly records.


$$
ACS
Latest Monthly Climate Report: Chicago | Rockford
 |
Media use of NWS Web News Stories is encouraged! Please acknowledge the NWS as the source of any news information accessed from this site. |
 |