
A series of Pacific storm systems will cross the Northwest U.S. this week bringing gusty winds, periods of heavy rain, and mountain snow. A few locally severe storms could occur across parts of central and East Texas on Tuesday. Generally mild conditions and above average temperatures are expected Christmas Day across the majority of the U.S. Read More >
This page houses climatological snowfall data for the NWS Chicago County Warning Area (CWA), a 23 county area that includes a large portion of northern Illinois and northwest Indiana. Much of the information is for two official climate sites, Chicago and Rockford, as these locations have longtime, quality-controlled climate data. Besides climatology, this page can serve to help with snowfall risk assessment in terms of time of year, frequency, and magnitude. For more on specific snow events of the past, please visit our Past Events Page, WPC Storm Summaries, and the NCEI Storm Events Database. |
|
Chicago
Normals for Chicago O'Hare are from 1991-2020 unless otherwise noted. Records for multiple official Chicago sites are from 1886-present.
Normal and Record Snowfall
For seasonal and monthly normals and records, please visit our Local Climate Page.
Trace or More of Snow
| Normal First Date: | October 31 | Normal Last Date: | April 14 |
| Earliest First: | September 25, 1928 | Earliest Last: | March 4, 2012 |
| September 25, 1942 | |||
| Latest First: | December 5, 1999 | Latest Last: | May 25, 1924 |
Measurable (0.1 Inches or More)
| Normal First Date: | November 18 | Normal Last Date: | April 2 |
| Earliest First: | October 12, 2006 | Earliest Last: | February 28, 1994 |
| Latest First: | December 28, 2021 | Latest Last: | May 11, 1966 |
One Inch or More
| Normal First Date: | December 7 | Normal Last Date: | March 20 |
| Earliest First: | October 19, 1989 | Earliest Last: | January 18, 1927 |
| Latest First: | January 25, 2013 | Latest Last: | May 3-4, 1907 |
| Latest calendar day 1+": May 1, 1940 | |||
| Temporal Climatology of Days with >= 0.1 in. of Snow | Temporal Climatology of Days with >= 1.0 in. of Snow | ||
 |
 |
| Average Number of 1-Day Snow Totals a Season | Average Number of 2-Day Snow Totals a Season | ||
Rockford
Normals for Rockford are from 1991-2020 unless otherwise noted. Records for multiple official Rockford sites are from 1906-present, though some years are missing.
Normal and Record Snowfall
For seasonal and monthly normals and records, please visit our Local Climate Page.
Trace or More of Snow
| Normal First Date: | October 31 | Normal Last Date: | April 11 |
| Earliest First: | September 25, 1928 | Earliest Last: | March 5, 2012 |
| Latest First: | December 19, 1999 | Latest Last: | May 24, 1925 |
Measurable (0.1 Inches or More)
| Normal First Date: | November 20 | Normal Last Date: | April 1 |
| Earliest First: | October 12, 1909 | Earliest Last: | February 6, 1911 |
| Latest First: | January 7, 1940 | Latest Last: | May 11, 1966 |
One Inch or More
| Normal First Date: | December 4 | Normal Last Date: | March 18 |
| Earliest First: | October 23, 1917 | Earliest Last: | February 2, 1968 |
| October 23, 1929 | |||
| Latest First: | February 7, 1921 | Latest Last: | May 11, 1966 |
| Temporal Climatology of Days with >= 0.1 in. of Snow | Temporal Climatology of Days with >= 1.0 in. of Snow | ||
 |
 |
| Average Number of 1-Day Snow Totals a Season | Average Number of 2-Day Snow Totals a Season | ||
Northern Illinois and Northwest Indiana
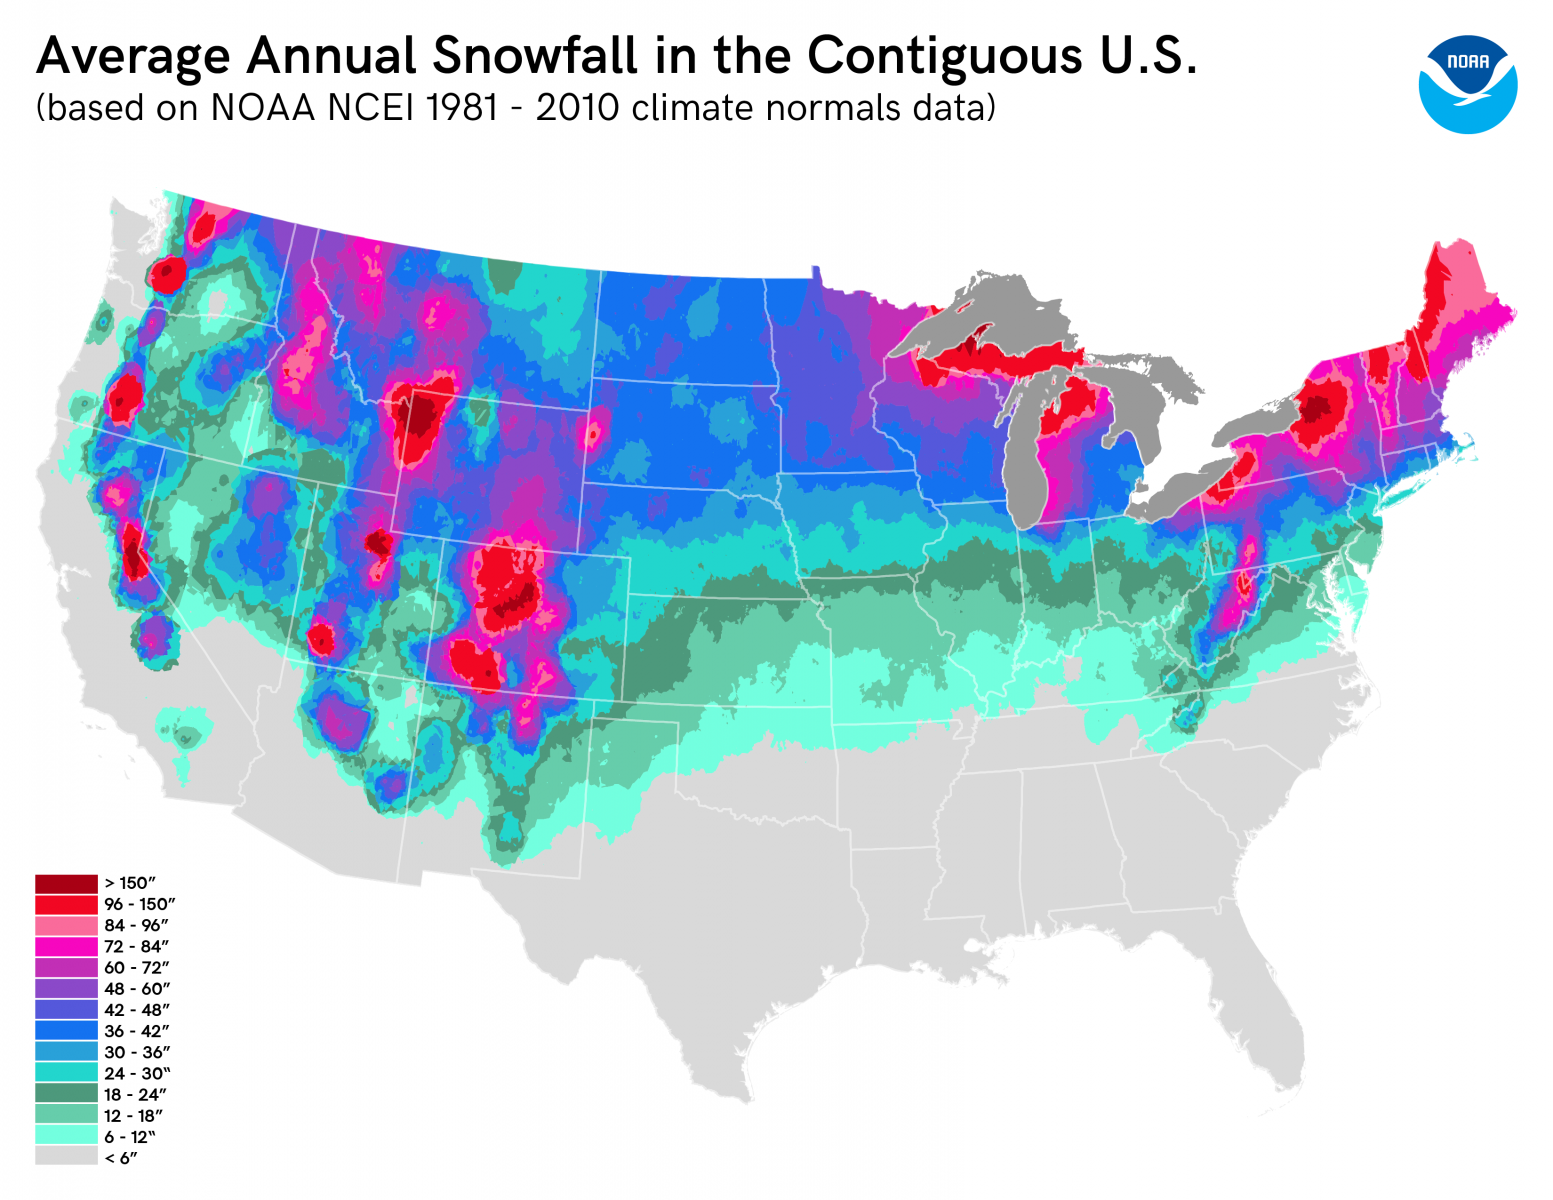
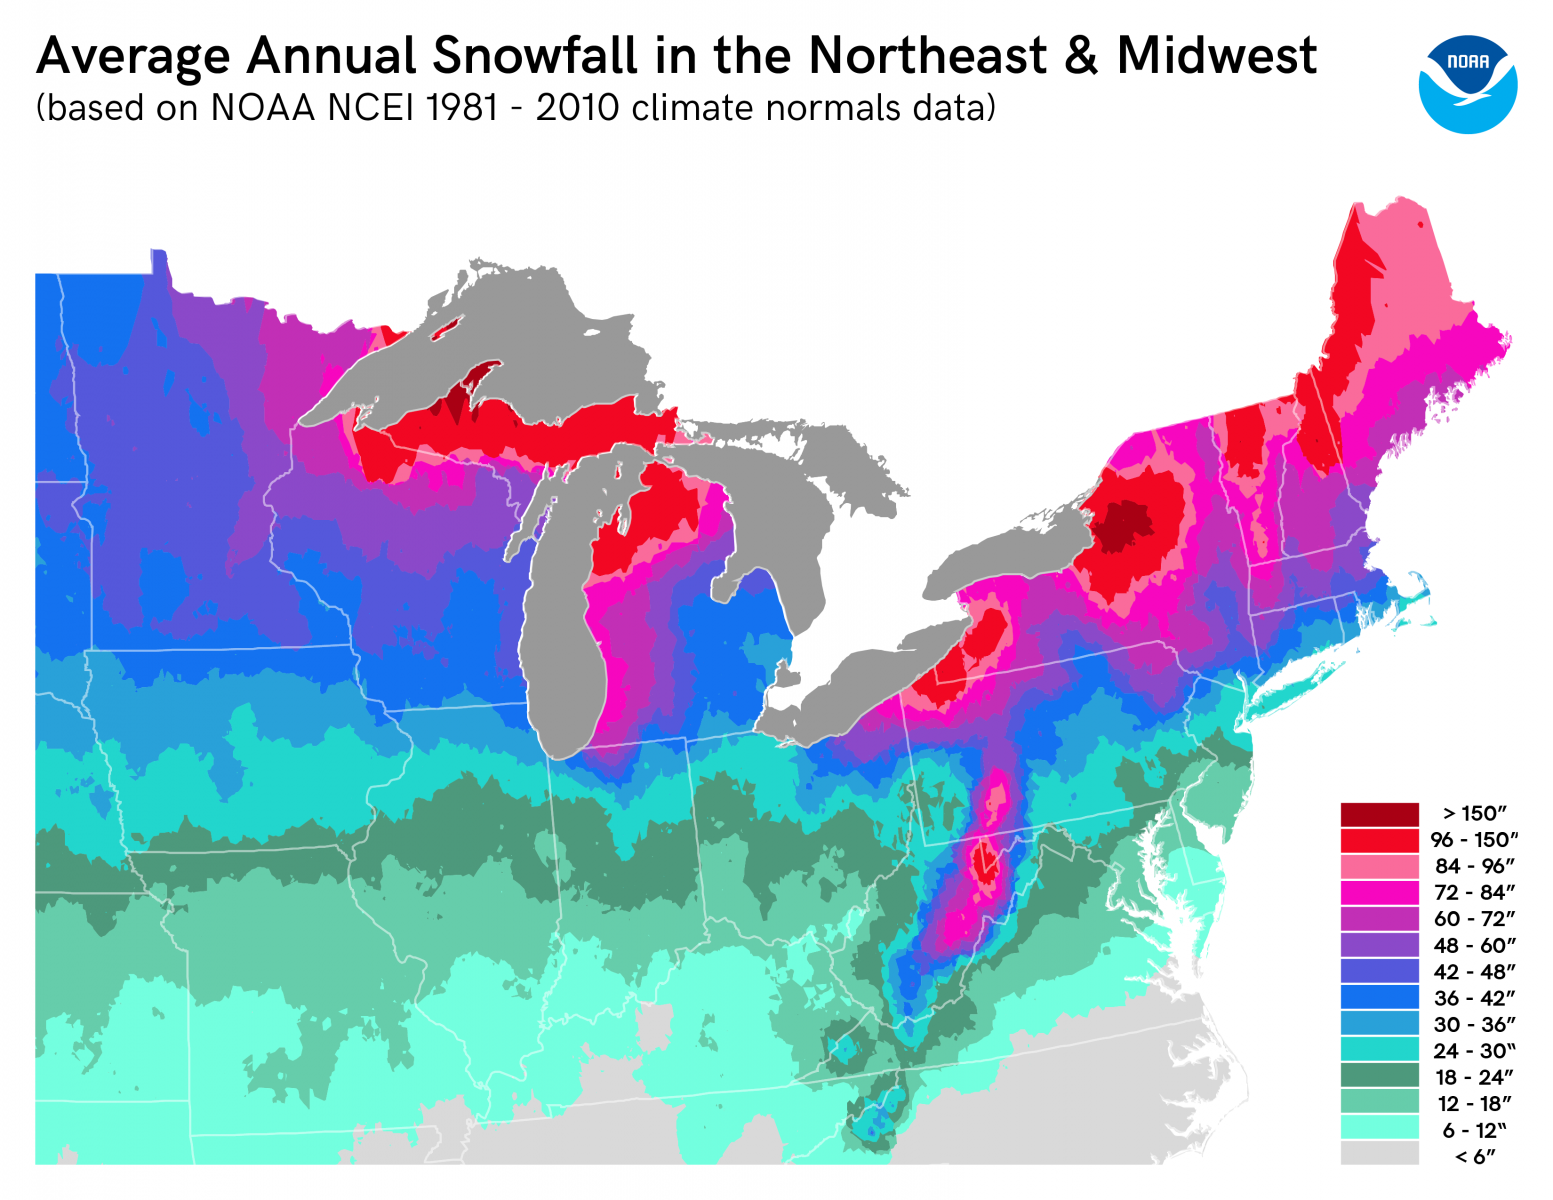
| Average Annual U.S. Snowfall | Average Annual Great Lakes Snowfall | ||
 |
 |
||
| These maps were created by Kaye LaFond of NOAA GLERL and Zoe Zaloudek of the Midwestern Regional Climate Center. | |||
The below maps are courtesy of the NOAA Midwestern Regional Climate Center's Snow Climatology Tool and are averages for a winter season.
| Average Number of 1-Day Snow Totals >= 1" Per Season | Average Number of 2-Day Snow Totals >= 1" Per Season |
| Average Number of 1-Day Snow Totals >= 3" Per Season | Average Number of 2-Day Snow Totals >= 3" Per Season |
| Average Number of 1-Day Snow Totals >= 6" Per Season | Average Number of 2-Day Snow Totals >= 6" Per Season |
Archetypes
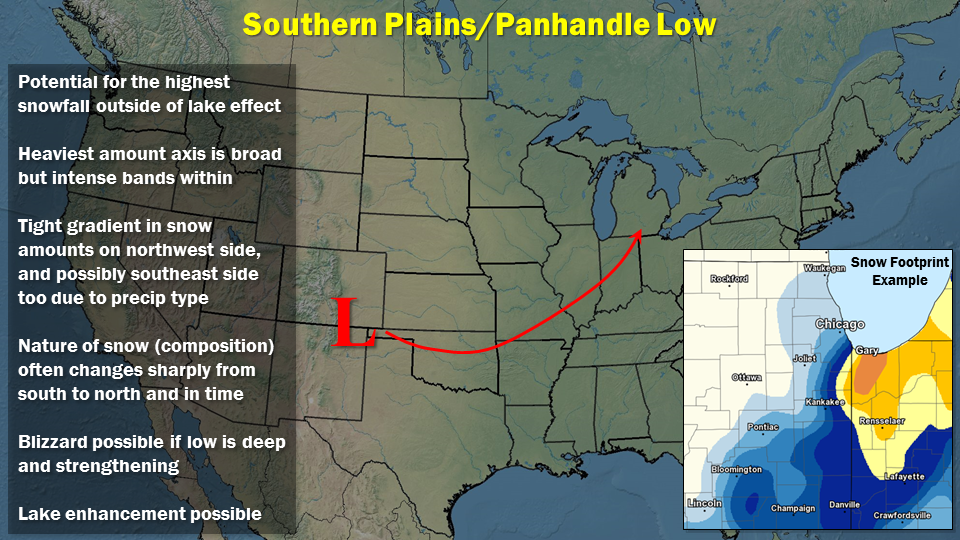
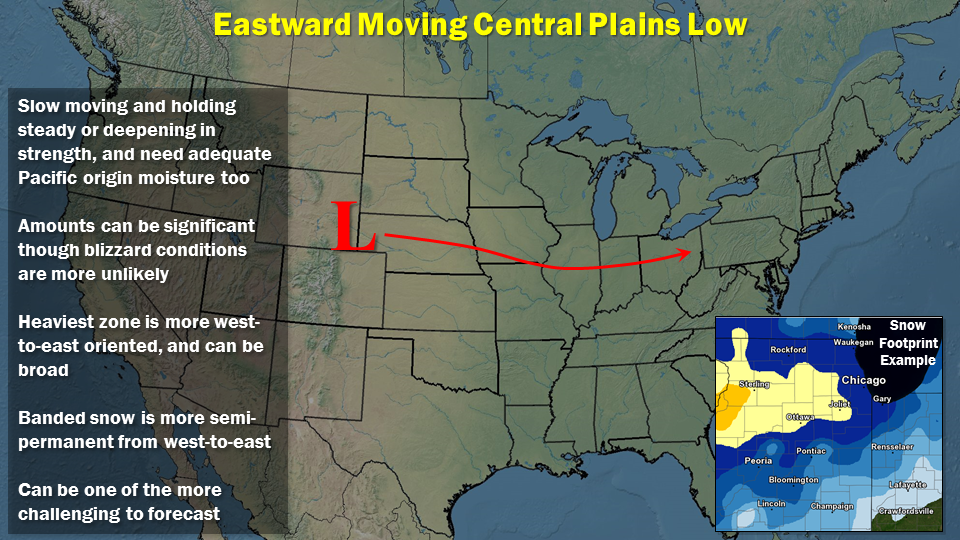
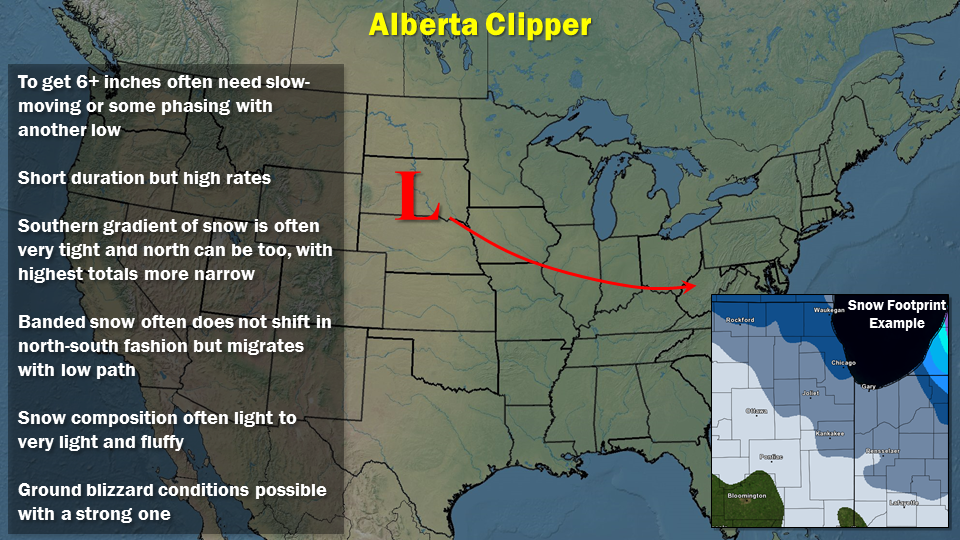
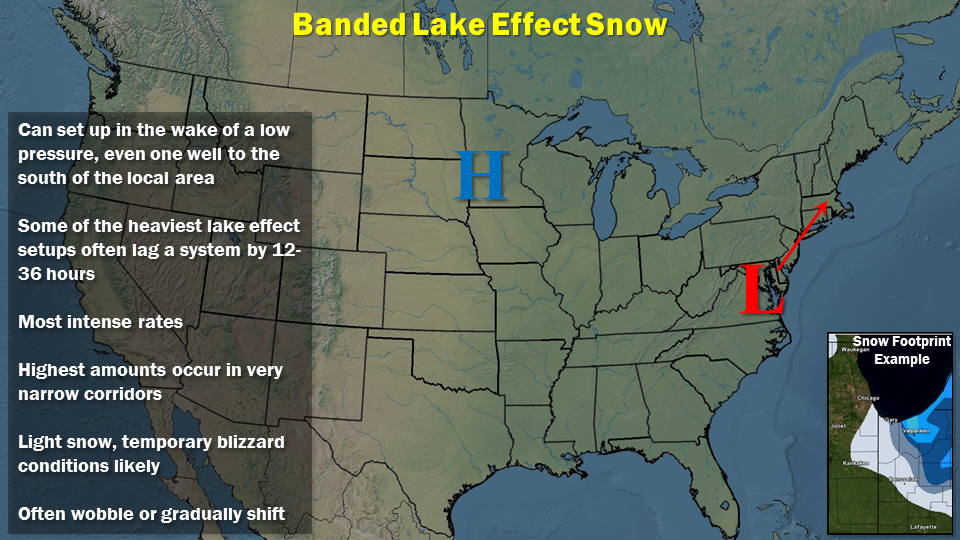
These composite maps show the general surface low tracks most frequently associated with heavy snow totals (6+ inches) in the NWS Chicago CWA. These include a majority of the heavy snow events but not all of them. These images can help with applying the conceptual model and appropriately interpreting forecast guidance.
| Southern Plains/Panhandle Low | Central Plains Low |
 |
 |
| Alberta Clipper | Banded Lake Effect Snow |
 |
 |
Links