| Valentines Day Weather for Northern Illinois: Statistics for Chicago and Rockford
Rockford:
The following statistics comprises 110 years of data. Data collection for Rockford was at the Greater Rockford Airport.
 |
|
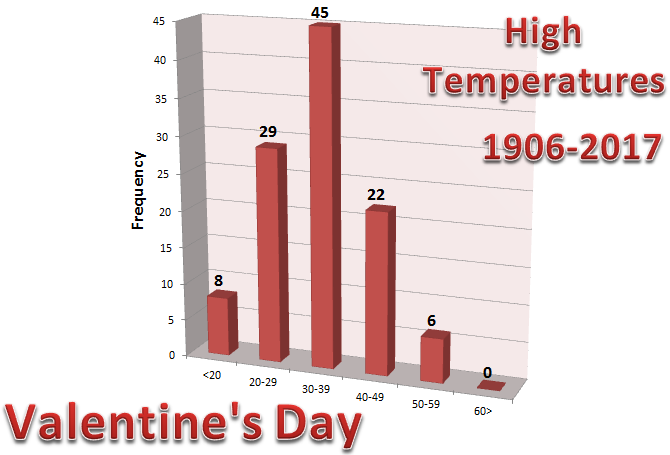
Frequency distribution of high temperatures for Rockford. This dataset shows that the most frequent range of high temperatures on Valentine’s Day is in the 30 to 39 degree range. The normal high temperature at Rockford is 34 degrees, which falls right in that range. The record high temperature on Valentine's Day is 59 degrees set in 1918 and 2006. The record lowest high temperature on Valentine’s Day is 10 degrees, which occurred in 1943. In 2017, the high temperature was 50 degrees.
|
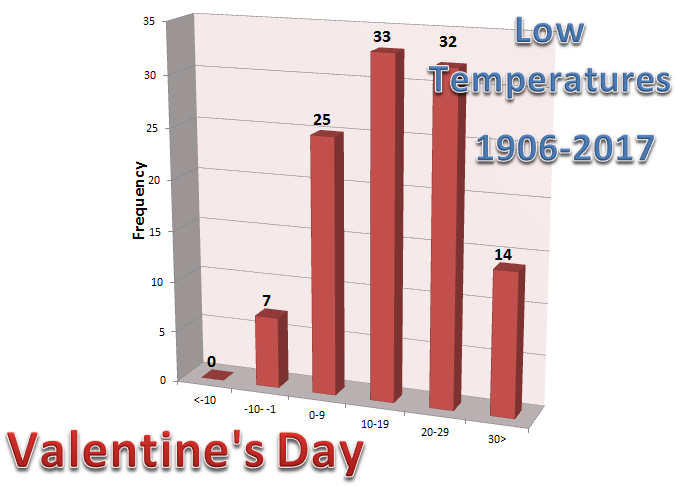 |
Frequency distribution of low temperatures for Rockford. This dataset shows that the most frequent range of low temperatures on Valentine’s Day is the 10 to 19 degree range, followed closely by the 20 to 29 degree range. The normal low temperature at Rockford is 17 degrees which is in this range. The record low temperature for Rockford on Valentine's Day is 8 below set in 1916. The record highest low on Valentine’s Day is 34 in 1928 and 2005. The low temperature in 2017 was 31 degrees.
|
 |
|
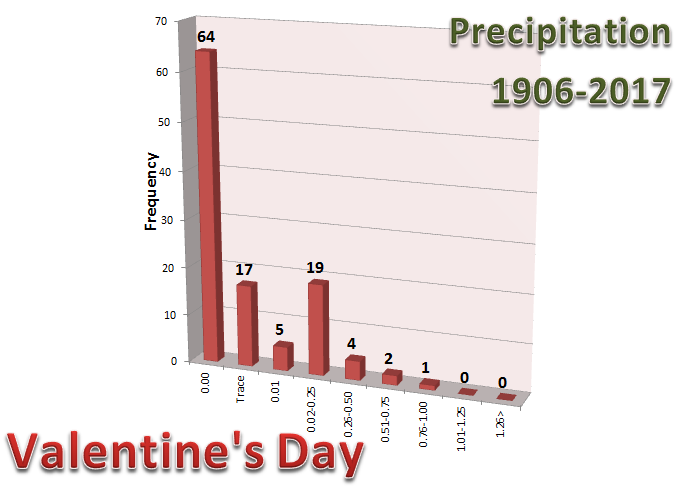
Frequency distribution of precipitation for Rockford. This dataset shows that the most frequent amount of precipitation recorded on Valentine’s Day is 0.00”, which accounts for 58% of the days in the dataset. The next most frequent range is the 0.02” to 0.25” range followed by a Trace. The highest amount of precipitation on Valentine’s Day occurred in 1906 when 0.90” of precipitation fell. There has never been an instance of over an inch of precipitation on Valentine’s Day. There was no precipitation in 2017.
|
|
|
|
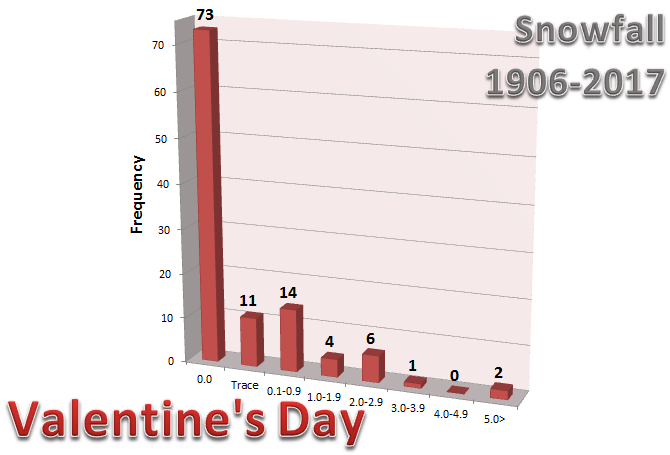
Frequency distribution of snowfall for Rockford. This dataset shows that the most frequent amount of snowfall recorded on Valentine’s Day is 0.0”, which accounts for 66% of the days in the dataset. The highest amount of snowfall recorded on Valentine’s Day occurred in 1990 when 6.0” of snow fell. In 2017, no snow fell.
|
|
ADDITIONAL VALENTINE'S DAY CLIMATE DATA ( * MEANS LAST OCCURRENCE)
59
2006 * |
34
2005 * |
0.90
1906 |
6.0
1990 |
58
1934 |
33
1954 * |
0.67
1919 |
5.0
1906 |
57
1954 |
32
1998 * |
0.61
1911 |
3.5
1927 |
55
1984 |
31
2017 * |
0.39
1927 |
50
2017 |
30
1945 * |
0.37
1990 |
49
1961 * |
29
2012 * |
0.30
1909 |
47
1913 |
28
1962 * |
|
46
1999 * |
27
2011 * |
|
45
2002 * |
26
1987 * |
|
44
2011 * |
25
2006 * |
|
| |
10
1943 |
-8
1916 |
0.00
2017 * |
0.0
2017 * |
14
1923 |
-6
1943 * |
T
2015 * |
T
2015 * |
17
2007 * |
-3
1920 |
0.01
1996 * |
0.1
2012 * |
18
2016 |
-2
1936 |
0.02
1972 |
19
2014 * |
-1
1963 * |
0.03
1908 |
20
1920 |
1
2015 * |
|
21
1914 |
2
2010 * |
|
22
1970 * |
3
1995 * |
|
23
1978 * |
4
2007 * |
|
24
1971 * |
5
1978 * |
|
ACS 2/13/2018

