| New Year's Day Weather for Northern Illinois: Statistics for Chicago and Rockford
Rockford: The following statistics comprises 112 years of data. Data collection for Rockford was at the Greater Rockford Airport.
 |
||||||||
|
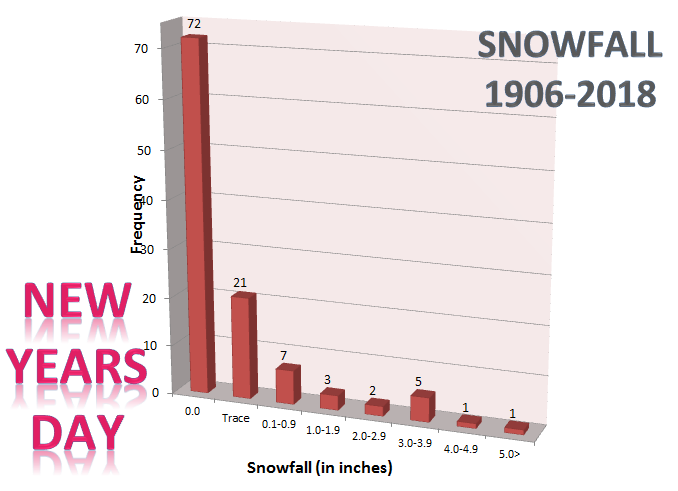
Frequency distribution of snowfall for Rockford. This dataset shows that the most frequent amount of snowfall recorded on New Year’s Day is 0.0”, which accounts for 64% of the days in the dataset. The next most frequent range is a trace. The highest amount of snow that has fallen on New Year’s Day is 9.0” in 1942. In 2018, no snow fell. |
||||||||
|
MAX TEMP |
MIN TEMP WARMEST |
PCPN WETTEST |
SNOW MOST |
| 49 1916 |
40 1950 |
1.33 1948 |
5.0 1918 |
| 45 1950 * |
35 1965 * |
1.25 1891 |
4.6 1978 |
| 44 2007 |
34 1916 * |
0.94 1965 |
4.4 1948 |
| 43 2006 * |
33 1941 * |
0.70 1941 |
4.3 1985 |
| 42 2012 * |
31 1996 * |
0.68 1916 |
3.2 2014 |
| 41 2004 * |
30 1997 * |
0.61 1985 |
|
| 40 2005 * |
29 2006 * |
0.57 1892 |
|
| 39 2017 * |
28 2007 |
0.48 1890 |
|
| 38 1994 * |
27 2012 * |
0.47 1918 |
|
| 37 2011 * |
26 1951 |
0.44 1876 |
|
| MAX TEMP COLDEST |
MIN TEMP COLDEST |
PCPN DRIEST |
SNOW LEAST |
| -1 2018 |
-13 2018 * |
0.00 2018 * |
0.0 2018 * |
| 4 1974 |
-10 1974 * |
T 2016 * |
T 2016 * |
| 5 1969 * |
-8 1964 |
0.01 1997 * |
0.1 1967 * |
| 6 1988 |
-7 1979 |
0.02 1995 * |
0.2 1995 |
| 10 1928 |
-6 1978 |
0.03 2006 * |
0.3 1959 |
| 11 2010 * |
-5 1988 * |
0.04 1971 * |
|
| 13 1968 |
-3 1935 |
0.05 2008 * |
|
| 14 1957 |
-2 1977 * |
0.06 1911 |
|
| 15 1958 |
-1 2010 * |
0.08 2012 * |
|
| 16 2014 * |
1 2008 * |
0.09 1921 |
|
12/22/2018