Updated Oct 2022.
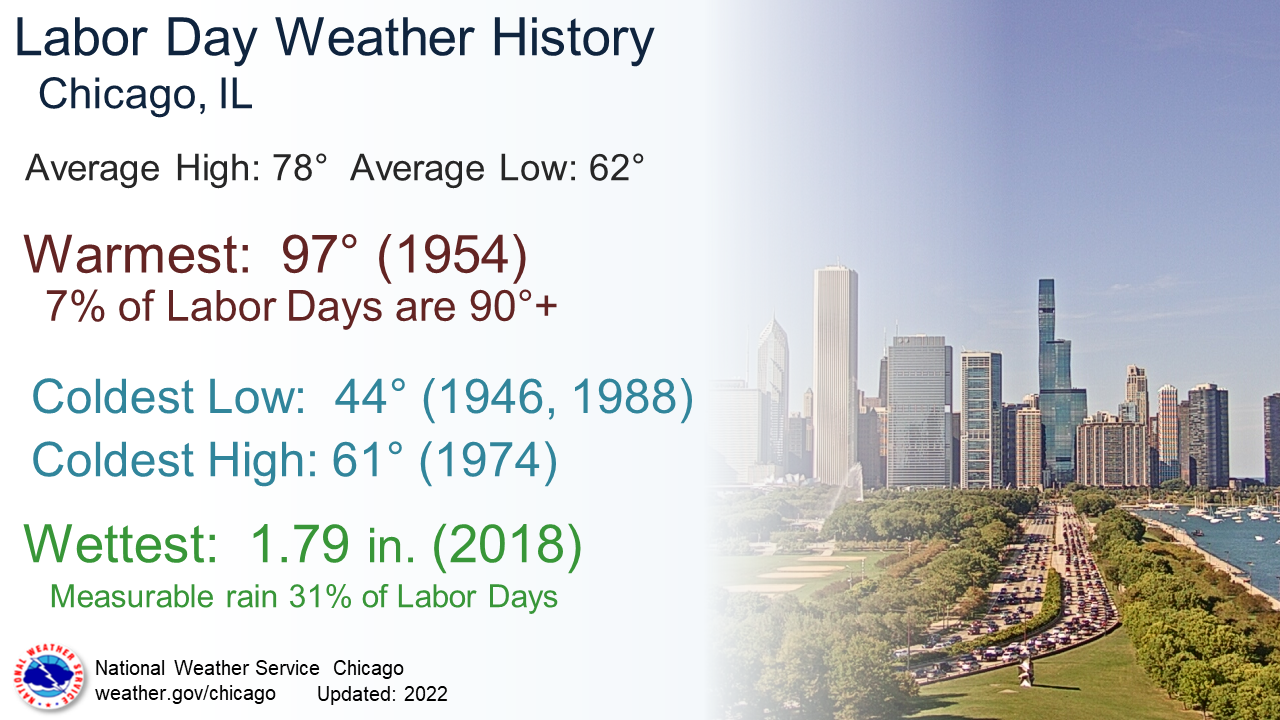
Chicago
Official weather records for Chicago date back to 1871 for temperatures and precipitation, and to 1884 for snowfall. Observation location history for Chicago can be found here. Note: Labor Day was declared a federal holiday in 1894.
 |
| Labor Day Climate Data for Chicago |
| Top 10 Warmest (Highs) | Top 10 Coldest (Highs) | |||||
| 1 | 1954 | 97 | 1 | 1974 | 61 | |
| 2 | 1959 | 96 | 2 | 1891* | 62 | |
| 3 | 1913 | 95 | 3 | 1905 | 63 | |
| 1983 | 95 | 1935 | 63 | |||
| 5 | 1881* | 94 | 5 | 1988 | 64 | |
| 1964 | 94 | 6 | 1883* | 65 | ||
| 7 | 1973 | 93 | 1885 | 65 | ||
| 8 | 1893* | 91 | 1928 | 65 | ||
| 1929 | 91 | 1994 | 65 | |||
| 10 | 1970 | 90 | 2003 | 65 | ||
| Top 10 Warmest (Lows) | Top 10 Coldest (Lows) | |||||
| 1 | 2015 | 76 | 1 | 1988 | 44 | |
| 2 | 1881* | 76 | 1946 | 44 | ||
| 3 | 1973 | 75 | 3 | 1972 | 46 | |
| 4 | 1970 | 73 | 4 | 1974 | 50 | |
| 1959 | 73 | 1993 | 50 | |||
| 6 | 1913 | 72 | 1992 | 50 | ||
| 7 | 1879 | 71 | 7 | 1984 | 51 | |
| 1960 | 71 | 8 | 1928 | 52 | ||
| 1897 | 71 | 2011 | 52 | |||
| 1912 | 71 | 1981 | 52 | |||
| Top 10 Wettest | Percent of Years (Precip) | |||||
| 1 | 2018 | 1.79 | >0 | 42% | ||
| 2 | 1912 | 1.49 | >= 0.01 in | 31% | ||
| 3 | 1963 | 1.30 | >=0.10 in | 22% | ||
| 4 | 1898 | 1.20 | >=0.50 in | 7% | ||
| 5 | 1983 | 1.06 | >=1.00 in | 5% | ||
| 6 | 1998 | 1.00 | ||||
| 1981 | 1.00 | |||||
| 8 | 1952 | 0.97 | ||||
| 9 | 1942 | 0.81 | ||||
| 10 | 2002 | 0.65 | ||||
| More Temperature Stats | ||||||
| Avg High | 78.0° | |||||
| Avg Low | 61.8° | |||||
| >=70° | 83% | |||||
| >=80° | 47% | |||||
| >=90° | 7% | |||||
* Note Labor Day was not delcared a federal holiday until 1894. For years prior to 1894, the value listed was still from the first Monday in September.
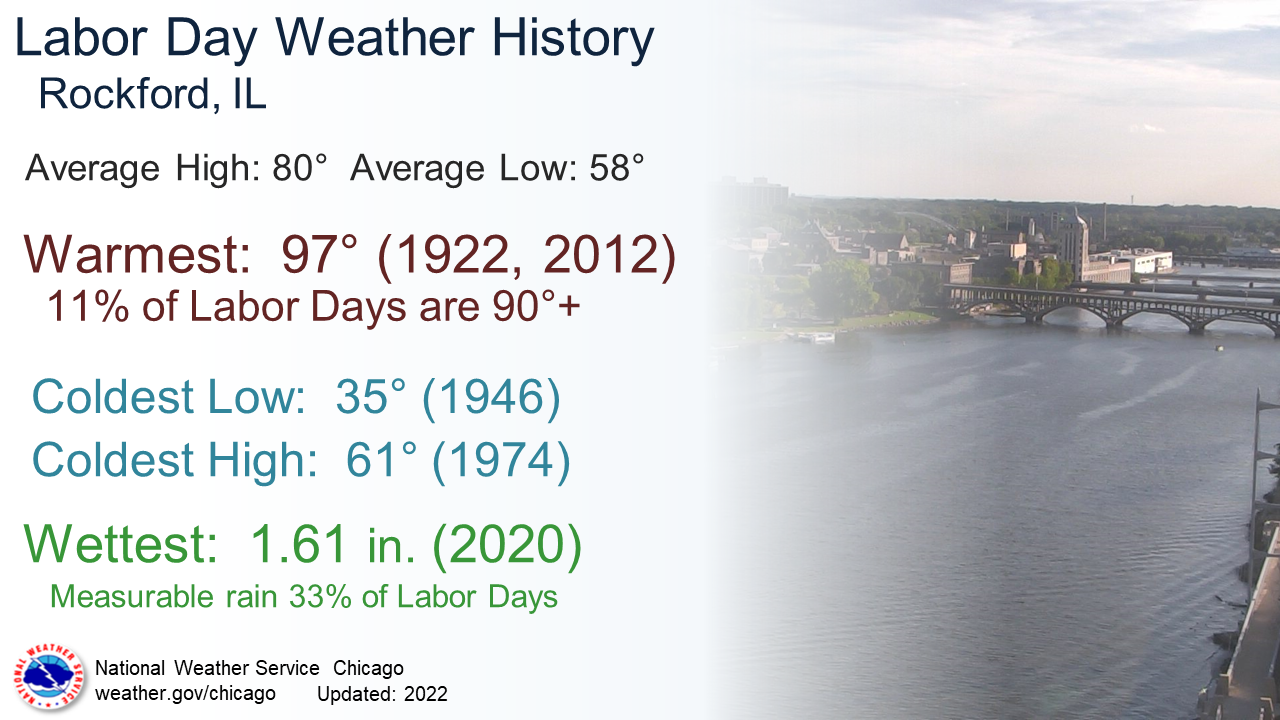
Rockford
Official weather records for Rockford date back to 1905 for temperatures, precipitation, and snowfall. Observation location history for Rockford can be found here.
 |
| Labor Day Climate Data for Rockford |
| Top 10 Warmest (Highs) | Top 10 Coldest (Highs) | |||||
| 1 | 1922 | 96 | 1 | 1974 | 61 | |
| 2 | 2012 | 96 | 2 | 1935 | 63 | |
| 3 | 1954 | 95 | 3 | 1988 | 65 | |
| 4 | 1959 | 95 | 4 | 1909 | 66 | |
| 5 | 1933 | 94 | 5 | 1994 | 66 | |
| 6 | 1929 | 93 | 6 | 2011 | 66 | |
| 7 | 1907 | 92 | 7 | 1905 | 67 | |
| 8 | 1927 | 92 | 8 | 1928 | 68 | |
| 9 | 1912 | 90 | 9 | 1958 | 68 | |
| 10 | 1923 | 90 | 10 | 1965 | 68 | |
| Top 10 Warmest (Lows) | Top 10 Coldest (Lows) | |||||
| 1 | 1912 | 72 | 1 | 1946 | 35 | |
| 2 | 2015 | 72 | 2 | 1953 | 42 | |
| 3 | 1959 | 71 | 3 | 1988 | 44 | |
| 4 | 1973 | 70 | 4 | 1976 | 45 | |
| 5 | 1983 | 70 | 5 | 1919 | 45 | |
| 6 | 1933 | 69 | 6 | 1972 | 45 | |
| 7 | 1970 | 69 | 7 | 1908 | 47 | |
| 8 | 1936 | 69 | 8 | 1950 | 47 | |
| 9 | 2018 | 69 | 9 | 1937 | 49 | |
| 10 | 1960 | 68 | 10 | 1940 | 49 | |
| Top 10 Wettest | Percent of Years (Precip) | |||||
| 1 | 2020 | 1.61 | >= 0.01 in | 38% | ||
| 2 | 1930 | 1.33 | >=0.10 in | 27% | ||
| 3 | 1963 | 1.32 | >=0.50 in | 14% | ||
| 4 | 1936 | 1.30 | >=1.00 in | 5% | ||
| 5 | 2018 | 1.04 | ||||
| 6 | 2002 | 0.86 | ||||
| 7 | 1926 | 0.85 | ||||
| 8 | 1910 | 0.75 | ||||
| 9 | 1981 | 0.73 | ||||
| 10 | 1983 | 0.72 | ||||
| More Temperature Stats | ||||||
| Avg High | 79.9° | |||||
| Avg Low | 57.6° | |||||
| >=70° | 90% | |||||
| >=80° | 54% | |||||
| >=90° | 11% | |||||