
An expansive storm system will bring widespread storms with a threat for flash flooding and severe weather to much of the central to eastern U.S. into early this week. Critical fire weather conditions are expected across interior Alaska this weekend. Elevated fire conditions also expected in the Southwest U.S.. Conditions will remain uncomfortably hot across the southern Plains and the Southeast. Read More >
|
A hydrograph is a way of displaying water level information over time. A hydrograph plot may display stage, streamflow, and sometimes both. Hydrographs can be a helpful way to show water level observations and forecasts visually on a single graphic.
The NWS provides hydrographs of water level forecasts on the Advanced Hydrologic Prediction Center (AHPS) web page.
|
|
|
|
|
Understanding Hydrographs
Learn more about how to use NWS hydrographs by viewing the example below (left) with the explanations of each hydrograph part (right). More information about hydrograph terms: Stage, Flow, Datum, Action Stage, Minor Flood Stage, Moderate Flood Stage, Major Flood Stage. |
|
Understanding Long Term Flood Risk Forecasts
Long term forecasts of flood risk are provided using Ensemble Streamflow Prediction (ESP). ESP is based upon two forecasts of the same 3-month period into the future. One forecast uses the observed soil moisture, snow cover, and river levels from those time periods while the other forecast adjusts the soil moisture, snow cover, and river levels to match current values. The result is a estimate of the relative risk of flooding over that 3-month period, based upon current conditions. ESP is updated monthly. The example below shows how output from ESP would depict an increased flood risk (left) and a decreased flood risk (right). |
|
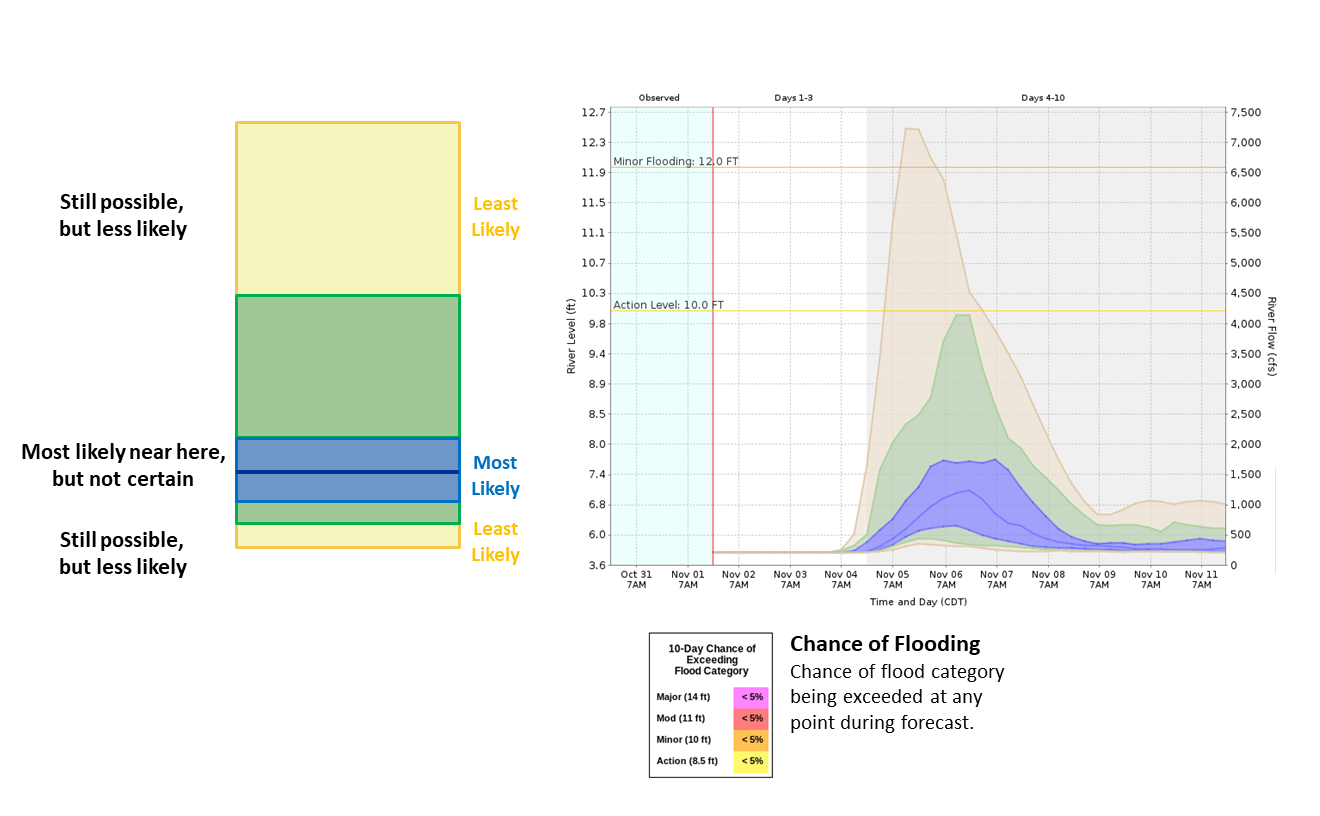
Understanding Short-Term Probabilistic Forecasts
Short-term probabilistic forecasts are provided for some river basins using the Hydrologic Ensemble Forecasting System (HEFS). HEFS simulates river forecasts based upon output from multiple weather model scenarios, each with a slightly different set of possible temperature and precipitation patterns. HEFS can provide a way of determining confidence in the river forecast, and also may provide additional notice of possible river rises. HEFS output should be used with caution because it is based upon raw computer model output with limited review by human forecasters. The example below shows how a output from HEFS may be used. Although HEFS is forecasting future river levels to be in or near the blue shaded area most of the time, some weather scenarios are causing water levels to be in, or even just outside of, the yellow shaded area. |
|
|
|
|
|
More Information |
|


