Chicago and Rockford Storm Total Snowfall Adjusted
After any significant weather event, the National Weather Service conducts a thorough assessment for historic and scientific accuracy. Before the February 1 and 2 blizzard, a disturbance ahead of the main storm produced some light accumulating snowfall the evening of January 31 through the early morning hours of February 1 at both Rockford and Chicago, as well as at the NWS office in Romeoville. There was also some light accumulation of lake effect snow, mainly north and west of Chicago (as far northwest as Rockford) during the day in some areas. This initial snow can be linked, meteorologically speaking, to the main blizzard event, even though there were some hours from the morning until the mid afternoon of February 1 where no snow, or only light snow occurred. The main part of the snowstorm then moved in from the southwest during the afternoon of February 1. After thorough review of the surface observations, radar data, and synoptic weather patterns, and discussion with many local TV meteorologists, it has been determined that all the snowfall should be counted as one event for the purpose of determining total snowfall for the blizzard. Initial blizzard total amounts mistakenly counted just the calendar day totals for February 1 and 2. However 1.0 inches of snow fell at Chicago, 0.8 inches fell at Rockford and 0.7 inches fell at Romeoville during January 31 which was actually part of the storm.
Therefore the “storm total” amounts for the January 31 – February 2, 2011 blizzard have been revised to;
| Chicago O'Hare | 21.2 inches |
| Rockford | 15.1 inches |
| Romeoville | 17.1 inches |
Furthermore, we reviewed past snowstorms to make sure consistent methods were used to determine totals. The January 1979 blizzard total of 18.8 inches in Chicago failed to include 1.5 inches that fell on the evening of January 12 as part of that storm. The storm total for January 12-14, 1979 should be 20.3 inches. This information was corrected based on hourly precipitation records and through consultation with local weather historians and former NWS employees who were involved with the storm.
Here is a revised top ten list of snowstorms. Chicago snowfall records date back to 1886, and Rockford snowfall records go back to 1906.
Chicago
1. 23.0 inches on January 26-27, 1967
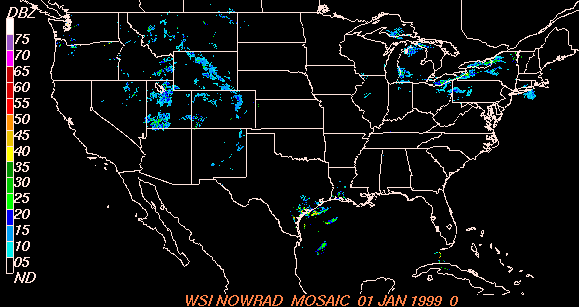
2. 21.6 inches on January 1-3, 1999
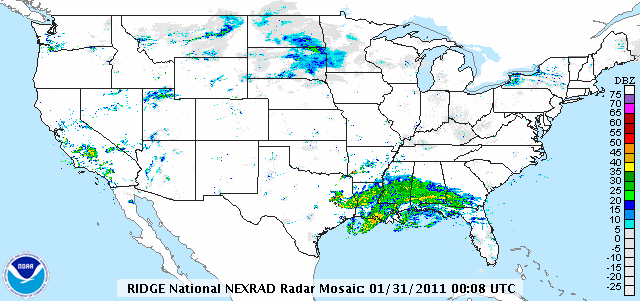
3. 21.2 inches on Jan 31-Feb 2, 2011
4. 20.3 inches on January 12-14, 1979
5. 19.2 inches on March 25-26, 1930
6. 16.2 inches on March 7-8, 1931
7. 14.9 inches on January 30, 1939
8. 14.9 inches on January 6-7, 1918
9. 14.8 inches on December 17-19, 1929
10. 14.3 inches on March 25-26, 1970
Rockford
1. 16.3 inches on January 6-7, 1918
2. 16.0 inches on March 30–31, 1926
3. 15.1 inches on Jan 31-Feb 2, 2011
4. 15.0 inches on March 21–22, 1932
5. 13.8 inches on March 1–2, 1948
6. 12.9 inches on December 11–13, 1909
7. 12.5 inches on February 10–11, 1944
8. 12.3 inches on January 11–14, 1979
9. 12.0 inches on January 17–19, 1943
10. 11.5 inches on January 14–15, 1943
Background
Like all other meteorological data, snowfall is recorded by calendar day. (The exception is volunteer observer sites, where measurements are typically taken from 700 AM to 700 AM.) Determining “storm total” snowfall for a snowstorm that spans two or more calendar days can be difficult, especially if snow that is unrelated to the main storm falls on the same calendar day before or after the main event. Because of this, calendar day snowfall records are part of the official climate database for major cities around the country. However, storm total snowfall records are considered “unofficial” and are mainly developed and maintained by local NWS offices and weather historians.
Determining the beginning and end of a snowstorm from the past is difficult to gage without knowing the meteorological circumstances. Therefore any list of “biggest” snowstorms that goes back 100 years or more is somewhat subjective. The purpose of these top ten lists is to put events into historical perspective. The information can be a useful way to generate public response to a forecast by warning people that “this storm could rival the horrific storm of 1967 or 1979.” People who remember the severity of past storms are more likely to prepare for the next big one. Some people also enjoy the “wow” factor and the “bragging rights” associated with surviving the worst that Mother Nature can throw at us. Adjustment of the “storm total” data does not change the official calendar day records at NCDC in any way.
With that in mind, please also be aware that snow measurement is an inexact science. One of the most difficult weather phenomena to measure accurately is snowfall. This is especially true when surface temperatures are near or above freezing and snow partially melts as it falls, or during windy conditions when considerable drifting occurs. Therefore, all snowfall records are the best estimates taken by dedicated, trained, experienced observers under difficult conditions.
Chicago’s Top Four Snowstorms – Which Was the Worst?
Jim Allsopp and Ricky Castro
There is a lot more to a snowstorm than the final tally of snowfall. We can also compare other components of winter storms, such as wind, temperature, and storm duration.
With this in mind, how do Chicago’s top four winter storms compare? We looked at many measurable factors. Midway Airport was the official climate site in 1967 and 1979. O’Hare was used for 1999 and 2011. Local weather historian Frank Wachowski also contributed to this story.
|
|
Jan 26-27 1967 |
Jan 12-14 1979 |
Jan 1-3 1999 |
Jan 31-Feb 2 2011 |
|
Snowfall (inches) |
23.0 |
20.3 |
21.6 |
21.2 |
|
Liquid Equivalent (inches) |
2.40 |
1.36 |
1.39 |
1.57 |
|
snow/liquid ratio |
9.6 to 1 |
14.9 to 1 |
15.5 to 1 |
13.5 to 1 |
|
duration of accumulating snow (hours) |
~29 |
~38 |
~54 |
~40 |
|
average snowfall intensity (inches per hour) |
0.8 |
0.5 |
0.4 |
0.5 |
|
peak wind gust (mph) |
53 |
39 |
43 |
61 |
|
maximum snow depth (inches) |
23 |
29 |
18 |
18 |
|
snow stayed on the ground through (number of days) |
March 9 42 days |
March 6 51 days |
January 23 21 days |
??? |
|
temperatures after the storm |
Jan 28-29 low 15/high 28 low 20/high 30 |
Jan 15-16 low -19/high 9 low -2/high 22 |
Jan 4-5 low -9/high 5 low -16/high 18 |
Feb 3-4 low -6/high 16 low 5/high 25 |
Looking at these numbers, the 1967 storm had the most snow, and the wettest/heaviest snow. It was also a very windy storm with significant drifting. The 1979 storm was followed by a brutal arctic blast and took the longest time to melt. Snow already on the ground from previous storms resulted in the deepest snow pack in 1979. The 1999 storm was massive and long lasting. It was also followed by very cold temperatures but not as much wind as the arctic blast following the 1979 storm. The 2011 storm had the most wind. We don’t have lightning data to compare, but this year’s storm likely produced more lightning than the other storms. Even small hail was reported at Midway the evening of February 1, 2011.
Only the 1967 and 2011 storms can be truly classified as blizzards, with sustained winds or frequent gusts of 35 mph or greater, and severely reduced visibility for a prolonged period of time. The 1979 storm had gusts over 35 mph toward the end of the event but didn’t have the reduced visibility. The visibility at O’Hare in this year’s storm was at or below ¼ mile for an incredible 11 consecutive hours from Tuesday evening into early Wednesday morning. Midway spent at least 2 hours late Tuesday evening with visibility down to 1/16 mile in heavy thundersnow and blowing snow.
The other component of the storms that is not as easy to quantify is the impact on commerce, transportation and human life. The 1967 storm paralyzed the city, shut down airports and closed schools for days. Estimates of 20,000 to 50,000 cars and 800 to 1000 buses were stuck or abandoned. About 60 people died as a result of the storm, 26 from heart attacks from snow shoveling.
The 1979 storm also caused severe problems with transportation. CTA trains weren’t equipped for snow removal and couldn’t get through the deep snow pack. Salt on railroad crossings also caused problems with CTA lines. O’Hare Airport was closed for 46 hours. Roofs collapsed under the weight of the snow. Chicagoans were so unhappy with the snow removal, that it played a key role in the following mayoral election.
The 1999 storm was well forecast, spread out over a long duration, and occurred on a long holiday weekend. Those factors helped mitigate the impact on transportation and commerce. Lake Shore Drive was shut down for the first time ever.
The 2011 storm was also well forecast. The advanced notice of the storm, better communications and planning, and better snow clearing techniques resulted in far less disruption. As a result, the number of stranded vehicles with this year’s storm was an order of magnitude lower than the 1967 blizzard, but the photos and footage of the stranded vehicles on Lake Shore Drive will leave an indelible imprint on the minds of many. Eleven people died as a result of the 2011 storm.
Anyway you look at it the January 31-February 2 blizzard certainly was an incredible storm, and one Chicagoans will talk about for years to come.
What do you think?
6-hour snowfall accumulation tables from 1/31 to 2/2 for Chicago, Rockford and the NWS Office in Romeoville
|
O'Hare Statistics: Snowfall Monday Night 1/31 through Tuesday Morning 2/1: 1.2" Snowfall Total- Tuesday Afternoon through Wednesday Morning: 20.0" avg 1"/hour snowfall rates! 1/31 through 2/2 Three-Day Storm Total Snowfalll: 21.2" Record Calendar Day Total for 2/1 and the Entire Month of February set: 13.6" |
||||||||||||||||||||||||||||||
|
Rockford Statistics: Snowfall Monday Night through Tuesday Morning: 1.1" Snowfall Total- Tuesday Afternoon through Wednesday Morning: 14.0" 1/31 through 2/2 Three-Day Storm Total Snowfall: 15.1" Record Calendar Day Total for 2/1 set: 10.9" |
||||||||||||||||||||||||||||||
|
Romeoville Statistics: Snowfall Monday Night through Tuesday Morning: 0.8" Snowfall Total- Tuesday Afternoon through Wednesday Morning : 16.3" 1/31 through 2/2 Three-Day Snowfall Total: 17.1" |
||||||||||||||||||||||||||||||
As always, many thanks to our trained weather observers who provided us with as accurate as possible snowfall measurements during extremely difficult conditions to measure snowfall!!
1999 vs 2011 Storm - Radar Imagery