| Valentines Day Weather for Northern Illinois: Statistics for Chicago and Rockford
Chicago:
The following statistics comprises 145 years of data. However snowfall data started in 1885 so it comprises 133 years. Data collection began at the University of Chicago, then at Midway, and currently at O'Hare which is now the official station for Chicago.
 |
Frequency distribution of high temperatures for Chicago. This dataset shows that the most frequent range of high temperatures on Valentine’s Day is in the 30 to 39 degree range. The normal high temperature at Chicago is 35 degrees, which falls right in that range. The record high temperature on Valentine's Day is 62 degrees set in 1954. The record lowest high temperature on Valentine’s Day is 8 degrees, which occurred in 1879 and 1943. In 2017, the high temperature was 50 degrees.
|
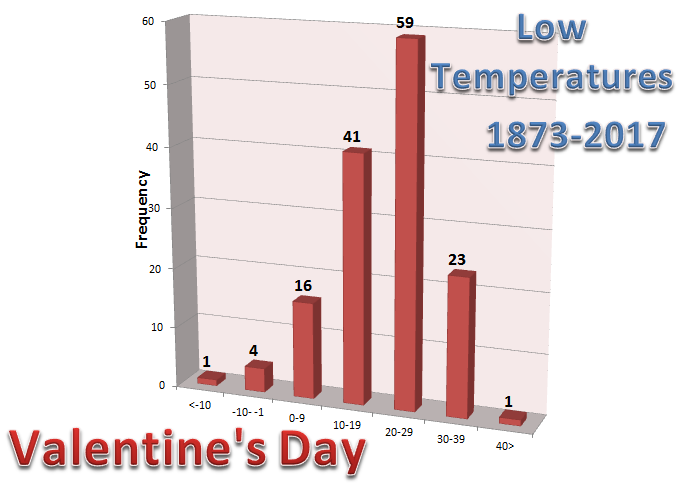 |
Frequency distribution of low temperatures for Chicago. This dataset shows that the most frequent range of low temperatures on Valentine’s Day is in the 20 to 29 degree range. The normal low temperature at Chicago is 20 degrees which falls in that range. The record low temperature for Chicago on Valentine's Day is 11 below set in 1905. The record highest low on Valentine’s Day is 43 in 1954. The low temperature in 2017 was 31 degrees.
|
 |
Frequency distribution of precipitation for Chicago. This dataset shows that the most frequent amount of precipitation recorded on Valentine’s Day is 0.00”, which accounts for 39% of the days in the dataset. The next most frequent range is a Trace followed by the 0.02” to 0.25” range. The highest amount of precipitation on Valentine’s Day occurred in 1950 when 0.94” of precipitation fell. There has never been an instance of over an inch of precipitation on Valentine’s Day. In 2017, no precipitation fell.
|
 |
Frequency distribution of snowfall for Chicago. This dataset shows that the most frequent amount of snowfall recorded on Valentine’s Day is 0.0”, which accounts for 50% of the days in the dataset. The next most frequent range is a Trace, followed by 0.1” to 0.9”. The highest amount of snowfall recorded on Valentine’s Day occurred in 1990 when 8.3” of snow fell. In 2017, no snow fell.
|
|
ADDITIONAL VALENTINE'S DAY CLIMATE DATA ( * MEANS LAST OCCURRENCE)
62
1954 |
43
1954 |
0.94
1950 |
8.3
1990 |
61
1918 |
37
2005 * |
0.78
1990 |
3.3
1973 * |
58
1887 |
36
1919 * |
0.66
1909 |
2.4
1991 * |
56
2006 * |
35
1967 * |
0.59
1883 |
55
1984 |
34
1947 * |
0.54
1908 |
53
1915 |
33
2013 * |
0.48
1890 |
51
1883 * |
32
1926 * |
0.41
1973 |
50
2017 * |
31
2017 * |
0.39
1887 |
49
2005 * |
29
2012 * |
0.34
1988 |
47
1999 * |
28
2001 * |
0.26
1949 |
| |
8
1943 * |
-11
1905 |
0.00
2017 * |
0.0
2017 * |
10
1923 |
-3
1943 |
T
2015 * |
T
2012 * |
14
1905 |
-2
1879 |
0.01
2009 * |
0.1
2009 * |
15
1875 |
-1
1923 * |
0.02
1978 * |
18
2016 |
0
1946 * |
0.03
2007 * |
19
1985 |
1
2015 * |
0.04
1972 * |
21
2007 * |
2
1884 |
0.05
1986 * |
22
2014 * |
4
1985 * |
0.06
1985 |
23
1951 * |
5
1971 |
0.07
1918 |
24
1946 * |
6
1986 * |
0.08
1958 |
ACS 2/13/2018

