Overview & Graphics
.png) |
 |
|
Summer 2022 was close to normal across northeastern Illinois and northwest Indiana in terms of temperatures. Precipitation was very different across the area with a below normal values over the Chicago metro and northwest Indiana, while the Rockford area and northwestern Illinois saw above normal precipitation this summer. |
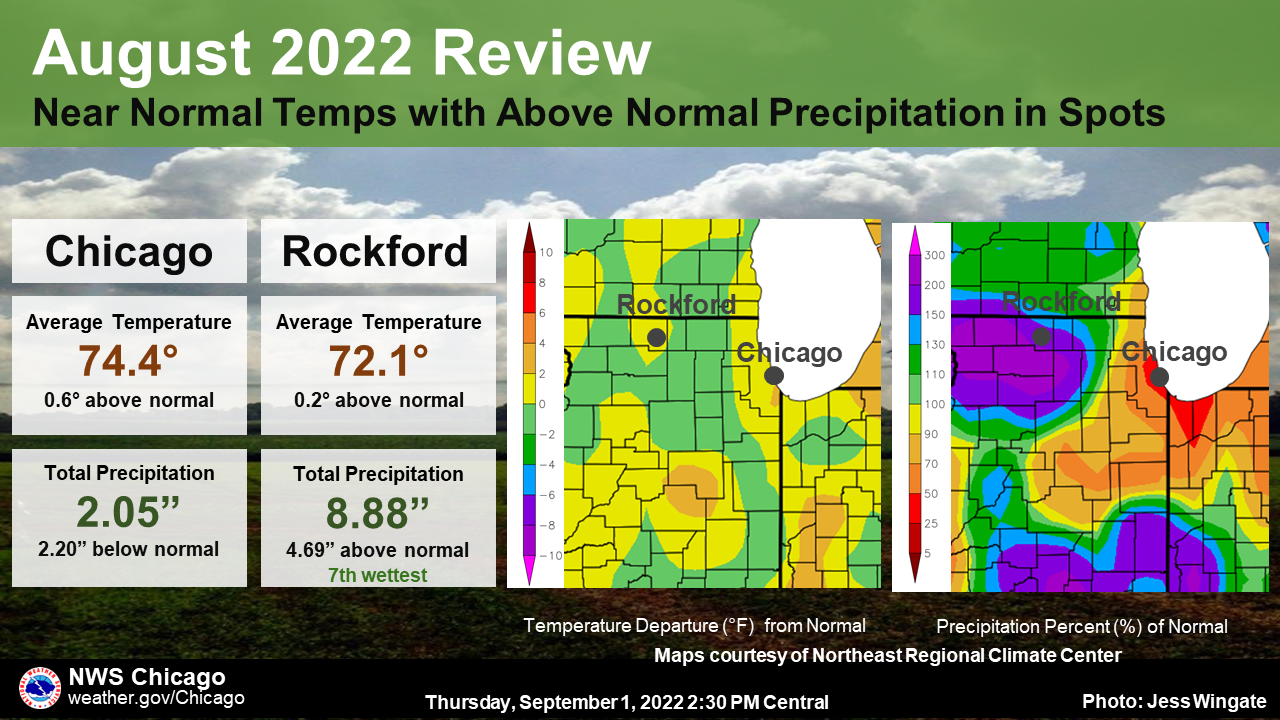
August 2022 saw near normal temperatures across northeastern Illinois and northwest Indiana, as these areas were around a half of a degree above normal. Precipitation was rather different across the area with below normal precipitation across the Chicago metro and northwestern Indiana and well above normal precipitation over the Rockford area. |
...A Look Back at the Climate for Meteorological Summer (June, July,
August) 2022 for Chicago and Rockford...

At Chicago, the average high temperature for the summer season was
83.0 degrees, which is 0.5 degrees above the 1991 to 2020
average. The average low temperature was 64.8 degrees, which is
0.7 degrees above normal. The mean temperature for the season was
73.9 degrees, which is 0.6 degrees above normal. A total of 9.21
inches of precipitation was recorded during this past summer,
which is 2.85 inches below normal.

Records established or tied during the summer months:

June:
* Record daily high temperature of 96 degrees on June 15th.

July: None.

August: None.


At Rockford, the average high temperature was 83.6 degrees, which
is 1.4 degree above normal. The average low temperature was 61.3
degrees, which is 0.4 degrees below normal. The mean temperature
for the season was 72.4 degrees, which is 0.5 degrees above
normal. A total of 16.52 inches of precipitation was recorded
during this past summer, which was 3.29 inches above normal.

Records established or tied during the summer months:

June:
* Tied the daily record high of 98 degrees on June 14th.
* Set the daily record high of 97 degrees on June 15th.
* Tied the daily high minimum temperature of 74 on June 15th.
* Tied the daily record low of 46 degrees on June 19th.
* Tied the daily record high of 100 degrees on June 21st.

July: None.

August:
* Record daily rainfall of 3.23 inches on August 8th.
** 7th wettest August on record with 8.88 inches of precipitation.
Latest Seasonal Climate Report: Chicago | Rockford
...A Look Back at the Climate for the Month of August 2022 for
Chicago and Rockford...

At Chicago, the average high temperature was 83.0 degrees, which
is 0.5 degrees above normal. The average low temperature was 65.7
degrees, which is 0.6 degrees above normal. The average
temperature for the month was 74.4 degrees, which is 0.6 degrees
above normal. During the month of August, 2.05 inches of
precipitation were recorded, which is 2.20 inches below normal.

There were no records set during the month of August 2022 for
Chicago.


At Rockford, the average high temperature was 82.4 degrees, which
is 0.4 degrees above normal. The average low temperature was 61.8
degrees, which is right at normal. The average temperature for
the month was 72.1 degrees, which is 0.2 degrees above normal.
During the month of August, 8.88 inches of precipitation were
recorded, which is 4.69 inches above normal.

There was one daily record for Rockford during the month of
August 2022:
* Record daily precipitation of 3.23 inches on the 8th.

One Top Ten Monthly Record:
** Seventh wettest August on record since 1905 with 8.88 inches.
Events