Chicago and Rockford Seasonal Summary
PUBLIC INFORMATION STATEMENT
NATIONAL WEATHER SERVICE CHICAGO/ROMEOVILLE IL
1332 PM CST SAT DEC 1 2018

...A Look Back at the Climate for Meteorological Fall (September,
October, November) 2018 for Chicago and Rockford...

At Chicago, the average high temperature for the fall season was
59.3 degrees, which is 2.5 degrees below the 1981 to 2010 average.
The average low temperature was 44.8 degrees, which is 1.6 degrees
above normal. The mean temperature for the season was 52.1 degrees,
which is 0.4 degrees below normal.

A total of 11.68 inches of precipitation was recorded during this
past fall, which is 2.17 inches above normal. There was a total of
12.7 inches of snow recorded at Chicago, which is 11.3 inches above
normal.

Records established or tied during the fall months:

September: Record daily high temperature of 93 degrees on the 20th.

October: Record daily precipitation of 1.56 inches on the 1st.

November: Record daily precipitation of 1.20 inches on the 26th.

At Rockford, the average high temperature was 58.1 degrees, which is
3.8 degrees below normal. The average low temperature was 40.8
degrees, which is 0.3 of a degree below normal. The mean temperature
for the season was 49.4 degrees, which is 2.1 degrees below normal.

A total of 13.02 inches of precipitation was recorded during this
past fall, which was 4.42 inches above normal. In addition, a total
of 15.8 inches of snow was recorded, which is 14 Inches above normal.

Records established or tied during the fall months:

September: None.

October: Record daily precipitation of 1.65 inches on the 1st.
Record daily low temperature of 22 degrees tied on the 22nd.
Record daily precipitation of 1.36 inches on the 30th.

November: Record daily snowfall of 1.8 inches on the 9th.
Record daily snowfall of 2.1 inches on the 17th.
Record daily snowfall of 11.7 inches on the 25th.

Record Snowfall of 15.8 inches for the fall season.
Latest Seasonal Climate Report: Chicago | Rockford
Chicago and Rockford Monthly Summary
PUBLIC INFORMATION STATEMENT
NATIONAL WEATHER SERVICE CHICAGO/ROMEOVILLE IL
1230 PM CST SAT DEC 1 2018
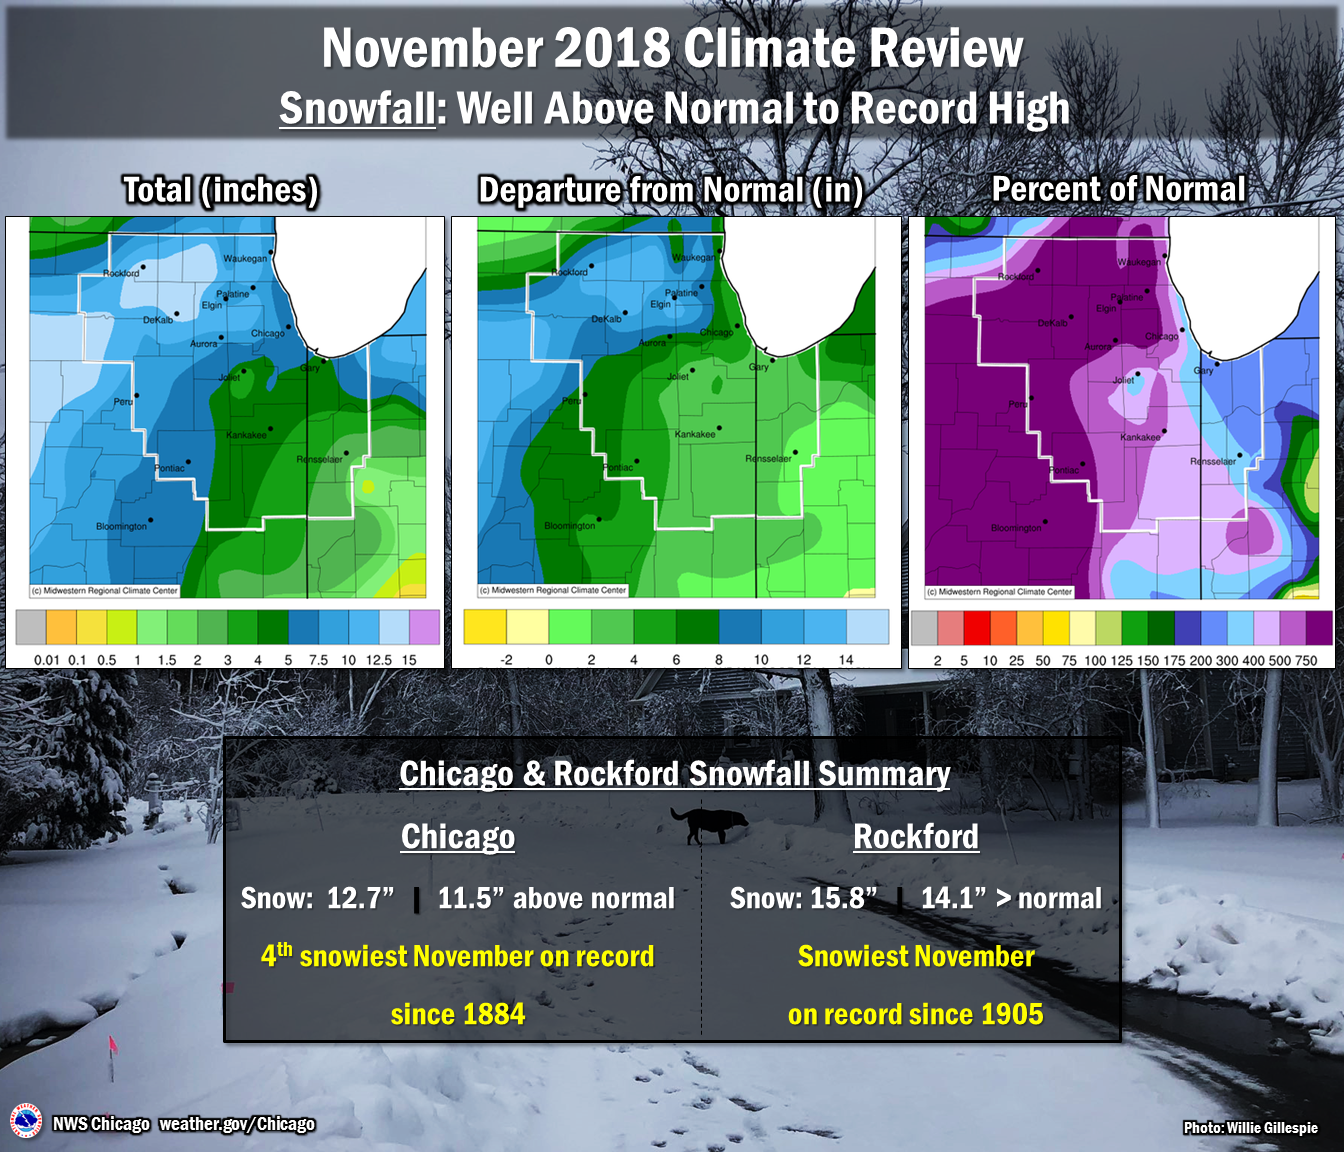
..A Look Back at the Climate for the Month of November 2018
for Chicago and Rockford...
At Chicago, the average high temperature was 39.7 degrees, which is
8.5 degrees below normal. The average low temperature was 29.4
degrees, which is 3 degrees below normal. The average temperature
for the month was 34.6 degrees which is 5.7 degrees below normal.
During the month of November, 3.24 inches of precipitation were
recorded, which is 0.09 of an inch below normal. 12.7 inches of snow
were recorded, which is 11.5 inches above normal.
One record was set for Chicago for the month of November 2018:
* Record daily precipitation of 1.20 inches on the 25th.
One Top Ten Monthly Records:
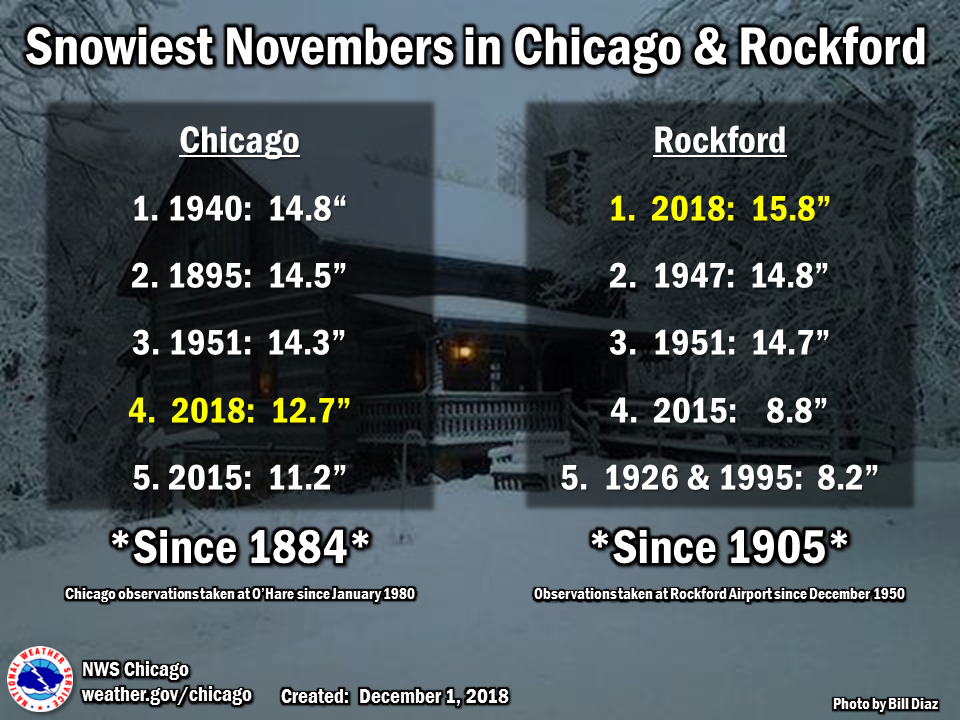
**4th Snowiest November on record since 1874 with 12.7 inches.
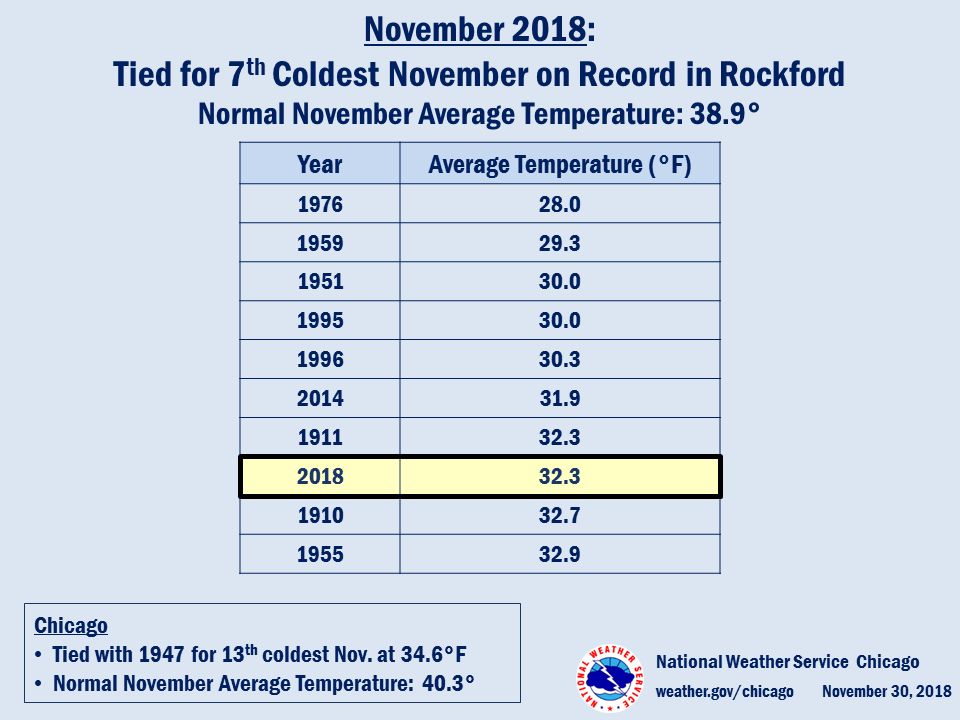
At Rockford, the average high temperature was 38.4 degrees, which is
9.2 degrees below normal. The average low temperature was 26.3
degrees, which is 4 degrees below normal. The average temperature
for the month was 32.3 degrees, which is 6.6 degrees below normal.
During the month of November, 2.06 inches of precipitation were
recorded, which is 0.52 of an inch below normal. 15.8 inches of snow
were recorded, which is 14.1 inches above normal.
There were 3 records for Rockford for the month of November 2018:
* Record daily snowfall of 1.8 inches on the 9th.
* Record daily snowfall of 2.1 inches on the 17th.
* Record daily snowfall of 11.7 inches on the 25th.
Two Top Ten Monthly Records:
**Tied for 7th Coldest November on record since 1906 with 32.3
degrees.
**Snowiest November on record since 1905 with 15.8 inches.
Latest Monthly Climate Report: Chicago | Rockford