|
4th of July Weather for Northern Illinois: Statistics for Chicago and Rockford
Chicago:
The following statistics comprises 145 years of data. Data collection began at the University of Chicago, then at Midway, and currently at O'Hare which is now the official station for Chicago.
To see the daily climate data for Chicago for July 4th's from 1872-Present, click here.
 |
Frequency distribution of high temperatures for Chicago. This dataset shows that the most frequent range of high temperatures on the 4th of July is in between 80 and 89 degrees, which is the warmest of all the holidays. The normal high for the 4th is 84 degrees, which falls in the range of the most frequent highs. The record high is 102 degrees set in 2012 and also 1911. The coldest high temperature on the 4th is 62 degrees which occurred in 1920. In 2016, the high temperature was 79 degrees.
|
 |
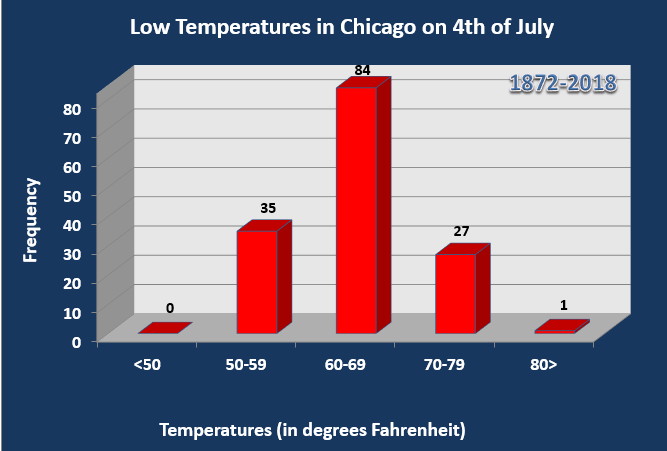
Frequency distribution of low temperatures for Chicago. This dataset shows that the most frequent range of low temperatures on the 4th of July is in between 60 and 69 degrees, which is the warmest of all the holidays. The normal low for the 4th is 63 degrees, which falls in the range of the most frequent lows. The record low is 50 which occurred in 1972. The highest low temperature for the 4th was 80 degrees in 1921. In 2016, the low temperature was 66 degrees.
|
 |
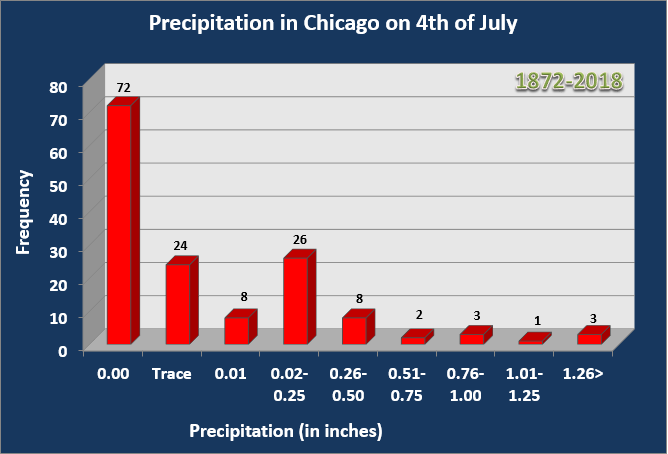
Frequency distribution of precipitation for Chicago. This dataset shows that the most frequent amount of precipitation recorded on the 4th of July is 0.00”, which accounts for 49% of the days in the dataset. The next most frequent range is the 0.02” to 0.25”, closely followed by a trace of precipitation. The record amount of rainfall on the 4th of July occurred in 1995 when 1.72” of rain fell. There have been 4 instances dating back to 1872 where over an inch of rain fell on the 4th of July. In 2016 no rain fell.
|
|
ADDITIONAL 4th OF JULY CLIMATE DATA ( * MEANS LAST OCCURRENCE)
102
2012 * |
80
1921 |
1.72
1995 |
98
1949 |
79
2012 * |
1.60
1883 |
96
1990 * |
78
1911 * |
1.38
1873 |
95
1921 * |
77
1990 * |
1.02
1888 |
94
2003 * |
75
1993 * |
0.91
1942 |
93
1999 |
74
1994 * |
0.90
1958 |
92
1955 |
73
2003 * |
0.85
1899 |
91
2010 * |
72
1955 |
0.74
1973 |
90
2002 * |
71
1975 * |
0.60
1915 |
89
2011 * |
70
2004 |
0.48
1880 |
| |
62
1920 |
50
1972 |
0.00
2016 * |
63
1909 * |
51
1996 |
T
2012 * |
64
1967 * |
52
2008 * |
0.01
2004 * |
65
1890 |
53
1967 |
0.03
1909 * |
66
1997 * |
55
1942 * |
0.05
1992 * |
67
1961 |
56
2013 * |
0.06
1959 |
68
1972 * |
57
1992 * |
0.07
1956 |
69
1956 * |
58
2014 * |
0.08
1997 * |
70
1872 |
59
2015 * |
0.09
1991 * |
71
1970 * |
60
1986 * |
0.10
2005 * |
Updated 6/24/2017